Introduction
Historically, physical restraints have been used in centres providing care for older adults to avoid adverse effects. Along with falls prevention, dementia and cognitive deterioration are two of the precipitating factors for restraining residents in nursing homes (Huizing et al., Reference Huizing, Hamers, Gulpers and Berger2009; De Bellis et al., Reference De Bellis, Mosel, Curren, Prendergast, Harrington and Muir-Cochrane2013; Huang et al., Reference Huang, Huang, Lin and Kuo2014). However, the use of physical restraints has been widely questioned: there are physical, behavioural and social (i.e. isolation) consequences, as well as ethical issues. For this reason, this topic presents challenges to the health-care system in social and economic terms (Gastmans and Milisen, Reference Gastmans and Milisen2005).
Use of physical restraints and consequences
Ageing involves physical and cognitive deterioration. Limited functionality and impaired balance can lead to an increase in the number of falls. These events are even more frequent in long-term care facilities for older adults, where approximately half of the institutionalised residents suffer at least one fall per year (Rubenstein and Josephson, Reference Rubenstein and Josephson2002; Panel on Prevention of Falls in Older Persons (American Geriatrics Society and British Geriatrics Society), 2011). Along with physical exercise, the main preventive measure in nursing homes is the use of bedrails and the application of physical restraints (Aranda-Gallardo et al., Reference Aranda-Gallardo, Morales-Asencio, Enriquez de Luna-Rodriguez, Vázquez-Blanco, Morilla-Herrera, Rivas-Ruiz, Toribio-Montero and Canca-Sanchez2018). However, the prolonged use of such devices may reduce the residents’ functional capacity, since limited mobility has physical consequences. These include loss of muscle tone and contractures, appearance of pressure ulcers, increased dependence in daily life activities and reduced balance abilities, among others (Sullivan-Marx et al., Reference Sullivan-Marx, Strumpf, Evans, Baumgarten and Maislin1999; Mohsenian et al., Reference Mohsenian, Verhoff, Risse, Heinemann and Puschel2003; Williams and Kemper, Reference Williams and Kemper2010; Hofmann and Hahn, Reference Hofmann and Hahn2014; Hofmann et al., Reference Hofmann, Schorro, Haastert and Meyer2015). This, in turn, may increase the risk of falls and accidents, as well as the risk of mortality caused by strangulation or as a consequence of serious injuries, e.g. fracture or head trauma (Gastmans and Milisen, Reference Gastmans and Milisen2005).
Another trigger using restraints is cognitive deterioration and behavioural disorders of residents. The literature shows that those facilities with the greater number of residents with dementia present a higher prevalence of physical restraints (Wagner et al., Reference Wagner, McDonald and Castle2013). But in turn, the use of restraints is also associated with negative psychological consequences. These include anxiety, depression and decline in social interaction, while in older adults with dementia the use of physical restraint has been reported to be the main precipitating factor of delirium (Sullivan-Marx et al., Reference Sullivan-Marx, Strumpf, Evans, Baumgarten and Maislin1999; Mohsenian et al., Reference Mohsenian, Verhoff, Risse, Heinemann and Puschel2003; Gastmans and Milisen, Reference Gastmans and Milisen2005; Williams and Kemper, Reference Williams and Kemper2010; Voyer et al., Reference Voyer, Richard, Doucet, Cyr and Carmichael2011; Hofmann and Hahn, Reference Hofmann and Hahn2014; Hofmann et al., Reference Hofmann, Schorro, Haastert and Meyer2015; Freeman et al., Reference Freeman, Spirgiene, Martin-Khan and Hirdes2017).
Ethical considerations
From an ethical perspective, the use of physical restraints is highly questionable (Hofmann et al., Reference Hofmann, Schorro, Haastert and Meyer2015). When physical restraints are used, whether for organisational purposes, to comply with tight schedules or to compensate for the lack of institutional staff, the fundamental rights of the person may be violated. Physical restraints limit mobility and, therefore, the liberty, autonomy and dignity of the individuals, something that can be degrading for the residents and breach their human rights. For this reason, there are norms and values that care-givers need to consider and that are important for an ethical evaluation of the use of physical restraint in nursing homes: respect for dignity and autonomy, and promotion of overall wellbeing and self-reliance (Gastmans and Milisen, Reference Gastmans and Milisen2005).
Current trends
For these consequences, the minimisation or complete abolition of physical restraints represent important quality indicators for those institutions providing care to older adults (Caprio et al., Reference Caprio, Katz and Karuza2008; Wagner et al., Reference Wagner, McDonald and Castle2012). Several authors have striven for alternative measures in nursing homes. Among them, environmental modifications such as wheelchair adaptations and alternative seating, and alterations in the type of nursing care provided such as additional supervision and schedules to support residents with going to the bathroom, as well as more innovative proposals involving surveillance technology, have been applied (Zwijsen et al., Reference Zwijsen, Depla, Niemeijer, Francke and Hertogh2012). In this regard, the diverse proposals have shown different degrees of success (Haut et al., Reference Haut, Köpke, Gerlach, Mühlhauser, Haastert and Meyer2009; Huizing et al., Reference Huizing, Hamers, Gulpers and Berger2009; Johnson et al., Reference Johnson, Curry, Steubing, Diana, McCray, McFarren and Domb2016).
Prevalence of physical restraints
While current trends advocate for the reduction in the use of restraints, emerging literature shows that the prevalence in nursing homes and long-term care centres is highly varied depending on the country. Defining the term prevalence as the proportion of older adults who use at least one type of physical restraint, the lowest figures have been reported in Switzerland, France, England and Germany (0.6–6%) (Meyer et al., Reference Meyer, Möhler and Köpke2009b; Heinze et al., Reference Heinze, Dassen and Grittner2012). Outside Europe, it contrasts with the figures of the United States of America (USA) (1.1–6%) (Laurin et al., Reference Laurin, Voyer, Verreault and Durand2004; Martin and Mathisen, Reference Martin and Mathisen2005; Feng et al., Reference Feng, Hirdes, Smith, Finne-Soveri, Chi, Du Pasquier, Gilgen, Ikegami and Mor2009). In Spain, a prevalence of 39 per cent was reported back in 1997, and of 18 per cent in 2014 (Cabello et al., Reference Cabello, Trinidad, Cordero, Fernandez, Ruiz, Pecharroman and Ovejero2008; Muñiz et al., Reference Muñiz, Gomez, Curto, Hernandez, Marco, Garca, Tomas and Olazarn2016; Tortosa et al., Reference Tortosa, Granell, Fuenmayor and Martinez2016). A more recent study conducted in the Canary Islands detected a prevalence of 36 per cent, which reached up to 86 per cent when considering bedrails (Estevez-Guerra et al., Reference Estevez-Guerra, Fariña-López, Núñez-González, Gandoy-Crego, Calvo-Francés and Capezuti2017). It may be noticed that the prevalence in Spain appears to be substantially higher than in the aforementioned countries. However, these figures are dependent on different definitions of physical restraint, characteristics of the facilities, current legislation and design of the research involving different data collection approaches (Estevez-Guerra et al., Reference Estevez-Guerra, Fariña-López, Núñez-González, Gandoy-Crego, Calvo-Francés and Capezuti2017).
What is already known
Overall, previous research in nursing homes has targeted either general or specific populations, for instance residents with cognitive disorders (Hofmann et al., Reference Hofmann, Schorro, Haastert and Meyer2015) or having specific medications, by implementing cross-sectional, prospective and retrospective research (Meyer et al., Reference Meyer, Köpke, Haastert and Mühlhauser2009a). The literature has provided information on prevalence data and framed the characteristics of the residents in nursing homes, usually setting the odds of using restraints by applying logistic regression models. The approach is commonly used in epidemiological studies, but it has the disadvantage of being often based on arbitrary cut-offs and independent risk factors (Heinze et al., Reference Heinze, Dassen and Grittner2012; Fariña-López et al., Reference Fariña-López, Estevez-Guerra, Gandoy-Crego, Polo-Luque, Gómez-Cantorna and Capezuti2014; Hofmann and Hahn, Reference Hofmann and Hahn2014; Huang et al., Reference Huang, Huang, Lin and Kuo2014). The literature agrees that the use of restraints is positively associated with the physical and cognitive deterioration residents present in nursing homes, so the probability of using some type of restraint increases with dementia and functional limitations, as well as other factors such as age (Hofmann and Hahn, Reference Hofmann and Hahn2014). Likewise, it has been reported that despite greater awareness and advances in training, the knowledge, attitudes and practices towards the minimisation of the use of restraints are still insufficient. Therefore, the alternatives aimed at reducing the use of restraints should be based on the current knowledge of this issue from a global, but also individual perspective, taking into account the physical and psycho-social reality of the nursing home resident.
Justification, contribution to current literature and research question
Nonetheless, comprehensive studies are scarce in Spain, with no official data at the national level. This fact primarily motivated this research, which was conducted by extracting data from electronic databases from five nursing homes of the Valencian Community. The data allowed estimation of the prevalence and analysis of the nursing home residents’ characteristics. In addition to performing a traditional logistic regression analysis to process the data and estimate the odds of using restraints, a novel contribution was proposed for this work: a data-processing approach based on self-organised maps (SOM) (Kohonen, Reference Kohonen1998). A SOM is a non-linear method for data analysis exploration based on an unsupervised multivariate partitioning technique. The proposal was used to assess, in a visual way, the possible interactions between the physical and cognitive characteristics of the residents and their multiple associations with the use of restraints. This way, this work provides a broader view of the reality of the nursing home residents. Specifically, the characteristics of the sample were categorised according to the risk of falling, level of dependency, cognitive status and nutritional risk of the resident, in order to resolve whether the multiple interactions of the characteristics were actually associated with the use of physical restraint. To do so, residents with similar characteristics were clustered, and an assessment of whether these were somehow associated with the use of physical restraints or not was performed.
Methods and data
Design and participants
This was a retrospective cohort study using data from five nursing homes from the Valencian Community, Spain. The data were collected in 2013 and anonymised at the origin with numerical coding. For the construction of the cohort, all the internal residents from 2008 to 2013 were included.
Ethics
The study adhered to the International Guidelines for the Ethical Review of Epidemiological Studies and the recommendations of the Spanish Society of Epidemiology on the revision of the ethical aspects of epidemiological research. The research was approved by the Ethics Committee of the General Directorate of the Public Health-Centre for Research in Public Health of Valencia (approval number 2013/06/13).
Characteristics of the nursing homes
The nursing homes were five publicly subsidised residences from the Valencian Community, Spain, placed in urban locations. The residences had places to stay in a permanent regime or a day centre. The number of places ranged from 120 to 140 residents. The residences were provided with qualified personnel for the direct attention of the residents, including medical and nursing services, occupational therapists, psychologists, physiotherapists and social services. The ratio of staff per resident adheres to the order of the Conselleria de Bienestar Social (Department of Social Welfare) of the Valencian Community (DOGV4945). Included facilities used common registration and information systems, and a single protocol for the application of physical restraints. These were mandatorily prescribed by a medical doctor, while the nursing home resident or the responsible person had to sign a document authorising the application of the device.
Data collection and information on registries
Data were extracted by the main investigator, who anonymised the registries at origin with numerical coding. Data were collected from the electronic information systems used in the residences (ResiPlus® software v3.0.11). In addition to the socio-demographic variables, the registers included the recording of various assessments of physical functioning, cognitive and nutritional status, treatments, follow-ups, interventions, and events such as falls and deaths. Moreover, the system allowed the use of physical restraint to be registered by recording the date, the type of restraint and the motivation for its application.
For this study, the data collected were the information regarding the use of restraint (i.e. type), the motivation and the residents’ characteristics. The latter were based on the scores in those validated rating systems that are routinely used by health-care professionals to assess the residents’ physical and cognitive status. The rating systems provided information on the level of dependence, mobility, functional ability, cognitive condition and nutritional status. Specifically, the validated version by Lobo of the Mini-Mental State Examination (MMSE) categorised the cognitive impairment of the resident as severe (0–14), high (15–19), moderate (20–24), mild (25–30) or intact (31–35) (Lobo et al., Reference Lobo, Saz, Marcos, Diaz, de la Camara, Ventura, Morales-Asin, Pascual, Montanes and Aznar1999). The Barthel Index categorised the level of dependence as total (0–19), severe (20–39), moderate (40–59), mild (60–79) or independent (80–100) (Collin et al., Reference Collin, Wade, Davies and Horne1988). The Tinetti Mobility Test assessed balance, mobility and the functional abilities of the older adult, which was used to predict the risk of falling, being very high (0–11), high (12–19) or low (20–24) (Tinetti, Reference Tinetti1986; Thomas and Lane, Reference Thomas and Lane2005). The Mini-Nutritional Assessment (MNA) categorised individuals in situations of malnourishment (0–16), at risk of malnutrition (17–23.5) or with a normal nutritional status (>24) (Izaola et al., Reference Izaola, de Luis Roman, Cabezas, Rojo, Cuellar, Terroba and Gonzalez Sagrado2005). A team formed by a physician, a nurse, a physiotherapist and a psychologist were in charge of assessing the Barthel Index, the MNA, the Tinetti Mobility Test and the MMSE, respectively.
Data rigour
Retrospective studies analysing data extracted from registries may present implicit and non-implicit limitations as is later described in the Discussion section, with possible biases related to risk factors, impact of events or other measures. For this reason, the loss of observations has been reported, and possible measures have been taken in order to reduce its impact on the results. The entire data-set was systematically checked by the biometrician of this research. To ensure completeness and correctness, a random sample of 15 per cent of the data was independently checked by two investigators. The inter-rater agreement was over 97 per cent.
Data analysis
Data were analysed with the IBM SPSS Statistics 22.0 software and Matlab® (The MathWorks, Natick, MA, USA). Descriptive statistics were used to extract the demographics. The residents were categorised into two groups, those who were and were not physically restrained. The prevalence of residents with at least one restraint, as well as the prevalence per type of restraint, was estimated.
Physical restraint is defined as: ‘any action or procedure that prevents a person's free body movement to a position of choice and/or normal access to his/her body by the use of any method, attached or adjacent to a person's body that he/she cannot control or remove easily’ (Bleijlevens et al., Reference Bleijlevens, Wagner, Capezuti and Hamers2016:3). Several proposals for classifying physical restraints which are based on different criteria may be found in the literature (Spanish Society of Geriatric and Gerontological Nursing, 2003; O'Connor et al., Reference O'Connor, Horgan, Cheung, Fisher, George and Stafrace2004; Gobert, Reference Gobert2005). In this research, we estimated prevalence data considering those devices that were specifically designed to restrict the freedom of movement of the person. Similarly to previous studies (O'Connor et al., Reference O'Connor, Horgan, Cheung, Fisher, George and Stafrace2004; Estevez-Guerra et al., Reference Estevez-Guerra, Fariña-López, Núñez-González, Gandoy-Crego, Calvo-Francés and Capezuti2017), we categorised the use of restraints into the following categories: bed (i.e. vest, perineal-abdominal), chair (i.e. vest, sheet with zipper) and hand-wrist. We did not consider the use of those devices that may be also used to restrict mobility, but which were not actually produced for this purpose (handrails, tables or trays, gloves), as will be discussed later. To estimate prevalence, Wilson's confidence intervals (CI) for binomial proportions were set at 95 per cent (Wilson, Reference Wilson1927).
Possible discrepancies between residences regarding the prevalence of restrictions were compared with the frequency chi-square test. In addition, the motivation to use physical restraint was analysed and categorised as high risk of falling due to cognitive or physical impairment, not maintaining a sitting position by own means, episode of physical aggression that cannot be solved by other means, the removal of essential sanitary measures and other reasons.
The rating systems used to assess the residents’ cognitive and physical condition were categorised and expressed in frequencies, according to the previously established ranges. To determine possible associations between the scores and the use of restraints, both groups were compared. First, the probability of distributions was assessed with Shapiro–Wilk, and comparisons between the distributions were performed with t-tests or Wilcoxon accordingly. The chi-square test was used for categorical variables and Kruskal–Wallis for multiple comparisons. A generalised logistic linear regression model that included cofounding factors such as age and length of stay estimated odds ratios by using physical restraint as the dependent variable (0 = no; 1 = yes), and the MMSE, Tinetti Mobility Test, Barthel Index and MNA outcomes as the independent variables.
A multivariate analysis was carried out by means of a SOM design (Kohonen, Reference Kohonen1998). The SOM package from Matlab® was used. This approach is generally used to classify and extract relationships between the different variables that are related to a specific problem. SOM is an unsupervised data-partitioning technique, used in this work in order to cluster the residents according to their characteristics and to explore possible associations between the measured tests visually. The SOM is briefly described in Appendix 1 so that those readers who are not familiar with the analysis may interpret the results.
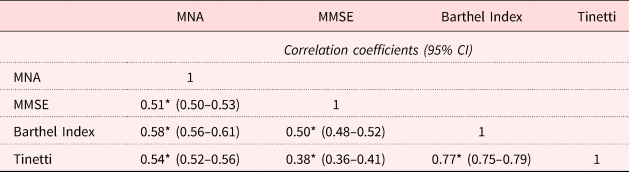
Finally, the correlation matrix between the different variables was calculated through a Pearson's r to reinforce the visual analysis.
Findings
A total of 1,634 residents with a mean age of 81.3 (standard deviation = 6.2) were included in the analyses, with the majority being women (1,101, 67.4%). The reasons for the use of restraints were the high risk of falling due to cognitive (63.9%) or physical impairment (14.9%), as well as not maintaining a sitting position by own means (13%), episodes of physical aggression that cannot be solved by other means (2%), the removal of probes, tracks or other essential sanitary measures (6%) and other reasons (0.2%).
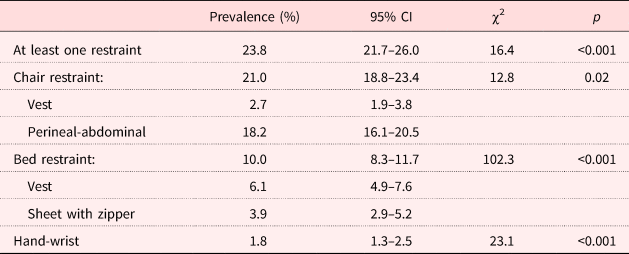
The prevalence of at least one physical restraint was 23.8% (95% CI = 21.7–26.0). The frequency of physical restraints according to their type is presented in Table 1, where it can be observed that perineal belts were the most prevalent type of restraint. The use of restraints was comparable across residences, as shown in Table 1. Additional information with prevalence data relative to age ranges is shown in Appendix 2.
Prevalence of physical restraints and nursing home comparison

Note: CI: confidence interval.
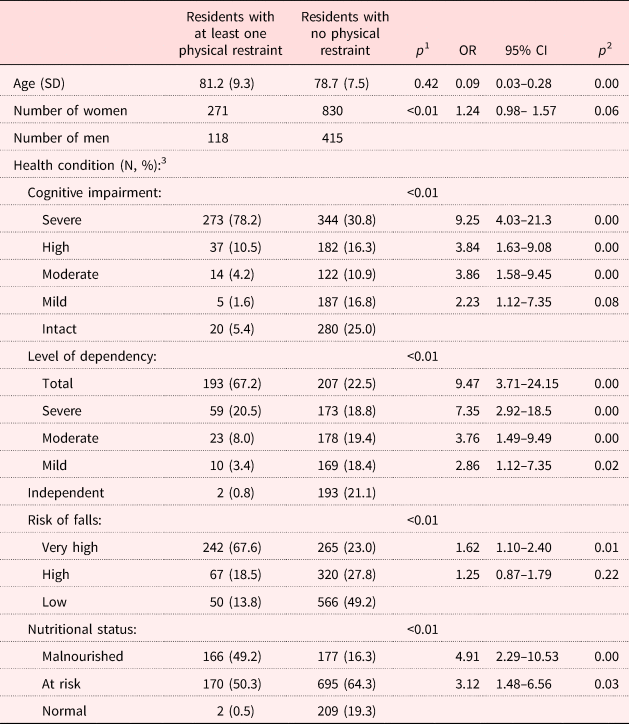
Regarding the association between the residents’ characteristics and the use of physical restraints, the logistic regression model found statistically significant differences between the groups for all the assessed variables with p < 0.001. The probability of using restraints increased with impairment. The highest probabilities were associated with a severe cognitive impairment and a level of dependence from severe to total. However, a low mobility associated with the risk of falling presented lower levels of probability, according to what is shown in Table 2.
Characteristics of the residents, and explanatory model on the use of physical restraints

Notes: 1. Significance levels resulting from chi-square test for categorical variables and Kruskal–Wallis for multiple comparisons. 2. Significance levels of logistic regression model. 3. Health condition based on 6,172 observations (100%), with a number of observations excluded from the model due to missing values for the nutritional status (13.1%), cognitive impairment (10.4%), level of dependency (26.2%) and risk of falls (7.6%). OR: odds ratio. CI: confidence interval. SD: standard deviation.
SOM results
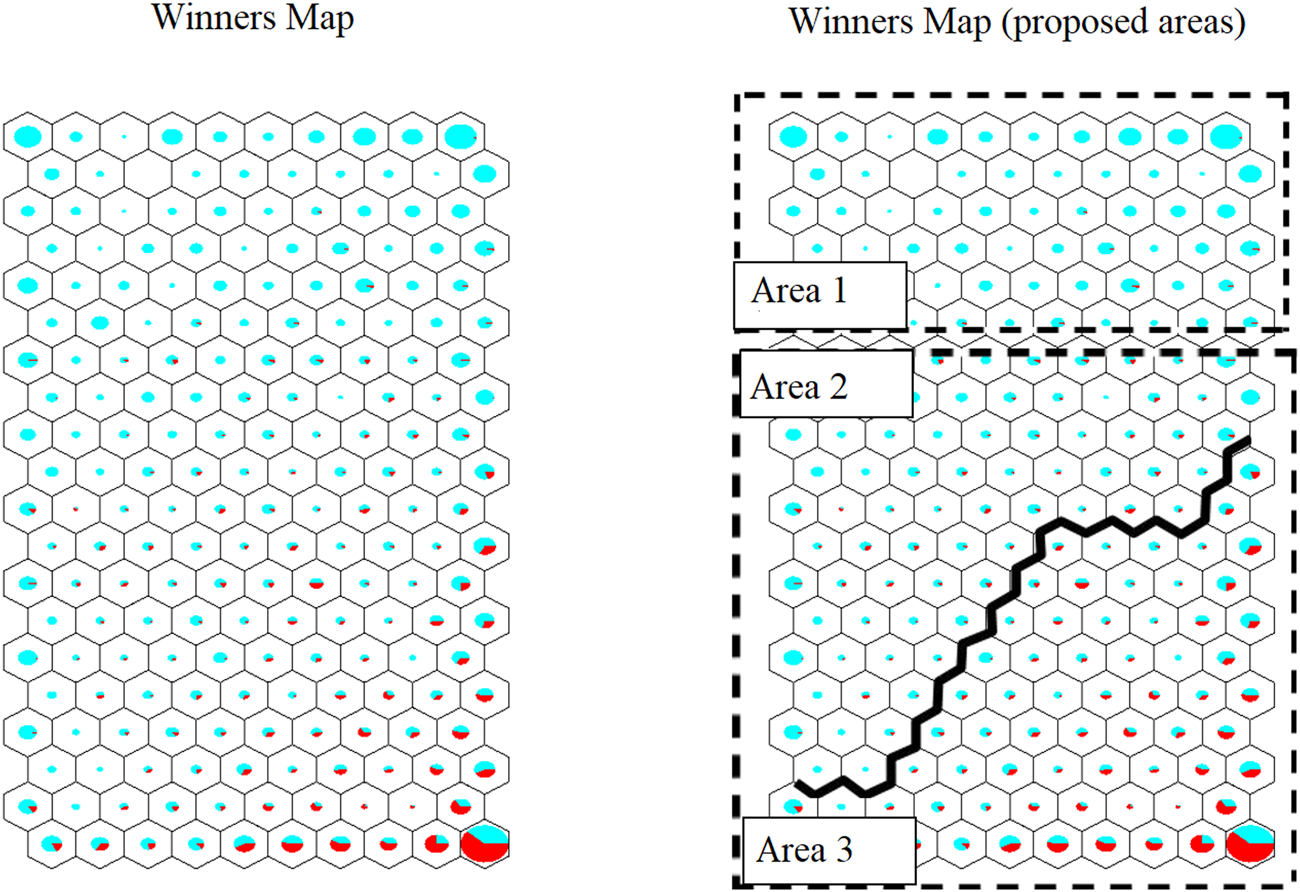
First, Figure 1 is analysed, which is the so-called ‘winners map’. This is a map divided into 10 × 20 hexagonal cells called neurons. Each cell includes a pie chart where restrained residents are represented in black (epub in red) and non-restrained residents in grey (epub in blue). The size of each chart is important, since a larger chart indicates a higher number of clustered residents within the specific cell.
The figure represents the distribution of residents within each hexagonal cell (neuron). The pie charts show restrained residents represented in black (epub in red) and the unrestrained residents in grey (epub in blue). A larger chart indicates larger numbers of residents within a neuron, while an empty neuron indicates no residents.

Once this has been clarified, the SOM analysis resulted in a zonal distribution where most of the restrained residents were placed at the bottom of the map. To a lesser extent, some restrained residents could be found in the central area. There were also restrained residents at the top of the map, but these were scarce. On the other hand, non-restrained residents were distributed all over the map, although more exclusively at the top of it.
According to this, this study divided the winners map shown in Figure 1 into three areas. Lower right, referred to as Area 3, is where most of the restrained residents are gathered. The centre of the map has been referred to as Area 2, where there are also restrained residents. However, this area included a combination of both restrained and non-restrained residents. Finally, Area 1 is located at the top of the map and was mainly occupied by residents who were not prescribed with physical restraints. The aforementioned areas have been defined arbitrarily and strictly lead to the visual interpretation of the results, not to statistical calculations.
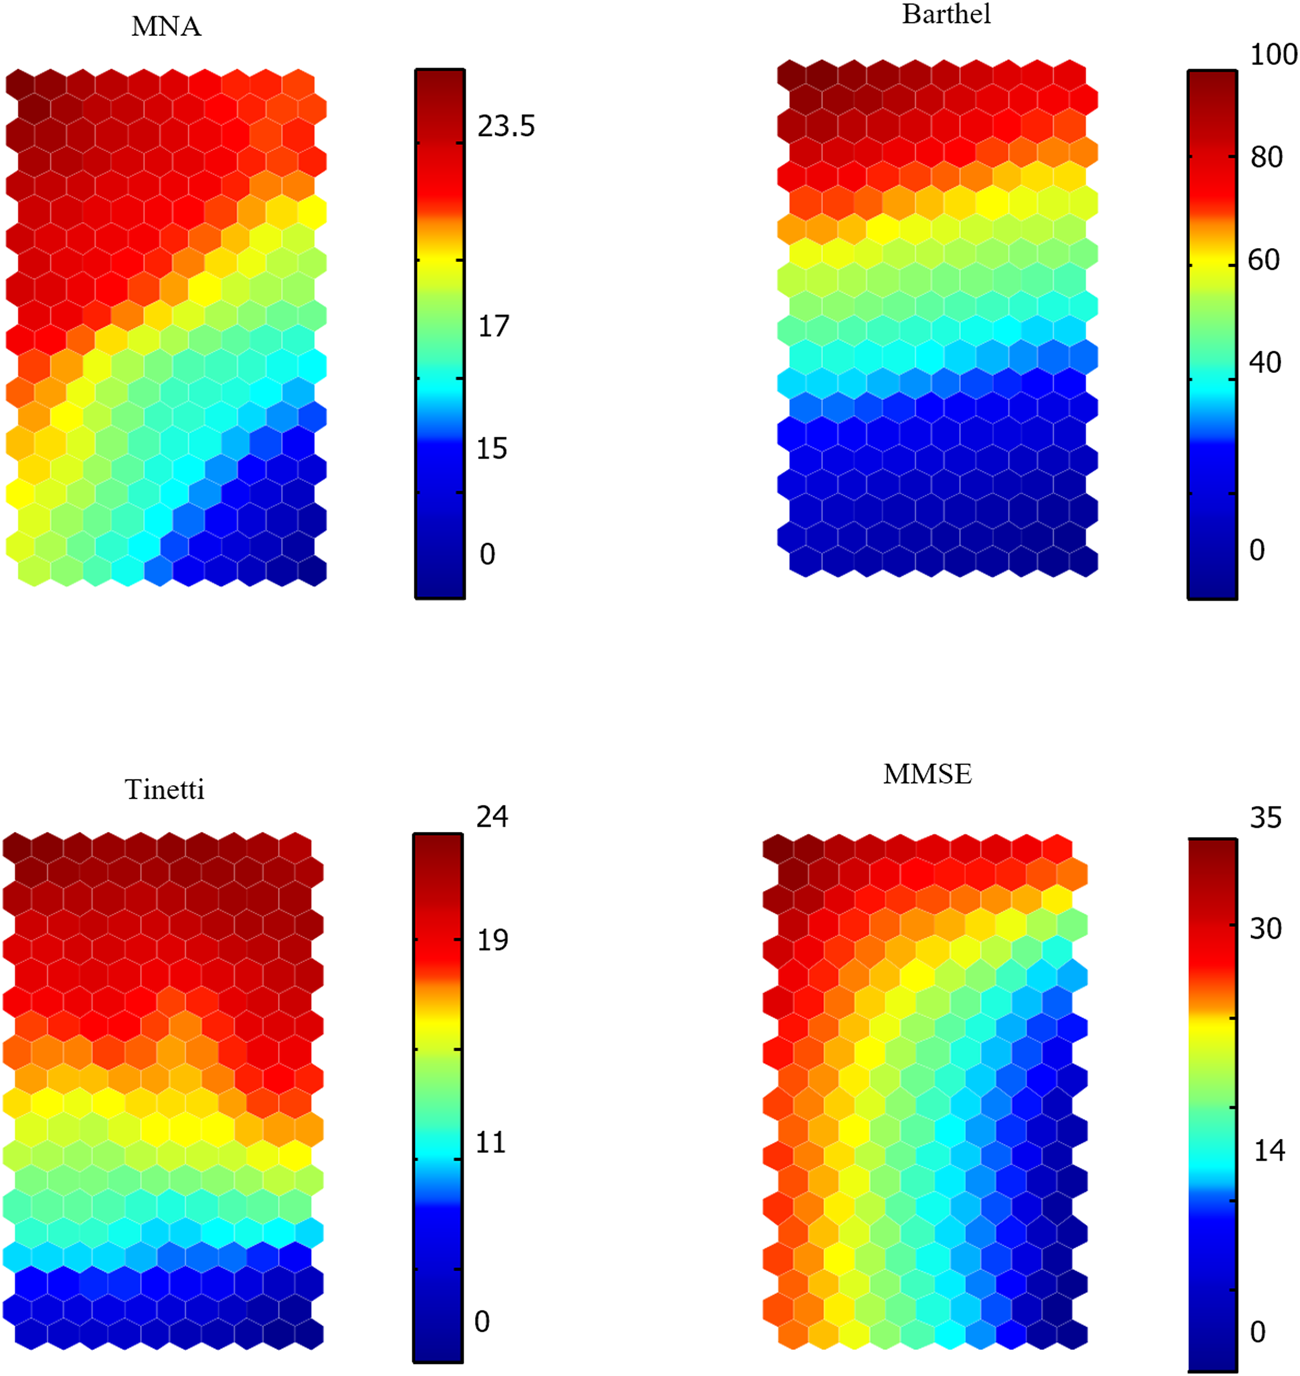
The map in Figure 1 is directly associated with the maps in Figure 2, where four maps can be observed, one for each measured rating system. The maps are the projections of the tests, and the dark zones of the upper side in each map are associated with higher scores. To interpret Figure 2, it should be remembered that every resident is always going to be located within the same hexagonal cell, regardless of the map (or variable projected on the map). Therefore, a cell includes those residents with the same or very similar characteristics, as measured with the proposed evaluations. Those residents who occupy nearby cells also share similar characteristics. By contrast, those residents with different characteristics are represented in more distant cells on the map.
The results of the multivariate analysis including the characteristics of residents in terms of the scores obtained in the rating systems collected: nutritional state (Mini-Nutritional Assessment (MNA)), level of dependency (Barthel Index), risk of fall (Tinetti Mobility Test) and cognitive status (Mini-Mental State Examination (MMSE)). The colour map from the base up indicates from the lowest to the highest score on each scale, with the approximate numeric values represented continuously.

According to this, projection scores for each variable suggested that residents located in Areas 2 and 3 had a risky nutritional status, considering that the values in these areas were below 17 points in the MNA. On the other hand, Area 1 corresponded with a good nutritional status.
The distribution was similar in the projection of the MMSE results, where the residents with levels of severe and total dementia were in Areas 2 and 3, while the levels of mild or intact cognitive impairment were placed predominantly in Area 1. It is necessary to emphasise that a small part of Area 3 (lower left) also included residents presenting mild cognitive impairment (>20). With regard to the assessment of the risk of falls and the ability to perform daily life activities, only residents located at the top of the map had a low risk of falling (>19) or low levels of dependency (>60). The remaining subjects located in Areas 2 and 3 presented a risk of falling ranging from high to very high, with levels of dependency that increased until reaching total dependence.
In summary, Area 3 gathered residents with the worst conditions in terms of the assessed rating systems. By contrast, residents in Area 1 presented the best conditions. The cognitive status presented greater variability and gave the visual impression of not having such a strong correlation with the rest of the variables. The linear correlation between the variables is additionally shown in Table 3.
Outcomes correlation matrix (bivariate)

Notes: MNA: Mini-Nutritional Assessment. MMSE: Mini-Mental State Examination. Tinetti: Tinetti Mobility Scale. CI: confidence interval.
Significance level: * p < 0.001.
Discussion
This work analysed the use of physical restraints in five nursing homes. Consistent with previous literature, the results suggested that the prevalence in Spain is still high when compared to other developed countries. The findings reinforced the knowledge suggesting that those residents presenting greater cognitive impairment and/or functional limitations are more prone to be restrained, at least in the assessed terms (Hofmann and Hahn, Reference Hofmann and Hahn2014; Estevez-Guerra et al., Reference Estevez-Guerra, Fariña-López, Núñez-González, Gandoy-Crego, Calvo-Francés and Capezuti2017). In addition, the SOM data processing analysed outcomes through non-linear procedures, suggesting three possible resident profiles that associated the use of restraint with the multiple interactions of their characteristics. Specifically, a first profile associated restrained residents with the lowest scores in the physical and cognitive evaluations used for the analysis in this research. A second profile suggested that non-restrained residents presented the higher scores in such measurements. Interestingly, a third profile showed that despite there being a number of residents presenting very similar physical and/or cognitive characteristics, these were not associated with the use of restraints. The findings are elaborated in the following sections, along with the clinical relevance, strengths and limitations of this research.
Prevalence of physical restraints
According to the international literature, the prevalence of physical restraints has been reported to be highly varied across countries (Meyer et al., Reference Meyer, Möhler and Köpke2009b; Huang et al., Reference Huang, Huang, Lin and Kuo2014; Hofmann et al., Reference Hofmann, Schorro, Haastert and Meyer2015), although the figures are always dependent on several factors. Indeed, there are different definitions of physical restraints, for instance, some research may suggest whether or not to include bedrails. In addition, facilities may present diverse characteristics and protocols for using restraints, while the use may not be homogenous among the countries due to differences in legislation, education and culture. Moreover, the design of research may involve different data collection approaches, including survey questionnaires, review of nursing and medical files, or direct observation (Gastmans and Milisen, Reference Gastmans and Milisen2005; Estevez-Guerra et al., Reference Estevez-Guerra, Fariña-López, Núñez-González, Gandoy-Crego, Calvo-Francés and Capezuti2017). Finally, previous research showed differences among the study populations, for instance, older persons with physical and cognitive problems were either included or not. The available data have so far revealed considerable differences between countries with regard to prevalence, but also to when, how, how often and how long patients are restrained (Lepping et al., Reference Lepping, Masood, Flammer and Noorthoorn2016).
In this context, Spain is considered a developed and aged country, with almost one-fifth of the population being over 65 years old. There are almost 400,000 long-term facilities, with the resident profile being predominantly women over the age of 80, which is consistent with the age range of this study population (Fernández-Muñoz, Reference Fernández-Muñoz2016). The facilities present different characteristics, being public, subsidised or privately owned. In this research, we collected data from subsidised nursing homes presenting similar characteristics and a unique protocol for using restraints, and that were, therefore, comparable among them. Indeed, there were no differences in the use of restraints when comparing the residences. When analysing previous research reporting the prevalence in Spain, these ranged between 18 and 36 per cent without considering bedrails, which is consistent with our findings (prevalence of 23.8%). According to the figures presented in the Introduction section, our research was consistent with previous studies and reinforced that the prevalence of restraints in nursing homes in Spain seems to be still higher than in other developed countries.
It is necessary to note that bedrails were not included in the analysis of this research, since their application does not require written consent in Spain and, therefore, the use of this system is not commonly registered. Indeed, the use of bedrails in Spain has been recently reported to be excessive, reaching up to 86 per cent of cases (Cabello et al., Reference Cabello, Trinidad, Cordero, Fernandez, Ruiz, Pecharroman and Ovejero2008; Estevez-Guerra et al., Reference Estevez-Guerra, Fariña-López, Núñez-González, Gandoy-Crego, Calvo-Francés and Capezuti2017). While some care-givers may consider bedrails just as a safety measure, these are actually a form of restraint, since they imply a limitation to mobility (Bleijlevens et al., Reference Bleijlevens, Wagner, Capezuti and Hamers2016). This fact brought to light that a clear definition of physical restraints is necessary, which should be available in every centre, along with the indications and usage specifications.
Use of restraints and resident characteristics
The scores in the individual tests categorised the residents according to the risk of falling, cognitive condition, level of dependence and nutritional status. The logistic regression model results were consistent with previous evidence, indicating that the odds of being restrained increases when the resident presents a more deteriorated condition in any of the individual variables.
In addition, the SOM multivariate analysis provided a broader view by associating the use of restraints with the multiple interactions of the mentioned residents’ characteristics. The results led us to suggest three possible resident profiles. The first profile (residents located in Area 3 of the map) coincided with that of a large number of restrained residents. Their condition was associated with a combination of several factors, including a very high risk of falling and of malnutrition, as well as of severe to total dependence. It was evidenced that a subject with a low score on one scale also had deficits in the others. The cognitive condition interacted in a similar way, despite presenting lower linear and non-linear correlations with the rest of the assessments (Mukaka, Reference Mukaka2012). A second profile (Area 1) presented the extreme opposite condition and, overall, this profile was not prescribed with the use of restraint. The findings on both profiles coincided with previous literature in showing that a more deteriorated physical and cognitive status is directly associated with a higher prevalence of physical restraints and vice versa (Hofmann and Hahn, Reference Hofmann and Hahn2014). As was introduced, reducing the risk of falls as well as dealing with behavioural disorders and dementia are, historically, the main factors that trigger the application of restraints. This involves a vicious circle or continuing unpleasant situation, since physical restraints limit mobility, which, in turn, may lead to a more deteriorated physical condition, and may consequently further increase the risk of falling. In the same line, in psychological terms, the use of restraints may increase anxiety and precipitate behavioural disorders.
The third and last profile (Area 2) presented the greatest controversy. Indeed, it was shown that the restrained residents had similar, or in some cases identical, characteristics to non-restrained residents when their physical and cognitive characteristics were assessed through the validated rating systems. Despite this fact, there was a criterion of unequal use of physical restraint for a number of residents. Importantly, this not only occurred regarding residents located in this area: although the number was scarce, there were residents located in Area 1 under the same situation, in which restrained residents presented the highest scores in all tests.
Interpreting results of visual analysis
In view of the proposed profiles, the visual analysis revealed how the use of restraint was not always associated with objective information and the validated assessments. This fact may be due to several reasons. We speculate that one of them is the attitude and feelings of care-givers towards the use of restraints, a factor that has been extensively studied in previous literature (Goethals et al., Reference Goethals, Dierckx de Casterlé and Gastmans2012). For instance, it is known that avoiding falls is the main motivation for applying physical restraints (Fariña-López et al., Reference Fariña-López, Estévez-Guerra, Nuñez-González, Pérez-Hernández and Gandoy-Crego2013). Indeed, our results coincided with this criterion, this being the main motivating factor for applying restraints. However, the visual analysis showed that many patients with low scores in the Tinetti Mobility Test, and therefore at high risk of falling, were not using restraints. Moreover, it was found that a number of residents that additionally presented severe functional disability and/or deteriorated cognitive conditions were likewise not using restraints. This finding, added to the already evidenced fact that restraints do not necessarily prevent falls, with little difference in falls rates between restrained and non-restrained populations (Capezuti et al., Reference Capezuti, Talerico, Strumpf and Evans1998; Fonad et al., Reference Fonad, Wahlin, Winblad, Emami and Sandmark2008), and considering that restraints may even further impair balance as well as increase agitation of residents, deduced the need to minimise the subjective factor that seems to play a relevant role in decision-making (Eskandari et al., Reference Eskandari, Abdullah and Wong2017).
From an ethical perspective, health-care professionals face challenges, since the main issue in decision-making reflects the conflict between ensuring the residents’ safety, doing good, respecting autonomy and avoiding paternalism (McBrien, Reference McBrien2007). Decision-making is characterised by being a process of ethical deliberation where different values and norms are identified, and where the process of balancing these values constitutes the essence of the process. As a result, decision-making can be experienced as difficult, even as a dilemma (Goethals et al., Reference Goethals, Dierckx de Casterlé and Gastmans2013). Yet, objective evaluations provide information on the individual that might help decision-making, and this type of assessment should be at least considered. On this line, the lack of training on the management of behavioural and psychological disorders could have had an important influence on the findings; and, of course, to this we must add that effective regulations would be decisive in assisting in decision-making.
Clinical importance
The impact on clinical practice suggests a continuous assessment of risk factors. It also leads to determining the actual need for the use of restraints from an individual perspective, by basing the criteria on objective, consistent, reproducible and reliable methods. Strategies for training and gaining awareness of care-givers are necessary, especially to minimise the subjective factor which appears to influence decision-making directly. These aspects should preferably be framed within effective legislation to ensure the quality of care given to residents in Spanish nursing homes, as well as in other countries with similar deficiencies. In addition, the absence of effective national legislation regulating the use of restraints is a key issue to be considered (Fariña-López et al., Reference Fariña-López, Estévez-Guerra, Nuñez-González, Pérez-Hernández and Gandoy-Crego2013, Reference Fariña-López, Estevez-Guerra, Gandoy-Crego, Polo-Luque, Gómez-Cantorna and Capezuti2014; Estevez-Guerra et al., Reference Estevez-Guerra, Fariña-López, Núñez-González, Gandoy-Crego, Calvo-Francés and Capezuti2017).
Strengths and limitations
Among the strengths, we emphasise the SOM data-processing contribution as the main innovation of this work. In addition to what can be found in previous literature –describing residents’ characteristics and establishing the odds of using restraints based on independent risk factors – we analysed the multiple interactions of the residents’ characteristics and their association with the use of restraints.
The relevance of this research is reinforced by the great variability reported in terms of prevalence and associated factors in Spain, as well as in other developed countries, along with the low number of comprehensive studies at the national level. The size of the included sample is also a strength of this study. Also, the inclusion criteria were broad, which provided a representative view of the analysed centres.
Yet, certain limitations need to be recognised. Retrospective designs based on clinical records could involve greater limitations than prospective designs, with possible biases related to risk factors, impact of events or other measures. However, the loss of observations was reported, and possible measures were taken in order to reduce the impact on the results and preserve the rigour of the data. The entire data-set was systematically checked by the biometrician in charge of this research. The data were strictly collected in five nursing homes of the Valencian Community, but results would probably be comparable throughout Spain, given the similar characteristics of public and subsidised institutions. Failure to consider the residents’ clinical condition as a criterion may have influenced the results, but we consider that this has provided a more representative view. Finally, bedrails were not included in the analysis, which would have substantially increased the prevalence (Huang et al., Reference Huang, Huang, Lin and Kuo2014; Estevez-Guerra et al., Reference Estevez-Guerra, Fariña-López, Núñez-González, Gandoy-Crego, Calvo-Francés and Capezuti2017).
Conclusion
Cognitive and physical conditions are directly associated with the use of restraints. However, this principle is not always fulfilled. Initiatives to minimise the subjective factor should be promoted, since it seems to play a relevant role in the administration of physical restraints. Likewise, a clear definition of physical restraints needs to be present at each centre, along with effective legislation that clarifies the needs, alternatives and motivations for the use of restraints. This study has offered a critical discussion of the findings, description of the potential clinical impact and contextualisation within contemporary literature, hoping that the research results will help in the promotion and development of initiatives that will improve the quality of care in nursing homes for older adults.
Author ORCIDs
Juan Gómez-Salgado, 0000-0001-9053-7730.
Author contributions
All authors have made substantial contributions to all of the following: (a) the conception and design of the study, or acquisition of data, or analysis and interpretation of data, (b) drafting the article or revising it critically for important intellectual content, and (c) final approval of the version to be submitted.
Financial support
This research received no specific grant from any funding agency, commercial or not-for-profit sectors.
Conflict of interest
The authors declare no conflicts of interest.
Ethical standards
The study was carried out in accordance with the international standards agreed in the International Guidelines for the Ethical Review of Epidemiological Studies and the recommendations of the Spanish Society of Epidemiology on the revision of the ethical aspects of epidemiological research. The study was approved by the Ethics Committee of the General Directorate of the Public Health-Centre for Research in Public Health of Valencia (approval number 2013/06/13).
Appendix 1. Description of self-organised maps
Self-organised maps are generally used to classify and extract relationships between the different variables that are related to a specific problem. Therefore, the objective was to cluster those residents with similar characteristics in terms of their physical and cognitive conditions, and to assess if these were somehow related to the use of physical restraints.
We conducted a non-supervised training. The analysis generated a spatial distribution of the residents in a two-dimensional map formed by neurons. The size of the network or map was (20 × 10) and each neuron was hexagonal with six neighbouring neurons. When running the analysis, the training begins and, after several data interactions, residents were assigned to a neuron which had a weight vector that changed during the competitive process. The procedure for placing a data vector on the map is to find the node with the closest weight vector, for instance, by having the smallest metric distance to the data space vector. Based on these distances, residents with equal characteristics were placed in the same neuron within the map; those with common characteristics were grouped in the same area and consequently separated from those that were not similar.
The vectors were normalised at the beginning with values between 0 and 1 so that the scale ranges did not affect the training. Then, the multivariate analysis (several dimensions) was represented by projecting it on a single variable (one dimension). This produced a discrete representation of the space of the input sample. In other words, the representation produced different maps, as many variables were introduced in the analysis (the four outcomes of this study).
Therefore, each variable has been projected on the spatial distribution of residents on the map previously generated. It should be noted that the zonal distribution of residents is always the same for a given solution, that is, the residents are always in the same position in every map and within a specific neuron, regardless of the projected variable. What differentiates each map is the projection of each study variable over the zonal distribution of residents.
Thus, by observing the same area in different maps, it is possible to see how a cluster of residents is related to a specific score in each scale, obtaining the common characteristics of each sub-group in a visual and intuitive way and, in this case, correlating the cognitive and physical condition of the resident with the use of restraints.
Appendix 2. Frequency of physical restraints by age