Implications
Early indicators of carcass quality are of paramount importance in an efficient beef cattle breeding programme. This study showed that routinely available measures of performance around weaning age such as auction price and weanling quality scored by farmers could have the potential of being useful early predictors of genetic merit for carcass cut weights.
Introduction
The main source of revenue for beef farmers, either directly or indirectly, is carcass value. In Europe, carcass price is traditionally derived from the EUROP grading for conformation and fat (European Council regulations 1208/81 and 2930/81) obtained from human assessment or mechanical grading machines. Using Irish data, Pabiou et al. (Reference Pabiou, Fikse, Cromie, Keane, Näsholm and Berry2011a) defined four groups of wholesale cut weights based on retail value: lower value cuts (LVC), medium value cuts (MVC), high value cuts (HVC) and very high value cuts (VHVC), as well as three groups of overall cut weights: total meat weight, total fat weight and total bone weight. Pabiou et al. (Reference Pabiou, Fikse, Cromie, Keane, Näsholm and Berry2011a) then showed that these four wholesale carcass cut weights can be accurately predicted from carcass images generated at slaughter by the mechanical grading machines used to predict the EUROP scores for conformation and fat. Pabiou et al. (Reference Pabiou, Fikse, Amer, Cromie, Näsholm and and Berry2011b) proceeded to show that significant genetic variation in these predicted wholesale carcass cuts at constant carcass weight existed implying the genetic selection for such traits is possible.
Phenotypic information on digital images, and therefore predicted wholesale carcass cut yields, are, however, only available at slaughter in Ireland at ∼24 (heifers) to 28 (steers) months of age (Pabiou et al., Reference Pabiou, Fikse, Cromie, Keane, Näsholm and Berry2011a). This has implications for the accuracy of selection of potential parents for subsequent generations. Indirect genetic selection using readily accessible phenotypes, measured early in life and genetically correlated with the goal trait (i.e. wholesale carcass cuts), may be used to increase the accuracy of selection at a younger age, and therefore increase annual genetic gain. Phenotypes routinely collected in Ireland that could possibly be used as early genetic predictors of wholesale carcass cut yields include individual animal auction price, live weight and visual assessment of live animals at weaning and post weaning.
The objective of this study was, therefore, to quantify the genetic associations between wholesale cut weights predicted from video image analysis (VIA) and a range of performance traits currently being recorded on cattle in Ireland. Results from this study will be useful in quantifying the accuracy of selection for wholesale carcass cuts achievable using a multi-trait selection index including readily available traits measured early in life.
Material and methods
The data originated from four sources: (1) predicted carcass cut weights and carcass value collected from abattoirs (2) animal price data collected from livestock auctions (3) live-weight and linear-type traits collected from commercial and pedigree farms as well as from livestock auctions (live weight only) and (4) weanling quality scores subjectively assessed by commercial and pedigree farmers. The data consisted of routinely collected records of crossbred animals; the main breed proportions represented in ten crossbred animals were Charolais, Friesian, Holstein, Limousin, Angus, Simmental, Hereford and Belgian Blue.
Predicted carcass cut weights and carcass value
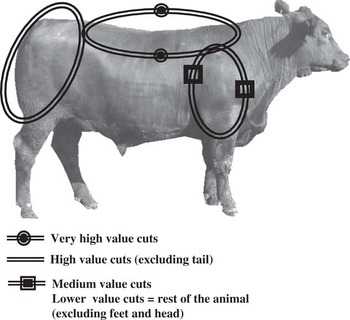
Prediction methods used to predict carcass cut weights from video image analysis have been previously described in detail by Pabiou et al. (Reference Pabiou, Fikse, Cromie, Keane, Näsholm and Berry2011a). Predicted carcass cut weights were available on steers and heifers and consisted of (i) predicted wholesale cut weights based on their respective market value: LVC, MVC, HVC and VHVC and (ii) predicted overall cut weights: total meat weight, total fat weight and total bone weight. Predicted wholesale cut weights were calculated for both steers and heifers, whereas total fat and bone weights were only calculated in steers (Pabiou et al., Reference Pabiou, Fikse, Cromie, Keane, Näsholm and Berry2011a). Figure 1 shows the location of LVC, MVC, HVC and VHVC on a live animal. Accuracy of prediction (R 2) for LVC, MVC, HVC and VHVC was 0.92, 0.86, 0.93 and 0.84, respectively, in steers, and 0.65, 0.70, 0.85 and 0.72, respectively, in heifers (Pabiou et al., Reference Pabiou, Fikse, Cromie, Keane, Näsholm and Berry2011a).
Location of the carcass cut weights on a live animal.

Predicted carcass cut weights from 568 831 steers and 356 216 heifers slaughtered between 2005 and 2010 from 22 Irish abattoirs were available. Animals slaughtered before 300 days of age (i.e. 10 months), as well as steers and heifers slaughtered older than 1800 days (i.e. 60 months) and 1087 days (i.e. 36 months) of age, respectively, were discarded. Animals without a recorded sire or from an unknown herd were also discarded.
In Ireland, payment for carcasses is based on carcass weight and gender, adjusted, within factory, for EUROP conformation and fat grade. Carcass value (€ per animal) was available for all carcasses, and to account for potential large variations in market trends across time, carcass values were standardised to a common residual variance within contemporary group as described by McHugh et al. (Reference McHugh, Evans, Amer, Fahey and Berry2011) for animal price.
Herd-year-season of slaughter contemporary groups were defined, within sex, using the iterative algorithm of Crump et al. (Reference Crump, Wray, Thompson and Simm1997). The algorithm is based on grouping animals together, within herd, that are slaughtered in close proximity of time. Initially, records taken within 60 days were joined together. Subsequently, if the number of records within a contemporary group was less than five, they were merged with a contemporary group adjacent in time if the start date of this group and the end date of the adjacent group were <120 days apart.
Carcass value records contemporary groups with no variation in carcass value were set to missing. This edit was applied to discard data where a flat price for a group of cattle was negotiated between the individual farmer and the abattoir. The edited dataset comprises 110 308 predicted carcass cut weight records (79 744 steers and 30 564 heifers), as well as 106 612 records with carcass value records (79 075 steers and 25 537 heifers; Table 1).
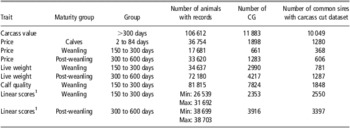
The different pre-slaughter datasets to be merged with the carcass cut weight dataset (n = 110 308 records): number of records, CG size, number of sires in common with the carcass cut dataset

CG = contemporary groups.
1Includes seven different traits.
Animal market price
A total of 4 207 051 animal market price records (overall animal price rather than price per kg) from 3 552 089 animals sold at 74 livestock auctions in Ireland between the years 2000 and 2010, were extracted from the Irish Cattle Breeding Federation (ICBF) database. Livestock auction venues are present across Ireland and are the locations where most cattle are purchased.
The data were divided into three distinct maturity categories as described in detail by McHugh et al. (Reference McHugh, Fahey, Evans and Berry2010): calves, weanlings and post-weanlings. The edits implemented were those described by McHugh et al. (Reference McHugh, Fahey, Evans and Berry2010). Calves were defined as animals born from dairy cows (i.e. dam breed proportion >66% dairy) sold between 2 days of age and 12 weeks of age. No live-weight information was available on these animals and only calves sold between €2 and €450 were included. Weanlings were defined as animals sold between 150 and 300 days of age as beef animals (i.e. dam breed proportion >66% beef). Weanling auction data were limited to animals weighing between 150 and 600 kg and sold for between €200 and €1200. Post-weanlings were also defined as beef animals sold between 301 and 600 days of age. Post-weanlings auction data were limited to animals weighing between 200 and 1000 kg and sold for between €200 and €1500.
Irrespective of maturity category, animals were discarded if price per animal (euro, €), herd of origin or sire were unknown. When age of dam at calving was <18 months, the data were discarded; similarly, within parity, when age of dam at calving was >22 months from the median age, the data were also discarded. Only price data from animals sold individually at auctions were considered, and for animals sold through livestock auctions more than once in their lifetime, only the first recorded date in time was kept. Animals included also had to have at least 66% of the breed composition known. In order to account for potential large variation in market trends across time, auction prices were standardised to a common residual variance within contemporary group as described by McHugh et al. (Reference McHugh, Evans, Amer, Fahey and Berry2011).
In order to account for differences in rearing/finishing practices on-farm as well as day and location of sale effects, two distinct contemporary groups were defined in each of the three maturity groups: (i) herd-year-season of auction sale and (ii) auction-date of sale. Herd-year-season of auction sale contemporary groups were defined using the iterative algorithm of Crump et al. (Reference Crump, Wray, Thompson and Simm1997), parameterised by the minimum and maximum span of a group for auction sale date of 10 and 182 days, respectively, as well as a minimum number of five records per group. Only animals from contemporary groups (i.e. herd-year-season and auction-date) with at least five animals were considered for further analysis. Following all edits, the calf dataset contained 36 754 calves with price distributed across 1898 auction date-of-sale contemporary groups (Table 1). The weanling and post-weanling datasets included 17 681 and 33 620 animals with price, respectively, and included 661 and 1283 auction date-of-sale contemporary groups, respectively (Table 1).
Live weight
A total of 1 360 900 live-weight records from 1 244 869 animals, aged between 150 and 600 days of age, from 81 400 herds, between the years 2000 and 2010, were available. Live weights were collected from livestock auctions as well as from commercial and pedigree farms. On average over the 2000 to 2010 time period, live weight from auctions represented more than 85% of the total live weights collected.
The dataset was divided into weanling and post-weanling records as no live-weight data were available on calves. Across both data sources, animals were discarded if herd of origin or sire were unknown. When age of dam at calving was <18 months, the data were discarded; similarly, within parity, when age of dam at calving was >22 months from the median age, the data were also discarded. Since some animals can be weighed more than once within maturity group, only the first recorded date in time was considered. Weanlings were defined as progeny of beef cows (i.e. dam breed proportion >66% beef) aged between 150 and 300 days of age and weighing between 150 and 600 kg. Post-weanlings between 301 and 600 days of age and weighing between 200 and 1000 kg and were from both dairy and beef cows.
Contemporary groups data were defined as herd-year-season of weighing and were generated using the Crump et al. (Reference Crump, Wray, Thompson and Simm1997) algorithm, parameterised by the minimum and maximum span of a group for weighing date of 10 and 182 days, respectively, as well as a minimum of five records per group. Following all edits, 34 637 weanlings with live-weight records across 2990 contemporary groups and 72 180 post-weanlings with live-weight records across 4217 contemporary groups were available for subsequent analysis (Table 1).
Weanling quality
As part of a national scheme (state aid N 140/2007), weanling quality was to be subjectively scored on a scale of 1 (poor) to 5 (excellent) by beef farmers to describe the overall quality of their weanling animals. In 2007, the state aid N 140/2007-Ireland ‘Animal Welfare, Recording, and Breeding Scheme for Suckler Herds’ from the European Commission approved the technical and financial framework for the scheme in Ireland to operate from the years 2008 to 2012.
In this study, 1 710 263 weanling quality scores were available from 43 869 commercial farms across Ireland between the years 2008 and 2010. Weanlings visually scored outside the age of 150 to 300 days were excluded from the analysis (n = 351 799). Animals without a known sire (n = 69 311) as well as animals with <66% of their breed composition known (n = 774 845) were discarded from the analysis.
Contemporary groups were defined as herd-date of scoring using the Crump et al. (Reference Crump, Wray, Thompson and Simm1997) algorithm, parameterised by the minimum and maximum span of a group for scoring date of 10 and 182 days, respectively, as well as a minimum of five records per group. Contemporary groups containing less than five animals (n = 328 866) and contemporary groups with no variation in weanling quality scores (n = 103 627) were discarded from further analysis. Following all edits, 81 815 animals with weanling quality scoring from 7824 contemporary groups were included in the analysis (Table 1).
Linear-type traits
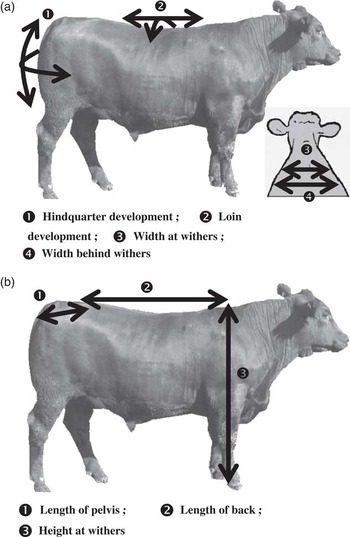
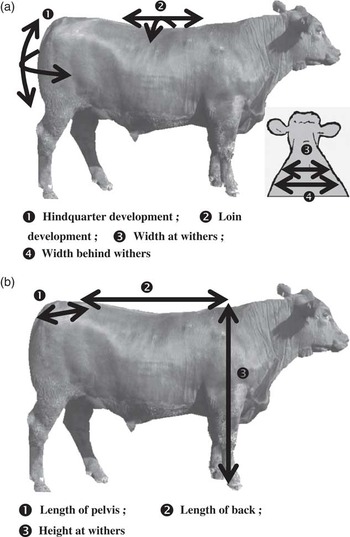
Linear scoring is a visual assessment of an animal's morphology and is routinely undertaken in Ireland by 32 independent linear scorers on both commercial and pedigree beef herds. Seven different traits are currently used in the Irish beef genetic evaluation, and include the muscularity traits (Figure 2a) of loin development, hindquarter development, width at withers and width behind withers, as well as the skeletal traits (Figure 2b) of length of back, length of pelvis and height at withers. Linear score data were available on 180 320 beef animals, aged between 150 and 1087 days in 8082 herds between the years 2000 and 2010. Each linear trait was standardised within scorer by year to a common variance within trait. Information on all seven traits was not available on all animals.
(a) Location of the muscle linear traits on a live animal. (b) Location of the skeletal linear traits on a live animal.
Animals were discarded if herd of scoring or sire were unknown. Animals were split into two groups according to age at scoring: weanling scored between 150 and 300 days of age and post-weanling scored between 301 and 600 days of age. Within each maturity group, herd-year-season of scoring contemporary groups were generated using the Crump et al. (Reference Crump, Wray, Thompson and Simm1997) algorithm (parameterised by the minimum (10 days) and maximum (182 days) span of a group for date, and the minimum number of records (n = 5) per group) and only contemporary groups with at least five records were considered. Following all edits, up to 31 692 and 38 703 animals with linear scores were available for further analysis in the weanling and post-weanling maturity group, respectively (Table 1).
Statistical analyses
Phenotypic and genetic variance components were estimated separately for all traits using animal linear mixed models in DMU (Madsen and Jensen, Reference Madsen and Jensen2007). The univariate model can be described as

where Y is a vector of performances, b is a matrix of fixed effects, a is a vector of random genetic animal effects and e if a vector of residuals; X and Z are the associated incidence matrices. Where live weight at weaning was the dependent variable, a random maternal genetic component (i.e. dam of animal) was also included in the model. The univariate model with maternal effect was therefore

where Y is a vector of performances, b is a matrix of fixed effects, a is a vector of random genetic animal effects, m is a vector of dam of animal genetic effect and e is a vector of residuals; X, Z and M are the associated incidence matrices. When no maternal genetic component was included in the model, the direct heritability was represented by the ratio of the animal variance to the sum of the animal and residual variance. When the model contained a maternal genetic component the direct (h 2 d) and maternal (h 2 m) heritabilities were computed as

where  = direct genetic variance;
 = maternal genetic variance; σ
dm = covariance between direct and maternal traits;
 = residual variance.
Genetic correlations between carcass cut weights and each of the associated traits (i.e. carcass value, auction price, live weight, weanling quality score and linear scores) were estimated using a series of bivariate sire linear mixed models (DMU; Madsen and Jensen, Reference Madsen and Jensen2007) accounting for all relationships among sires. Genetic correlations between carcass value and auction prices, as well as between weanling quality and linear scores were also estimated. The model description was similar to model [1] but expanded to be multi-trait: vector a was replaced by matrix s of sire genetic effects, and genetic and residual (co)variance matrices between the traits were estimated. When live weight at weaning was one of the dependent variables, the model also included a random maternal genetic component (i.e. maternal grand-sire of animal) for this trait.
Fixed class effects included in all models were sex of the animal (male or female), age of the dam when the animal was born (<3 years, 3 to 5 years, 6 to 8 years and >8 years), birth type (i.e. whether the animal was born singleton or from a multiple birth), as well as the contemporary groups defined specifically for each trait in the analysis.
Covariates tested and included in all models included heterosis and recombination loss which were calculated as  and
 , respectively, where sirei
and dami
were the proportion of breed i in the sire and dam, respectively. In addition, age at trait measurement was included in all models as a covariate. When the dependent variable was carcass value, LVC, MVC, HVC, VHVC, total meat weight, total fat weight or total bone weight, then carcass weight was also included in the model as a covariate. When the dependent variable was either weanling or post-weanling auction price, a covariate for live weight at the time of sale was also included in the model.
Pedigree of animals (univariate models) and sires (bivariate models) was extracted from the ICBF database, and back-pedigrees were traced back at least four generations of ancestors, where available. Relationships among animals or sires were accounted for using a relationship matrix where unknown ancestors were included as phantom groups of the following breeds: Charolais, Friesian, Holstein, Limousin, Angus, Simmental, Hereford, Belgian Blue, French hardy breeds (Salers and Aubrac), other beef breeds (Piemontese, Parthenaise, Blonde d'Aquitaine and Shorthorn) and unknown breed in both the steers and heifer pedigree files.
Results
Summary statistics
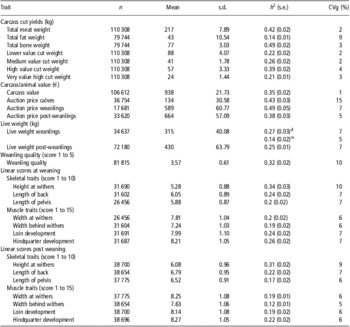
The measured carcass weight reported at slaughter was 349 kg for steers and 296 kg for heifers; the average predicted carcass weight for steers (i.e. sum of the averages predicted total fat weight, predicted total bone weight and predicted wholesale cut weight) was 337 kg (Table 2). Average auction price increased consistently with age from €134 in calves to €589 and €664 in weanlings and post-weanlings, respectively; average carcass value was €938. The coefficient of genetic variation for calf auction price (15%) was three times larger than the coefficient of genetic variation for weanling and post-weanling auction price. Average live weight at weaning and post weaning was 315 and 430 kg, respectively.
Presentation of the data: number of records (n), mean, phenotypic standard deviation (s.d.), heritability (h 2), standard error of heritability (s.e.) and CVg for carcass cut weights, carcass and animal value, live weight, weanling quality and linear scores at weaning and post weaning

CVg = coefficient of genetic variation.
Heritability
Heritability of the individual wholesale cut weights varied from 0.21 (VHVC) to 0.39 (HVC; Table 2). Heritability of auction price increased from 0.43 in calves to 0.49 in weanlings, then decreased to 0.38 in post-weanlings. Heritability of live weight (direct effect) was similar in both weanlings (0.27) and post-weanlings (0.25). The estimated heritability of weanling quality measured subjectively by individual farmers without any specific training was 0.32. Heritability of linear scored traits were similar across the two maturity groups and varied from 0.12 to 0.34.
Genetic correlations
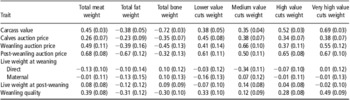
Strong positive genetic correlations existed between HVC, VHVC and carcass value, while negative correlations existed between carcass value and both carcass fat and bone weight (Table 3). Genetic correlations between carcass cut weights and auction price collected on live animals increased in magnitude from calves (0.34 ⩽ r g ⩽ 0.45), to weanlings (0.37 ⩽ r g ⩽ 0.66), to post-weanling (0.50 ⩽ r g ⩽ 0.67). Strong positive genetic correlations were also observed between carcass value and calves auction prices (0.48), weanling auction prices (0.79) and post-weanling auction prices (0.52).
Genetic correlations (standard errors in brackets) between carcass cut weights (kg – at constant carcass weight) and carcass value (€ – at constant live weight), auction prices for calves (€), weanlings (€ – at constant live weight) and post-weanlings (€ – at constant live weight), live weight (kg) and weanling quality (score 1 to 5)

In both weanlings and post-weanlings, genetic correlations between the live-weight and the carcass traits (overall and wholesale cut weights) were close to zero (Table 4). Genetic correlations between maternal weaning weight and carcass cuts were also close to zero.
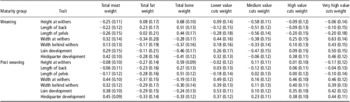
Genetic correlations (standard errors in brackets) between carcass cut weights (kg – at constant carcass weight) and linear traits recorded at weaning and post-weaning age (scores 1 to 10/15)

Weanling quality, as scored by farmers, was positively correlated with total meat weight and the wholesale cut weights (0.12 ⩽ r g ⩽ 0.49), and negatively correlated with total fat weight and total bone weight (Table 4).
Irrespective of age at scoring, skeletal linear traits (i.e. height at withers, length of back and length of pelvis) were positively correlated with total bone weight (0.27 ⩽ r g ⩽ 0.68). Total meat weight, LVC, MVC, HVC, and VHVC were positively correlated with muscle linear traits (width at withers, width behind withers, loin development and hindquarter development), with the exception of MVC in weanlings.
Strong positive genetic correlations existed between weanling quality and muscle linear scores: width at withers (0.76), width behind withers (0.73), loin development (0.74) and hindquarter development (0.68). Genetic correlations between weanling quality and length of pelvis, length of back and height at withers were 0.29, 0.60 and 0.41, respectively.
Discussion
The potential use of VIA in a national breeding programme, primarily due to the existence of genetic variation in predicted carcass cut weights, was proposed by Pabiou et al. (Reference Pabiou, Fikse, Cromie, Keane, Näsholm and Berry2011a). However, because it is necessary to wait until the animal is slaughtered, accurate estimates of genetic merit for carcass cut weights are not available early in the lifetime of potential parents. Therefore, the motivation for this study was to quantify the strength of genetic associations between routinely available measures of performance in Irish cattle and predicted carcass cut weights.
General statistics and variance components
The heritability estimates in this study were similar to those reported by Pabiou et al. (Reference Pabiou, Fikse, Amer, Cromie, Näsholm and and Berry2011b) in a smaller population sample of Irish steers and heifers. The heritability estimates for animal price were greater than those reported by McHugh et al. (Reference McHugh, Evans, Amer, Fahey and Berry2011) in a smaller dataset of Irish cattle, attributable to the greater genetic variance estimated in this study. Heritability estimates for live weight at weaning and post weaning estimated in this study were consistent with those documented by McHugh et al. (Reference McHugh, Evans, Amer, Fahey and Berry2011). Heritabilities for linear scores at weaning and post weaning were also consistent with McHugh et al. (Reference McHugh, Evans, Amer, Fahey and Berry2011).
The heritability of weanling quality score (0.32) and its coefficient of genetic variation was similar than the respective measures of the individual linear scores, assessed by experienced and trained classifiers. Despite the lack of any formal training of farmers on scoring this trait, it is obvious that perception of quality at weaning age is relatively consistent across farmers.
Genetic correlations
The majority of the correlations estimated in this study are in line with expectations. The moderate-to-strong positive genetic correlations between carcass value and both VHVC and HVC, and the fact that these were stronger than with LVC and MVC agrees with the objective of the current beef EUROP carcass classification (Council Regulation (EEC) No. 1208/81 of 28 April 1981) for conformation to describe ‘the development of carcasses profiles, in particular the essential parts (round, back, shoulder)’. Pabiou et al. (Reference Pabiou, Fikse, Amer, Cromie, Näsholm and and Berry2011b) also observed positive genetic correlations between predicted wholesale cut weights and EUROP grading for conformation ranging from 0.44 (LVC) to 0.84 (VHVC). This was also reflected in the positive correlation between carcass value and total meat weight but a strong negative correlation between carcass value and bone weight, the latter reflecting the contribution of bone weight to differences in carcass kill out.
As expected, prices paid for cattle at livestock auctions are good predictors of future carcass quality as evidenced by the positive genetic correlations between auction price with total meat weight and carcass cut weights, especially HVC and VHVC. The genetic correlation between auction price in weanlings and carcass value (0.79) indicates that purchasers’ preference at livestock auction is mainly based on potential carcass return. Post weaning, a slight weakening of the genetic correlations between auction price and carcass value (0.52) compared with their respective genetic correlations at weaning was observed. This indicates that purchasers’ preference at auction is still based on potential carcass return, but could be more influenced by other factors like purchasing replacement cattle. The majority of calves are sold at livestock auctions before compulsory health testing at 42 days of age (McHugh et al., Reference McHugh, Fahey, Evans and Berry2010). Nonetheless, calf price, although limited to progeny from dairy cows and thus influencing primarily the estimated breeding values of sires (or their relatives) used on dairy cows is nonetheless a very useful early predictor trait of carcass cut yields especially since these data are available at no additional cost. Weanlings from beef cows are on average sold at 8 months of age and therefore also provide a useful, albeit slightly later in life, genetic predictor of carcass quality with no additional cost of collecting the data.
Not all animals, however, are sold during their lifetime or even sold through the livestock auctions. Weanling quality, on the other hand, can potentially be scored by all commercial and pedigree farmers on all weanlings and its high heritability, coupled with its ample genetic variation and moderate genetic correlations with carcass quality, clearly indicate that it is a useful trait for inclusion in a multi-trait genetic evaluation for carcass quality. The strong positive genetic correlations observed between the muscle linear traits and weanling quality (r g ⩾ 0.71) suggest they are measuring relatively similar genetic characteristics in the animals, despite being measured by trained assessors (i.e. linear scores) or individual farmers (i.e. weanling quality). Currently, Irish farmers receive a small financial incentive to record weanling quality (as well as other information). However, the recording of weaning quality (and the other traits) may still persist, for some animals at least, even without the financial incentive in the future, if farmers see their recorded data contributing to genetic evaluations and thus genetic gain.
The weak correlations between carcass cut weights and live weight were expected because of the adjustment of the carcass cut weights to a constant carcass weight in this study. Renand (Reference Renand1985) also observed weak genetic correlations between weaning weight and carcass muscle percentage (−0.08) and carcass fat percentage (0.11) in a model adjusting for slaughter weight. Without the adjustment to a constant carcass weight in this study, the genetic correlations between carcass cut weights and live weight at weaning were 0.37, 0.38, 0.21 and 0.32 for LVC, MVC, HVC and VHVC, respectively, and 0.49, 0.48 and 0.50 for total meat weight, total fat weight and total bone weight, respectively.
Genetic correlations between carcass cut weights and muscle linear scores were, as expected, positive and moderate to strong since linear scores for muscularity describe the amount of muscle present on the live animal. The genetic correlations between the carcass cut weights and muscle linear scores were consistent across both weaning and post weaning for LVC, HVC, VHVC, but noticeably weaker for MVC especially at weaning. The linear score traits used in this study all describe the physical structure and composition of the animals hindquarter; no linear scores were available in this study that properly describe the volume of the shoulders (Figures 1, 2a and b). At post-weaning, the genetic correlations between the linear scores and MVC (−0.12 to +0.23) were weaker than the genetic correlations of linear scores with the other cut traits (LVC, HVC and VHVC) but to a lesser extent than those taken at weaning. This may reflect the importance of age in the development of the muscle on the animal. Results from Teuscher et al. (Reference Teuscher, Ender and and Wegner2006) on changes in muscle structure with breed and age also suggested that difference in muscle size (defined by the muscle cross-sectional area) within and between breeds (Angus, Galloway, Holstein–Friesian and Belgian Blue) become significantly more apparent after 12 months of age. This implies that linear scores at post-weaning age should be a better indicator of carcass cut weights, and results from this study generally support this hypothesis.
Conclusions
This study clearly shows a benefit in increasing the accuracy of selection on carcass cut weight from exploiting data on routinely available measures of performance in Irish cattle such as auction price and weanling quality scored by farmers. Other recorded phenotypes such as linear scores at weaning and post weaning are also useful predictors of carcass cut weights, but with potentially higher recording costs, albeit the linear scores are usually recorded on the selection candidates themselves, which may increase the accuracy of selection but also reduce the generation interval. Carcass quality in the Irish national evaluation, which is currently based on the EUROP scores for carcass, should now be replaced with a multi-trait genetic evaluation for carcass cut weights predicted from VIA, which includes other performance traits such as linear scores, auction price and weaning quality.
Acknowledgements
The authors wishes to thanks the two anonymous reviewers for their helpful and constructive comments.