I. INTRODUCTION
A fundamental understanding of the role of microstructure on properties provides researchers a pathway to control them in a predictable way. One well-known example of the linkage between microstructure and properties is the Hall–Petch relationship,Reference Hall1, Reference Petch2 which correlates the strength of materials to the average grain size. Since the mid-20th century, this relationship has coupled the yield strength of polycrystalline materials to the inverse square root of their mean grain size.Reference Hall1–Reference Bull, Sanderson, Moharrami and Oila5 This expression, based on experimental findings on the behavior of steels, embodies the strengthening of materials by grain boundaries, which impede dislocation motion, and has been applied to metals, ceramics, and intermetallics.Reference Dieter6 The role of grain size continues to be of interest today, as researchers explore the limits of this expression for decreasingly small grainsReference Kumar, Van Swygenhoven and Suresh7 and an inverse behavior for nanostructured materials.Reference Conrad and Narayan8
While the discussion of the role of the “average” grain size on properties continues in the literature,Reference Kumar, Van Swygenhoven and Suresh7 the role of the grain size “distribution” has been largely overlooked. This consideration is important as the models that explicate the material behavior are based on an assumption that all grains in the material have the same size.Reference Kurzydlowski9 However, heterogeneous materials rarely meet this criterion. Therefore, to achieve a more robust understanding of material behavior, knowledge of the role of the distribution of grain size on properties is fundamental.
A limited number of theoretical works have considered the role of grain size distributions on propertiesReference Kurzydlowski9, Reference Berbenni, Favier and Berveiller10; and an even smaller number of experimental corroborations exist. For example, one older experimental study found a correlation between noise in magnetic media and grain size distributions.Reference Park, Sinclair, Lal, Malhotra and Russak11 However, there has been little work to intentionally and systematically modify the grain size distribution and explore its role on properties. One key reason is the difficulty in tailoring the grain size distribution. It is nontrivial to change the grain size in bulk materials as usual methods involve cold rolling and aging steps.Reference Suzuki, Otsuka and Wayman12 Additionally, these processes often produce other changes, such as precipitates, which can be deleterious to assessing properties.Reference Funakubo13 Therefore, a straightforward methodology for modifying microstructures is needed to explore the role of grain size distributions on material properties.
II. EXPERIMENTAL DETAILS
A suitable candidate material for such a study would be an amorphous material with well-characterized crystallization behavior. Such an understanding would eliminate the need for the difficult aforementioned heating processes and reduce the risk of introducing precipitates. Recent advances in the crystallization of sputter-deposited amorphous NiTi thin films enable such studies and help to illuminate the role of grain size distributions on properties. Their microstructure can be straightforwardly changed,Reference Lee, Ni, Wu and Ramirez14–Reference Lee and Ramirez17 as their nucleation and growth rates are known.Reference Lee, Ni, Wu and Ramirez15, Reference Lee, Huang, Mohanchandra, Carman and Ramirez18 These materials crystallize polymorphically,Reference Scott and Luborsky19 i.e., they have constant nucleation and growth rates. Using such materials, with well-characterized crystallization processes, the work in this article endeavors to modify grain size distributions and examine their effects on mechanical behavior and other associated properties.
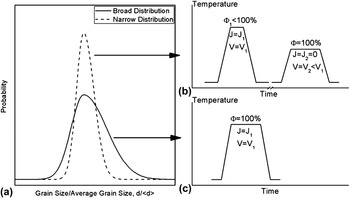
Microstructures with different grain size distributions were generated by selectively suspending nucleation before the film was fully crystallized.Reference Wu20, Reference Chu, Quek, Chee, Chiu and Wu21 Broad distributions were generated using a one-step (conventional) annealing process, where both nucleation (J) and growth (V) were active. Narrower distributions were generated using a two-step annealing processReference Chu, Quek, Chee, Chiu and Wu21 where both nucleation and growth were active in the first step at an annealing temperature of T 1 (where J = J 1 and V = V 1); however, in the second step, the film completes crystallization with a negligible amount of nucleation occurring but active growth (i.e., J = J 2≅0 and V = V 2) at an annealing temperature of T 2. A schematic drawing of these heating schedules and their associated grain size distributions are shown in Fig. 1. With this two-step heating schedule, crystallization moves away from a Johnson-Mehl grain structure of one-step anneals (with constant nucleation during crystallization) to a site-saturated crystallization process (where all nucleation occurs only at the beginning of crystallization).Reference Chu, Quek, Chee, Chiu and Wu21
(a) A schematic of grain size distributions as a function of a normalized grain size (of the grain size, d, divided by the average grain size, <d>) for various crystallization conditions, (b) the two-step crystallization process produces a narrow grain size distribution, and (c) the conventional one-step crystallization process generates a broad grain size distribution.

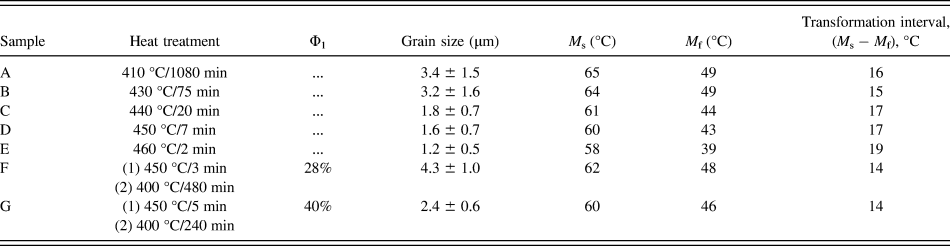
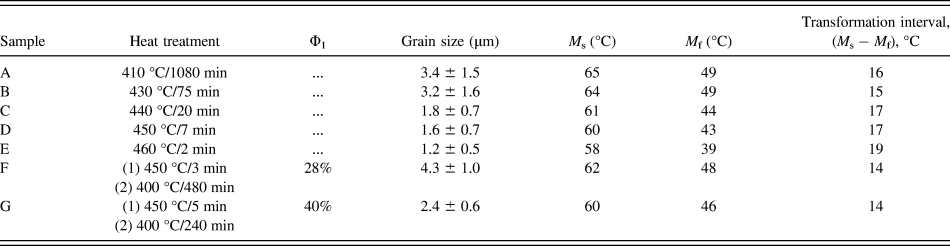
Amorphous NiTi thin films, about 1-μm thick and of the composition of Ni48.3Ti51.7, were sputtered-deposited onto Si3Nx-coated silicon wafers.Reference Lee and Ramirez17 The one-step and two-step anneals were conducted in vacuum (at 5 × 10⁻⁵ Torr) with the heating schedules listed in Table I.Reference Lee, Ni, Wu and Ramirez16 The grain sizes and distributions were characterized by transmission electron microscopy (TEM) using standard plan-view sample preparation methods.Reference Williams and Barry Carter22 To obtain the grain size distribution, the average grain size and standard deviation of over one hundred grains were measured for each sample. The mechanical properties were evaluated using a Hysitron Ubi1 nanoindenter (Hysitron, Minneapolis, MN) with a Berkovich indenter tip. Tests were performed under a depth-control condition to a depth of 100 nm at a rate of 10 nm/s, with 3-s holds at the maximum load. We programmed and tested an indentation grid of 25 points. All indents were less than 10% of the film thickness, to minimize the substrate’s effects on the measurements.Reference Oliver and Pharr23
Heating schedules, the measured grain size, and various transformation temperatures for these samples.
III. RESULTS AND DISCUSSION
A. Grain size distribution
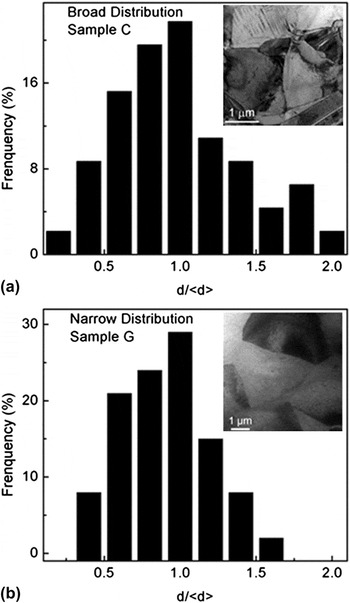
Figure 2 shows that these annealing schedules do indeed modify the grain size distribution. For samples that underwent conventional, one-step crystallization (Sample C), a broad grain size distribution was generated with minimum and maximum grain diameters of 390 nm and 3.6 μm as determined by the analysis of TEM micrographs [Fig. 2(a)]. Specimens with narrower grain size distributions that underwent two-step crystallization (Sample G) show a marked difference in their grain size distribution. The minimum and maximum grain diameters are 800 nm and 3.5 μm [Fig. 2(b)] (See Table I). As Fig. 2(b) shows, a narrower grain size distribution is obtained; this is attributed to the suspension of nucleation in the second stage of crystallization. These methods produce samples with similar grain sizes but differing distributions. (It should be noted that comparison of these samples would be valid only with their average grain size being within a standard deviation of each other).
A typical grain size distribution for (a) a one-step crystallization of 440 °C for 20 min (Sample C), and (b) two-step crystallization of 450 °C for 5 min followed by 400 °C for 240 min (Sample G). The x-axis is the normalized grain size of the grain size, d, divided by the average grain size, <d>. The insets are the typical TEM micrographs for the samples.

B. Mechanical properties
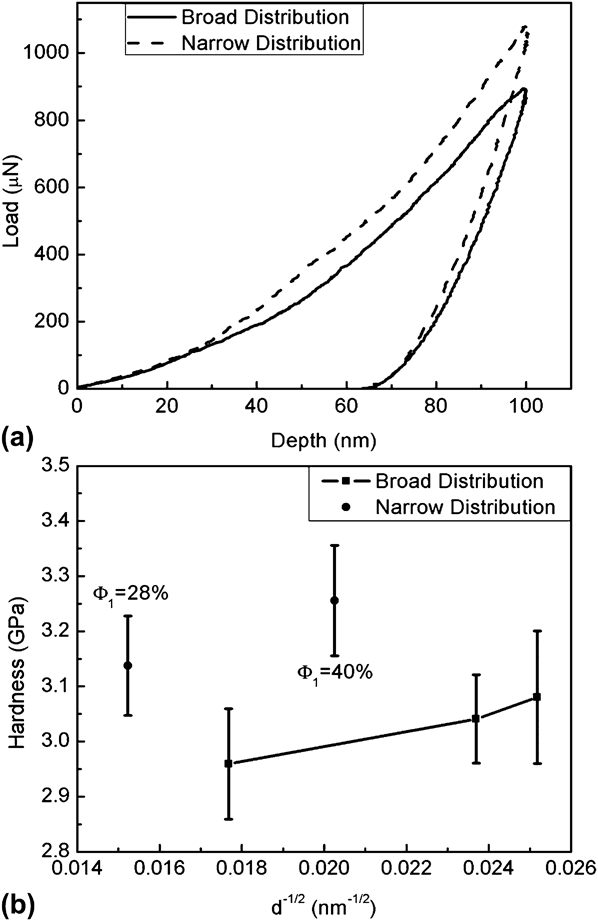
Grain size distributions affect the mechanical properties, as the nanoindentation response of these samples in Fig. 3(a) shows. A typical curve of the load versus the depth of indentation for samples with broad (Sample C) and narrow (Sample G) grain size distributions are shown. For the same indentation depth of 100 nm, the sample with the narrower grain size distribution requires a higher load, indicating that this material has a higher hardness and higher yield strength.
The effect of grain size distribution on the mechanical properties: (a) The typical P-h curves of NiTi films with different grain size distributions, and (b) the calculated hardness as a function of reciprocal of the square root of average grain size.

A comparison of the yield strengths of all the samples is instructive. Samples with broad grain distributions follow a linear relation between the grain size and yield strength. This linear (Hall–Petch) relationshipReference Koch, Morris, Lu and Inoue3, Reference Pakiela, Lewandowska, Kurzydlowski and Li4 can be expressed as:
 $${\rm{\sigma }}_{\rm{y}} = {\rm{\sigma }}_0 + kd^{ - 1/2} \quad,$$
where d is the average grain size of a material, σy is its yield stress, σ0 is the material’s resistance to dislocation motion, and k is the dislocation locking stress parameter. From the nanoindentation experiments, we obtain values for hardness, which is directly proportional to the yield strength.Reference Dieter6 If we plot the hardness values for all the samples as a function of the inverse square root of their mean grain size, we find that the samples with broad distributions follow the Hall–Petch relationship; however, narrower grain size distributions depart from it. As Fig. 3(b) shows, the average hardness (and its associated yield strength) of 25 indents for the one-step crystallization samples increases with reducing average grain size. However, the films with the narrower grain size are systematically higher than the Hall–Petch predictions.Reference Hall1, Reference Petch2, Reference Kurzydlowski9, Reference Berbenni, Favier and Berveiller10 This work experimentally shows that grain size distributions directly affect mechanical properties.
The difference can be described by considering the behavior of differently sized grains. It has been proposed that larger grains support most of the load during deformation and yield first,Reference Koch, Morris, Lu and Inoue3, Reference Pakiela, Lewandowska, Kurzydlowski and Li4 while the smaller grains are still in their nondeformed state.Reference Berbenni, Favier and Berveiller10 In the samples with broad grain size distributions, the largest grains will yield first at lower loads than the grains that are within a sample with a narrow distribution. The samples with narrower grain size distributions have a homogeneous deformation behavior, where all grains uniformly support loads. Their grains being smaller in size causes them to yield at a higher value than the grains within the broad grain size distribution.Reference Berbenni, Favier and Berveiller10 Accordingly, the samples with narrower grain size distributions yield at a higher stress and have a higher yield strength (and hardness), as we see in Fig. 3(b). In essence, it is the population of larger grains in the sample with the broad distribution that represents the overall mechanical properties of the sample.Reference Kurzydlowski9
The practical significance of these observations is that it leads to new routes to the tailoring of material properties by the manipulation of microstructure,Reference Yip24 a long-sought goal for those who study materials. While simulations have indicated such behavior,Reference Kurzydlowski9, Reference Berbenni, Favier and Berveiller10 these experimentally determined results advance our understanding of how this may be accomplished. Many of the basic assumptions of the Hall–Petch relationship have been overlooked over the years, particularly the assumption that all grains have the same size and shape.Reference Kurzydlowski9 We see that materials with a similar grain size but with different grain size distributions behave differently. The strength of materials does not solely depend on the average grain size but on higher-order parameters, such as the grain size distribution. These observations indicate that plastic strain is not evenly distributed among the grains of different sizes; larger grains, which are softer, exhibit the highest plastic strain.Reference Kurzydlowski9, Reference Berbenni, Favier and Berveiller10 This work shows that for optimizing propertiesReference Berbenni, Favier and Berveiller10 materials should be characterized not only by their mean grain size but also in terms of their grain size distributions.
C. Phase transformation
In addition to analyzing the mechanical properties, we also characterized the martensitic phase transformation behavior as a function of grain size distributions, as phase transformations are closely linked to mechanical properties.Reference Adnyana25–Reference Wu, Bohong and Hsu29 Phase transformations are generally characterized by the temperatures at which they start and finish. These key temperatures, which are associated with the transformation’s start and finish of austenite and martensite formation (A s, A f, M s, and M f), were measured for 10 × 25 mm2 coupons using a KLA-Tencor FLX-2320 wafer curvature system (KLA-Tencor, Milpitas, CA) operating between 25 and 100 °C.
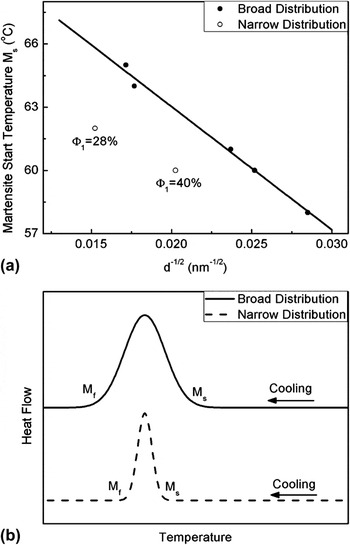
Modifying grain size distributions has a marked effect on the phase transformation behavior. Figure 4(a) shows the martensite start temperature, M s, as a function of grain size, d −1/2, for samples with broad and narrow distributions.Reference Otsuka, Wayman, Otsuka and Wayman30 The M s temperatures of samples with a broad distribution follow a linear Hall–Petch-like relation with respect to the reciprocal of the square root of average grain size,  $M_{\rm{s}} = M_{\rm{s}}^{\rm{s}} + K_{Ms} d^{ - 1/2}$, where
 $M_{\rm{s}}^{\rm{s}}$ indicates the martensite start temperature of a single crystal, and is a constant.Reference Wu, Bohong and Hsu29 This linear behavior has been observed by other researchers.Reference Adnyana25–Reference Wu, Bohong and Hsu29 However, the samples with narrow grain size distributions depart significantly from this linear relationship, indicating that modifying grain size distributions play a role. [It is worthy to note that the other transformation temperatures (of A s, A f, and M f) behave similarly to the M s temperature (See Table I)].
(a) The martensitic start transformation temperature (M s) as a function of the reciprocal of the square root of average grain size for NiTi shape memory films that have different grain size distributions resulting from one- and two-step crystallization. The crystallized fraction in the first crystallization step Φ1 is indicated. (b) A schematic showing the differential scanning calorimetry peaks for samples with broad and narrow grain size distributions.

Understanding the departure from the Hall–Petch-like equation requires an examination of the variables affecting phase transformations. The M s temperature can be expressed byReference Hornbogen31:
 $$M_{\rm{s}} = T_0 - \Delta T = T_0 - {{C{\rm{\tau }}_{\rm{y}} {\rm{\gamma }}_{\rm{T}} } \over {\Delta S}}\quad,$$
where T 0 is the thermodynamic equilibrium temperature between austenite and martensite, and ∆T is the undercooling, which is a function of the shear stress τy, transformation strain γT, and the entropy change during transformation ∆S (note that C is a constant). The equilibrium temperature is influenced by the degree of order, chemical composition, and hydrostatic stress.Reference Hornbogen31 In the present study, the equilibrium temperature does not contribute to the change in the M s temperature, as the annealing temperatures are much lower than the order-disorder transition temperature of NiTi (of 1090 °C)Reference Miyazaki, Igo and Otsuka32; samples are nominally the same composition (resulting from the same deposition); and no hydrostatic stress was applied to the samples. The change in the M s temperature results from the second term in Eq. (2). It is important to note that entropy and transformation strain contribute little, as they are constant during martensitic transformations, resulting from samples having the same composition.Reference Sawaguchi, Sato and Ishida27 Therefore, the change in the M s temperature is primarily influenced by the shear stress, τy.
As shown in Fig. 3(b), narrower grain size distributions increase the yield strength and hardness, which in turn increases the shear stress, τy.Reference Dieter6 If we plug this parameter into the second term in Eq. (2), we see that the higher shear stress generated by a narrower grain size distribution leads to a larger undercooling ∆T. Thus, a narrower grain size distribution results in a lower M s temperature, causing the departure from the linear relationship observed for samples with broader distributions. Differential scanning calorimetry results, similar to those schematically shown in Fig. 4(b), corroborate this and systematically show a narrowing of the transformation interval (of M s − M f) with narrowing distributions, which is often accompanied by lower M s temperatures (Table I). All in all, these observations underscore that modifying microstructures, particularly grain size distributions, have implications for tailoring material properties.
IV. SUMMARY
In summary, we found that grain-size distributions of materials influence the properties. Films with broad distributions, generated by a one-step anneal, had mechanical behaviors that follow a linear Hall–Petch relationship. Films with narrow distributions depart from it. A two-step crystallization process, where nucleation and growth are active in the first step but nucleation is inhibited in the second step generated these narrower grain size distributions. We also found that phase transformation temperatures are influenced by grain size distributions and decreased significantly with narrowing distributions. All in all, this investigation sheds light on the role of microstructure on properties, by illuminating the often-forgotten role of the heterogeneity in grain sizes in materials. This work underscores the role of grain size distributions on properties and provides new routes to tailor them.
ACKNOWLEDGMENT
This work made possible by the US National Science Foundation (Grant No. 0907090).