Nomenclature
Abbreviations
- AMAN
Arrival Manager
- ANSP
Air Navigation Service Provider
- APD
Aircraft Performance Database
- ASP
aircraft sequencing problem
- ATCo
Air Traffic Controllers
- ATFM
air traffic flow management
- ATM
air traffic management
- BADA
base of aircraft data
- CARATS
Collaborative Actions for Renovation of Air Traffic Systems
- CDO
continuous descent operations
- DBS
distance-based separation
- Eurocontrol
European Organization for the Safety of Air Navigation
- FAA
Federal Aviation Administration
- FCFS
first-come first-served
- IATA
International Air Transport Association
- ICAO
International Civil Aviation Organization
- NextGen
Next Generation Air Transportation System
- P-RNAV
precision-area navigation
- PMS
Point Merge System
- PSO
particle swarm optimisation
- RPKs
revenue passenger kilometers
- SAA
Speed Adjustment algorithm
- SESAR
Single European Sky ATM Research
- SRA
Speed Restriction algorithm
- TBO
trajectory-based operation
- TBS
time-based separation
- TMA
terminal manoeuvering area
Symbols
-
 ${A_i}$
-
Aircraft number i
- D
-
The flown distance by an aircraft
-
${d_{i,Sk}}$
-
The flown distance by aircraft i in the arc k
-
$E{P_i}$
-
Entrance point number i
-
${H_i}$
-
Holding area number i
-
${K_i}$
-
Initial approach point number i
- p
-
Landing order number following the Sequencing algorithm
- PM17
-
Point Merge of runway 17
- q
-
The landing order number following the FCFS algorithm
-
$Rfi$
-
The estimate time of aircraft number i to penetrate into zone 2
- Ri
-
Radius of zone number i
- Sk
-
PMS arc number k
- SLK
-
The point merge of the runway 35
-
$tes{t_{fi}}$
-
The estimate landing time of aircraft number i according to FCFS
-
$tes{t_i}$
-
The estimate landing time of aircraft number i after separation
-
$test{v_i}$
-
The estimate landing time of aircraft number i after speed adjustment
-
${t_{fi}}$
-
The estimate time of aircraft number i to penetrate into zone 2
-
${t_k}$
-
The time left for aircraft nubmer k to land
-
${V_{app}}$
-
Approach speed
-
${V_{ar}}$
-
Touchdown speed
-
${V_e}$
-
Entrance speed
-
${V_f}$
-
Final speed
-
${V_i}$
-
Initial speed


Greek symbol
-
${\alpha}$
-
the arc opening angle of the merge point configuration
-
${\theta}$
-
the incoming angle


1.0 Introduction
On 6 February 2020 in Geneva, The International Air Transport Association (IATA) has released its statistics on world passenger traffic for the year 2019, showing that the demand revenue passenger kilometers (RPKs) increased by 4.2% over 2018 [1]. Which corresponds to the increasing numbers of aircraft movements’ all over the world especially in Europe and the USA. To face this continuous growth and in order to build a flight operation system by 2030, when air traffic volume is predicted to double from its current level, the International Civil Aviation Organization (ICAO) has produced the global air traffic management operational concept. Based on this concept, The European Organization for the Safety of Air Navigation (Eurocontrol) produced the Single European Sky ATM Research (SESAR). In the USA, the Federal Aviation Authority (FAA) elaborates an infrastructure program to modernise the national airspace system called the Next Generation Air Transportation System (NextGen). Other organisations concentrate on developing newer tools and technologies to upgrade the air traffic management system. For example, Japan has implemented a Collaborative Actions for Renovation of Air Traffic Systems (CARATS). This tool requires cooperation with diverse aviation stakeholders in order to change Japan’s air traffic system in a decisive and long-term manner [2]. In view of the enormous increase in air traffic flows, managing the airspace in a terminal manoeuvering area (TMA) is the most challenging task in the entire Air Traffic Management (ATM) system, and it is believed to be the root cause of all limitations and delays imposed on scheduled flights. The factor pushing Air Navigation Service Providers (ANSPs) to expedite the establishment of multiple supports in order to handle the complexity and volume of future aviation traffic.
The integration of such tools is necessary and can help Air Traffic Controllers (ATCos) maintain the safety of the current level of air traffic despite the growth in its flows. These tools make it simpler to plan efficient arrival sequences and to optimise aircraft trajectories and arrival times in order to maintain a steady stream of arrival traffic. They also help apply the Continuous Descent Operations (CDO) procedures assisted by arrival merging techniques, (such as the Point Merge System [PMS]) and reduce the total flight’s duration, flown distances and fuel use.
2.0 State of art
The volume of air traffic has dramatically risen over the past few decades, and predictions indicate that this trend will continue growing. In fact, the scenario, referred to as “controlled growth” by Eurocontrol’s prediction specialists, stated that the number of flight movements in Europe is expected to reach 14.4 million in 2035, which is 1.5 times the volume in 2012 [3]. The ongoing expansion of civil aviation has far-reaching impacts. On one hand, during peak hours, the air navigation system has practically hit its capacity limit (i.e. the physical capacity is less than operational capacity). On the other hand, it will be more difficult to control air traffic bottlenecks and there will be more delays. The TMA surrounding the airport has typically been the first region to have congestion issues and delays. The TMA is that crucial transition dynamic space between the landing surfaces and the upper airspace. Moreover, it has also been identified as a vital sector and continues to be the greatest barrier for the world’s ATM. Given that the TMA has been regarded as one of an airport’s limitations and that its capacity is viewed as crucial to the point where it cannot be simply raised; operations with modern aircraft on the available runways became complicated and difficult. Which made aircraft operations management a vital part of air transportation systems. Therefore, and since optimising takeoff and touchdown times is a cost-effective approach to increase the aircraft numbers, depending on the available runways capacity, our particular instance concerns finding a solution for the Aircraft Sequencing Problem (ASP). These are the summaries of the most relevant works and contributions that consider some aspects of our work: In order to reduce emissions into the environment and energy usage, the research [Reference Errico and Di Vito4] describes a system for automatically creating effective curved and continuous descent approach trajectories in a common TMA. In [Reference Xu, Zhang, Liao and Yang5] the authors, according to statistics, establish dynamic models to describe potential behaviours of traffic (divided in three flow phases) including following, holding and manoeuvering. The paper [Reference Ruiz, Piera and Del Pozo6] proposes a medium-term conflict detection and resolution approach to detect time-based separation infringements between aircraft and then allocate dynamic arrival routes taking into consideration the execution of continuous descent approaches. By comparing the theoretical organisation of the queue with the actual distribution seen in the TMA, the contribution [Reference Caccavale, Iovanella, Lancia, Lulli and Scoppola7] proposes a model that gives a remarkably accurate representation of the traffic. The publication [Reference Diao and Chen8] proposes an optimised model which integrates 4D trajectory-based operations and employs sector-less airspace configurations Along with handling the flight-by-flight difficulties of rerouting, ground-holding delays, fuel use and flight cancellation. To minimise the effort of the ATCos, the authors of paper [Reference Velasco, Mulder and van Paassen9] conduct an experiment including the task of merging aircraft onto a single route. Depending on the various traffic levels that were evaluated, significant effects of the aolution space diagram were discovered, and respondents submitted subjective effort ratings at predetermined intervals of time. A novel method for automatically integrating several aircraft flows in a busy TMA is presented in the study [Reference Man10]. The writers of this paper [Reference Bongo, Alimpangog, Loar, Montefalcon and Ocampo11] address the issue of air ATCos’ workload stress by determining the primary stressors and arriving at a ranking of likely remedies that may be used as soon as such a problem is detected in order to be lessened. The paper [Reference Kistan, Gardi, Sabatini, Ramasamy and Batuwangala12] critically reviews Air Traffic Flow Management (ATFM) research and development efforts (conducted by the official organisations like ICAO, IATA, the FAA and Eurocontrol) hold the most potential for realistic technological adoptions, delivering clear advantages in the sense of increased effectiveness and safety at an era when aviation traffic is growing. In [Reference Prakash, Piplani and Desai13] a data-splitting approach is suggested to resolve the ASP on one runway under both separate and combined modes of operation with the goal of optimising total throughput. Safety separation requirements, expansive time frames, and restricted position changing are some examples of these realistic limits. The authors of the paper [Reference Janić14] examine and simulate a few effects of potential solutions for aligning the airport runway system’s landing capacity to associated demand. A new Arrival Manager (AMAN) algorithm relies on the merging optimisation technique is proposed in [Reference Toratani15] and it also optimises aircraft itineraries to support Trajectory-Based Operations (TBO). The suggested AMAN algorithm illustrates the compromise between reducing flight time and energy consumption. Concentrating on an integrated system, the contribution [Reference Rodríguez-Sanz, Comendador, Valdés and Pérez-Castán16] provides a systematic analysis of the airplane over the airport’s organisational system. It gives information on the interdependencies between components affecting performance and presents a fresh methodological approach to assess and forecast the systems status at the rotation stage. A multi-level PMS approach is used in the paper [Reference Liang, Delahaye and Maréchal17] to provide an effective trajectory planning method to address the problem of integrating of arrival and departure traffic on parallel runways. It can provide a fairly close continuous descent approach for arriving aircraft, a cost-effective climb for departing aircraft, simpler runway allocation and trajectory control solutions. It also demonstrates effective and dynamic sequencing efficiency in the TMA. The authors of the paper [Reference Riahi, Newton, Polash, Su and Sattar18] attempt to improve ASP research by more effectively utilising the structural information that is unique to the issue. Their suggested techniques perform better than current cutting-edge aircraft sequencing algorithms. The contribution [Reference Murça and Müller19] outlines an approach for optimising flight operations that will help ATCos choose and manage landing and departure schedules at airports that are practical from an operational standpoint. The paper [Reference Dalmau and Prats20] concentrates on regulating the time of arrivals once the descent has already begun, evaluating the achievable time frame (and related fuel consumption) of CDOs that don’t need using either the thrust or the speed-brake throughout the whole descent. The paper [Reference Pandian and Rout21] focus on modeling the aircraft landing problem using a program with a formulation that consists on breaking down the problem into sub problems: scheduling, sequencing and landings problems. The contribution [Reference Bennell, Mesgarpour and Potts22] takes into account the planning of aircraft landings on one runway. In order to establish some time frame limits for each aircraft’s landing time and a minimum separation time between consecutive landings according to their wake turbulence class, it studies the static inputs and the dynamic changes of the arrival flights. In their study [Reference Gatsinzi, Nieto and Madani23], the authors propose an updated requirement and capacity alignment approach for managing air traffic flow capacity. That can be used to reduce potential conflicts between aircraft trajectories prior to takeoff. Their goal is accomplished by making small changes to aircraft’s timeframes of arrival at complex en-route crossroads, which are easily converted into pre-tactical measurements and lessen the ATCos’ effort associated with Separation Management interventions.
3.0 Problematic
3.1 Inbound convergence point
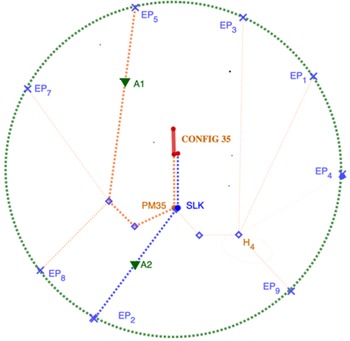
Most TMAs are not centred on the inbound traffic convergence point. Moreover, many factors change frequently such as: wind, weather, noise reduction procedures and other operational procedures which lead to many runway configuration scenarios and therefore the change of the final approach phase and the respective inbound convergence point. This paper took as case study the Mohammed V airport, which has two parallel runways 35/17. Figure 1 shows a simplified version of the airport’s TMA with the corresponding convergence points.
Different runways configurations.

Furthermore, the convergence point is variable while the shape of the terminal area remains the same, which is impossible for the last one to be centred on the convergence point.
3.2 The FCFS concept
There are several issues in the current radar vectoring method: Significant workloads for ATCos, multiple radio communications, difficult positions for pilots to determine their location, troubles in the prediction and improvement of vertical profiles. Before that, the ATCos have to establish a sequence for the inbound traffic using FCFS concept. Let SLK be the convergence point, we assume that we have two aircrafts on arrival:
 ${A_1}$
and
 ${A_2}$
.
3.2.1 Same speed and different distance
With the same performance in term of speed V as mentioned in Fig. 2. The aircraft
 ${A_2}$
will cross the lateral TMA boundary before the aircraft
 ${A_1}$
but the last one is a 30NM away from the point SLK with a touchdown estimate in 14 min while
 ${A_2}$
is 50NM away from SLK with a touchdown estimate in 18 min. According to the FCFS
 ${A_2}$
will land in 18 min, and taking into account the 2 min of spacing at landing, it will add a minimum delay of 6 min for
 ${A_1}$
to land and an additional flown distance of
 $D \ge 6min \times V$
to its path. While if
 ${A_1}$
lands before
 ${A_2}$
, no delay will be generated for both aircraft. So, it is clear that the first aircraft that crossed the lateral boundaries of the TMA is not necessarily the first one to land.
Same speed with different distances.

3.2.2 Same distance with different speeds
Now we suppose that we have two aircraft on arrival:
 ${A_1}$
and
 ${A_2}$
(
 ${A_2}$
with less performance in speed V than
 ${A_1}$
) with speeds
 ${V_1} \gt {V_2}$
and
 ${A_1}$
will cross the TMA boundaries first. We define
 ${t_k}$
(the time left for aircraft k to land), with
 ${t_1} = 15min$
,
 ${t_2} = 18min$
. Aircraft
 ${A_2}$
at the same distance to SLK as
 ${A_1}$
as illustrated in Fig. 3. So according to the FCFS concept, if
 ${A_2}$
will land in 18 min, and taking into account the 2 min minimum spacing between 2 aircraft at landing, It will add a minimum delay of 5 min for
 ${A_1}$
, and a crossed distance
 $D \ge 5 \times {V_1}$
in addition to
 ${A_1}$
’s path, while if
 ${A_1}$
lands before
 ${A_2}$
no delay will be generated for both aircraft. Following this example, the new touchdown estimates of
 ${A_1}$
and
 ${A_2}$
are:
 ${t_1} \ge 21min$
and
 ${t_2} = 18min$
. The closest aircraft to the convergence point is not necessarily the first one to land.
Same distance with different speeds.

3.2.3 Different distances with different speeds
Now we suppose that we have two aircraft on arrival
 ${A_1}$
and
 ${A_2}$
(
 ${A_2}$
with less performance in speed than
 ${A_1}$
) with speeds
 ${V_1} \gt {V_2}$
and
 ${A_1}$
will cross the TMA boundaries first as demonstrated in Fig. 3. We define
 ${t_k}$
(the time left for aircraft k to land), with:
 ${t_1} = 14min$
,
 ${t_2} = 19min$
. Aircraft
 ${A_2}$
is closer in term of distance to SLK. So according to the FCFS concept,
 ${A_2}$
will land in 19 min, and considering the minimum 2 min spacing at landing, it will add a minimum of 7 min delay for, and an additional distance of
 $D \ge 7 \times {V_1}$
to
 ${A_1}$
’s path, while if
 ${A_1}$
lands before
 ${A_2}$
no delay will be generated for both aircraft. Following this example, the new estimated landing times of
 ${A_1}$
and
 ${A_2}$
are:
 ${t_1} \ge 21min$
and
 ${t_2} = 19min$
. According to the three examples above the closest aircraft to the convergence point is not necessarily the first one to land, so we have to use other criteria more efficient then distance or position to make the best decision.
4.0 The main used concepts
Following the previous section, it is clear that the ATCos are in need of a decision support tool using real time algorithms to help them establish aircraft sequence with the minimum possible delay. Our proposed tool is based on these concepts:
4.1 Time based separation
Time Based Separation (TBS) is an optimal concept for the use of the airspace. It is a system that separates aircraft based on time rather than distance and takes into account aircraft’s performance, runway capacity and other factors. In order to use this concept at a specific time, we are going to adopt another concept that allows us to apply our method while respecting the prescribed regulatory separation, the Merge Point concept [Reference Doc24].
4.2 The point merge system
The PMS method is among the most efficient proposed solutions for ATM during the approach phase in a TMA, it is a systematised arrival flow sequencing method developed by the Eurocontrol Experimental Centre in 2006. It is also one of the upgrades of the ICAO Aeronautical System Blocks and considered as a technique to support continuous descent operations (CDO - ICAO doc 9,931) [25].
The PMS concept is meant to provide safety, environmental and capacity benefits under different density situations. Taking into consideration the operational and environmental restrictions and the selected conception, the envisaged gains are:
-
Simplify ATCos’ tasks.
-
Reduce communications and workload.
-
Improve pilots’ awareness of the situations.
-
Efficient traffic flows with a prediction of arrival sequences.
-
Enhanced traffic sequences after the PMS.
-
Efficient flight trajectory prediction.
-
Operations’ unification and better ATM.
The PMS is built to function with dense traffic flows without radar vectoring. It is founded on a particular route structure (Precision-Area Navigation). It is made up of a convergence point and predetermined, evenly spaced segments equidistant from this point. An instruction to proceed directly the convergence point is given at the proper time to complete the sequence. When necessary, the segments are utilised to delay traffic as trajectory extension, the segments’ length is determined based on the corresponding capacity and the needed delay. In the case of our case study space, SLK is the convergence point (Merge Point), the point that all aircraft must pass through to begin the final approach. The ANSP has proposed a model based on the PMS concept to manage traffic in Mohammed V airport TMA. The proposed model is composed of holding circuits feeding an arc of 50NM, which has a capacity of five aircraft (given the prescribed horizontal separation) in order to finally join the SLK point. Once the arc is saturated, the aircraft wait in the holding circuits, and the capacity of each circuit does not exceed nine waiting aircraft, the aircraft goes through the holding circuit in 4 min. The downsides of this proposed model are:
-
The arc cannot be supplied with another aircraft until the first one has left it completely.
-
The holding time is a multiple of 4 min due to the holding procedure.
-
The distance between the holding circuits and the arc is long and generates a significant delay.
-
The proposed management ignored the position of the entry points and aircraft’s performance.
-
Fixed speed in the vicinity of SLK between 220kts and 230kts while there are aircraft that perform it difficultly by consuming more fuel.
4.3 Particle swarm optimisation (PSO)
The PSO is a metaheuristic technique used to solve an optimisation problem in a particle-based research environment. The PSO algorithm’s objective is to relocate these particles to their ideal place. These labels are given to each one of these particles:
-
A position
-
A speed
-
A neighbourhood
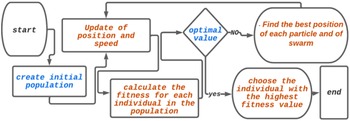
Every particle, as seen in Fig. 4, is aware at each iteration of:
-
Its prominent location.
-
The location of the swarm’s ideal neighbour.
-
The provided value to the objective function since a comparison between the value of the given criterion by the current particle and the ideal value is necessary after each iteration [Reference Clerc and Siarry26].
Particle Swarm Optimization diagram PSO.

5.0 The geometric proposed model
We arrange the aircraft so that the most performant ones are the first to be sequenced and continue so, the aircraft
 ${A_k}$
might touchdown from
 ${t_{k - 1}} + 2min$
, which means that the problem to be minimised is
 ${t_k}$
with the condition:
 \begin{align}{t_k} \ge {t_{k - 1}} + 2min\end{align}
The minimisation of
 ${t_k}$
implicates the minimisation of the flown distances.
The associated constraints using this sequencing model are in finding the optimal order. Which means the order that minimise the delays and following it, will make sure the aircraft land in a continuous manner while minimising the additional flown distances and separations between all the aircraft in approach phase.
5.1 Zones according to speed profile
In the TMA during the approach phase, aircraft execute an airspeed profile composed of five main speeds: entry, initial, approach, final approach and touchdown speeds referred to in the same order as
 ${V_e},{V_i},{V_{app}},{V_f},{V_{ar}}$
(1,4
 $ \times $
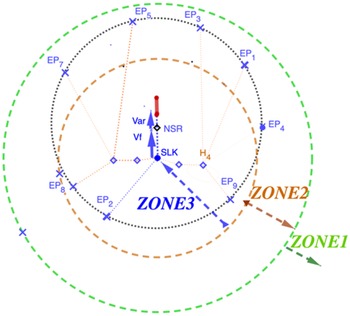
stall speed). As shown in the simplified graphics in Fig. 5, the TMA of Casablanca Mohamed V airport is sliced up into five zones according to speed variation as detailed before.
-
Zone 1 is the entry speed zone
${V_e}$
starts 60NM away from SLK. -
Zone 2 is the initial speed zone
${V_i}$
starts 30NM away from SLK. -
Zone 3 is the approach speed zone
${V_{app}}$
starts 15NM away from SLK. -
The 8NM segment after SLK is the final speed
${V_f}$
zone just after SLK. -
The 4NM segment before touchdown is the touchdown speed zone
${V_{ar}}$
.


The mentioned speeds vary depending on aircraft category and each aircraft that exceeds the radius
 $R3 = 60NM$
can influence the management and sequencing of air traffic.
Zones according to speed.

Considering a flow of aircraft on arrival, Air Traffic Controllers, following the FCFS concept, assign to each aircraft a landing number. Most times, this number changed several times due to the possibility of conflicts between aircraft (e.g. two aircraft reach the SLK point at the same time) or the delay of the second aircraft becomes not acceptable according to precedent one, and its need more vectoring which lead to more delay for booth of aircraft.
The sequencing model proposed by [25] aims to separate the aircraft and sequence them so to join the convergence points. Based on this model and the issues encountered by ATCos such as the mentioned conflict above, our model proposes to separate the aircraft according to the runway. The employed methods in this work take into account the current navigation circumstances, speed restrictions, flight levels,
 $ \ldots $
etc.
5.2 Zones according to incoming area
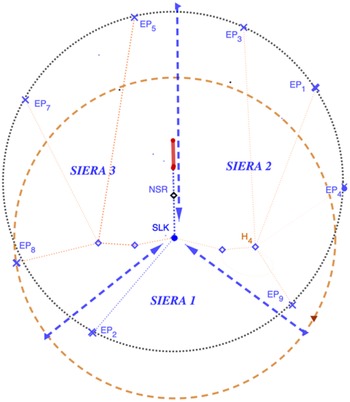
Aircraft can join the terminal area (approach area) from three different main zones as shown in Fig. 6:
-
SIERA1: Aircraft coming from the south (approach direction)
-
SIERA2: Aircraft coming from the north-east (northeast approach direction)
-
SIERA3: Aircraft coming from the north-west (opposite approach direction)
Incoming zones.

SIERA2 arrival aircraft have 3 min delay more than SIERA1 and SIERA3 arrival aircraft have 6 min delay more than SIERA1 due to restrictions, special procedures and departures conflicts. In this work, we aim to construct a real time algorithm that assigns to each aircraft an optimal landing order number, in which, aircraft with the highest performance will be served first, and so on.
5.3 The delay based on the FCFS concept
In order to know the benefit of our method we have to calculate the delay generated by the FCFS concept. Once the “x” aircraft are in zone 1, the algorithm calculates “tfi” the estimate time to penetrate into zone 2 of each aircraft Ai. Based on their penetrating estimates time, and in accordance with the FCFS concept, the algorithm arranges the aircraft in descending order based on their performance to determine the landing order number.
 $q\;:\;j \to q(j)$
, with
 $j \in \{ 1,2,3, \ldots ,n\} $
is the landing number of aircraft
 $Aq(j)$
. Thus, the succession of the aircraft is:
 $\{ Aq(1),Aq(2), \ldots ,Aq(n)\} $
. Consequently
 $Aq(1)$
lands at:
 ${t_{{f_1}}} = tq(1)$
, and Aq(2) can land at
 ${t_{f2}} = max({t_{f1}} + 2min,tq(2))$
. The runway is ready to receive
 $Ap(2)$
after
 ${t_{f1}} + 2min$
, this separation takes into account the liberation of the runway and the longitudinal separation on final approach and so on for the rest of
 $Aq(j)$
.
We define
 $Rfi = {t_{fi}} - tq(i)$
the aircraft’s
 $Aq(i)$
delay and i is the landing sequence number following the FCFS method.

-
We found p and q, respectively, the landing order number (Sequencing algorithm) and the landing order number (FCFS concept).
-
We calculated
${t_i}$
and
${t_{fi}}$
, respectively the touchdown estimates of aircraft
$Ap(i)$
(Sequencing algorithm) and the touchdown estimates of the aircraft
$Aq(j)$
(FCFS concept). -
We calculated Ri and Rfi, the delays of aircraft
$Ap(i)$
(Sequencing algorithm) and
$Aq(j)$
(FCFS concept).


Now the question is: How should
 $Ap(i)$
fly along and consume the delay Ri while landing continuously at
 ${t_i}$
, without any delay according to
 $Ap(i - 1)$
?
5.4 Our proposed geometric model
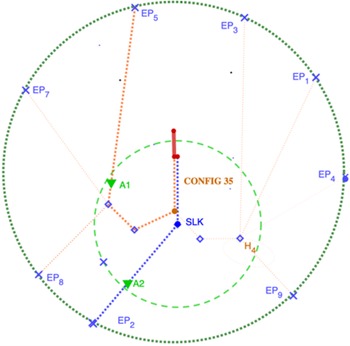
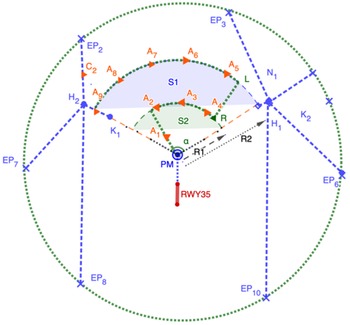
The solution to the issue is in the anterior section of the PMS concept by adding another arc, the two arcs will permit to re-order the aircraft that follow each other while remaining equidistant from SLK point as shown in Fig. 7. The idea behind this proposition is simple, after finding the permutation p, we must permute the aircraft with the following landing order:
 $\{ Ap(1),Ap(2), \ldots ,Ap(n)\} $
, with the aircraft
 $Ap(i)$
for
 $i = 2, \ldots ,n$
flies the delay Ri in the two arcs:
 \begin{align*}S1 = R22\pi/3 = 302/3 = 62.8NM\end{align*}
 \begin{align*}S2 = R12\pi/3 = 152/3 = 31.4NM\end{align*}
The choice of the
 $2\pi /3$
angle is made due to the constraints of actual navigation and also to ensure strategic separations with aircraft on departure. The three angles of incidence to joined
 $S1$
are:
-
$\Theta 1 = \pi /6$
assigned to aircraft coming from the zone SIERA1 since the traffic flow and the network of air traffic services routes feeding the TMA from the southern sector.
-
$\Theta 2 = 0$
,
$\Theta 3 = 0$
respectively assigned to aircraft coming from the zones SIERA2 and SIERA3.


 ${d_{i,S1}}$
is the flown path of Ai is arc
 $S1$
and
 ${d_{i,S2}}$
is the flown one in arc
 $S2$
by the same aircraft. Constraints for each aircraft
 ${A_i}$
:
 \begin{align}0 \lt {d_{i,S2}} \lt S1 - R2 \times \Theta j{\rm{,}}\;{\rm{for}}\;j = 1,2,3.\end{align}
 \begin{align}0 \lt {d_{i,S2}} \lt max(S2 - R1\Theta j - ({d_{i,S1}})/2,R1\Theta j + ({d_{i,S1}})/2){\rm{,}}\,\;{\rm{for}}\;j = 1,2,3.\end{align}
 \begin{align}{d_{i,S1}} \lt {d_{i,S2}}\end{align}
Merge point concept with two arcs.

It is clear that the flown distance over the arc
 ${S_1}$
by an aircraft
 ${A_i}$
coming from the zone SIERA1 is:
 ${d_{i,S1}} \in [0,S1 - 5\pi ]$
, as well as the flown distance over the arc
 $S1$
by an aircraft Ai coming from the zones SIERA2 or SIERA3 is
 ${d_{i,S1}} \in [0,S1]$
. For the flown distance over the arc
 $S2$
by an aircraft coming from the zone SIERA1, it is better to instruct it to fly in the longest direction so as to better utilise the arc
 $S2$
. Therefore,
 ${d_{i,S2}} \in [0,max(S2 - ({d_{i,S1}})/2,({d_{i,S1}})/2)]$
, as well as for the aircraft coming from the zones SIERA2 or SIERA3, with
 ${d_{i,S2}} \in [0,max(S2 - ({d_{i,S1}})/2,({d_{i,S1}})/2)]$
. As for the third constraint, it comes from the fact that we want to minimise the flown distance over both arcs because the speed
 ${V_i}$
, in the arc
 $S1$
is higher than the speed
 ${V_{app}}$
, in the arc
 $S2$
.
5.5 Modelisation
In the previous sections, we calculated the delay Ri of each aircraft
 $Ap(i)$
and suggested that aircraft should consume these delays over the arcs while remaining equidistant from the SLK point. We assume:
 ${d_{i,S1}} = {d_{i,1}}$
and
 ${d_{i,S2}} = {d_{i,2}}$
.
 ${V_{p(i),2}}$
is the initial speed
 ${V_i}$
for the aircraft
 $Ap(i)$
and
 ${V_{p(i),3}}$
is the approach speed
 ${V_{app}}$
for the aircraft
 $Ap(i)$
with:
 \begin{align}fi({d_{i,1}},{d_{i,2}}) = {{{d_{i,1}}} \over {{V_{p(i),2}}}} + {{{d_{i,2}}} \over {{V_{p(i),3}}}}\end{align}
Consequently, the multi-objective minimisation function is:
 \begin{align}min\sum\limits_{i = 2}^n |fi({d_{i,1}},{d_{i,2}}) - {r_i}|\end{align}
u.c:
 \begin{align*}{d_{i,1}} &\lt S1 - R2 \times \Theta j \\[5pt] {d_{i,2}} &\lt max\left(S2 - {R_1} \times {\Theta _j} - {{{d_{i,1}}} \over 2},{R_1} \times {\Theta _j} + {{{d_{i,1}}} \over 2}\right)\\[5pt] {d_{i,1}} &\lt {d_{i,2}}\\[5pt] {d_{i,1}} &\gt 0\\[5pt] {d_{i,1}} &\gt 0\end{align*}
6.0 The optimisation proposed model
6.1 The concept of speed restriction
Once the “n” aircraft are in zone 1, after detection of the aircraft’s type and ground speed, the algorithm calculates the estimate landing time
 ${t_i}$
of the aircraft
 ${A_i}$
by checking an aircraft performance database” (APD), which contains information concerning the performance of many aircraft’ types such as base of aircraft data (BADA). Based on their touchdown estimates and performance, and in order to find the best permutation, the algorithm organises aircraft in a decreasing ranking:
 $p\;:\;j \to p(j)$
, for
 $j \in \{ 1,2,3, \ldots ,n\} $
the landing sequence number of
 $Ap(j)$
aircraft. So the order of aircraft goes as:
 $\{ Ap(1),Ap(2), \ldots ,Ap(n)\} $
. Consequently
 $Ap(1)$
lands at:
 ${t_1} = tp(1)$
and
 $Ap(2)$
might land from
 ${t_2} = max({t_1} + 2min,tp(2))$
. The runway is ready to receive
 $Ap(2)$
after
 ${t_1} + 2min$
, this separation takes into account the liberation of the runway and the longitudinal separation on final approach and so on for the rest
 $Ap(j)$
.
6.2 The speed restriction algorithm (SRA)
We define
 $Ri = {t_i} - tp(i)$
as the aircraft
 $Ap(i)$
delay and i is the touchdown sequence number. It is clear that
 $R1 = 0$
as the aircraft
 $Ap(1)$
has no delay for landing.

These delays Ri will be stored to be used later in comparison studies. These flown distances in the two arcs:
 ${d_i}{,_1}$
and
 ${d_i}{,_2}$
will be stored to be used later in comparison studies.

6.3 The concept of speed adjustments
In the previous sections, we used the stored speeds from the APD, but in practice, ATCos can modify aircraft’ speeds in the approach area within approximately a range of
 $[\!-\!15\% ; +\!15\% ]$
. If the aircraft
 ${A_i}$
is the first to land and the aircraft
 ${A_j}$
is the final one, the crew of
 ${A_i}$
will be instructed to keep the highest speed they can do while the
 ${A_j}$
crew will be instructed to reduce to the lowest feasible speed. The aircraft’s type, weight, altitude and other factors affect its speed. In our proposed model, the stored speeds
 ${V_e}$
,
 ${V_i}$
and
 ${V_{app}}$
will be modified of
 $[\!-\!10\% ; +\!10\% ]$
range. Compared with the FCFS model and the speed restriction model, the gain of this procedure is enormous. For an aircraft Ai, it might arrive before its estimate computed touchdown time by the radar (according to the stored speeds in the database APD). This will also decrease the delay; moreover, in some scenarios the aircraft will touchdown before their
 ${t_i}$
(computed estimate touchdown time with speed restrictions).
6.4 Simulation
At a predetermined time, we will run our algorithm and generate the locations of randomised aircraft flying in from three areas (SIERA1, SIERA2, SIERA3). Randomly distributed speed profiles were generated.
A defined objective function to optimise and a particle-based study space are required in in order to use the PSO. The algorithm’s goal is to relocate these particles to their optimal location. Any particle has:
-
A location (i.e. particle coordinates).
-
A velocity at which the particle can move: each particle shifts position across iterations. It navigates based on its best neighbour, best position and past position.
-
A neighbourhood: a group of particles that directly influence a particle, particularly the one with the best criterion.
Every particle has instantaneously the knowledge of:
-
Its best visited location. The determined criterion’s value and its coordinates are essentially retained.
-
The location of the swarm’s ideal neighbour, as determined by the optimum sequencing.
-
The provided value to the objective function since after iterations a required comparison between the value of the given criterion by the current particle and the ideal value are made.
6.5 The speed adjustment algorithm SAA
The new speed is calculated utilising this equation:
 \begin{align}{V_{k + 1}} = {c_1}{V_k} + {c_2}(bestp - p) + {c_3}(bestv - p)\end{align}
Where:
-
${V_{k + 1}}$
and
${V_k}$
are the particle’s speeds at iterations
$k + 1$
and k.
-
bestp is the particle’s best position.
-
bestv is the particle neighbourhood’s best position at iteration k.
-
p is the particle’s position at iteration k.
-
${c_1}$
: a constant or dynamic coefficient throughout iterations.
-
${c_2}$
and
${c_3}$
: coefficients that are produced at random for each iteration.


Using the calculated speed, the particle’s future position can be identified as follow:
 \begin{align}{X_{k + 1}} = {X_k} + {V_{k + 1}}\end{align}
Where:
 ${X_k}$
is the particle’s position at iteration k.
 ${X_0}$
and
 ${V_0}$
are generated at the beginning of our algorithm. The computation of the percentages for each aircraft
 $Ap(i)$
for
 $i = 2, \ldots ,n$
is a minimisation problem described as:
 \begin{align}min|tvi(ai;\;bi;\;ci) - testvi|\end{align}
Under constraints:
 \begin{align*}10\% \le ai \le 10\% \\[5pt] 10\% \le bi \le 10\% \\[5pt] 10\% \le ci \le 10\% \end{align*}
with:
 \begin{align}tvi(ai;\;bi;\;ci) = {{A(p(i))} \over {(ai + 1){V_{p(i);1}}}} + {{15} \over {(bi + 1){V_{p(i);2}}}} + {{15} \over {(ci + 1){V_{p(i);3}}}} + {8 \over {{V_{p(i);4}}}} + {4 \over {{V_{p(i);5}}}}\end{align}
 \begin{align}testvi = testv(i - 1) + 2min.\end{align}
6.6 Delay computation
In this section, the optimisation will intercede in the delay’s calculation. The concept is identical to that of the earlier paragraphs. To obtain the permutation p, we will arrange aircraft in a performance descending sequence based on their estimates of touchdown.
 $Ap(1)$
will be instructed to accelerate to the maximum possible speed, therefore 10% will be added to the recorded speeds in the aircraft performance database APD. After that, the touchdown estimates will be modified taking into account the condition:
 $testv1 \lt tp(1)$
.
Then, to ensure that the aircraft
 $Ap(2)$
would land at:
 $testv2 \ge testv1 + 2min$
, we will determine the speeds’ percentages a, b and c in a 10%.
The same procedure will be repeated for each aircraft
 $Ap(i)$
respecting:
 \begin{align*}testvi \ge testv(i - 1) + 2min\end{align*}


After that, we will calculate the aircraft
 $Ap(i)$
delay Rvi after the modifications of speed:
 \begin{align*}Rvi = testvi - tp(i)\quad if\quad Rvi \gt 0.\end{align*}
If not, Rvi stands for the aircraft’s
 $Ap(i)$
gain. The associated speeds to the aircraft
 $Ap(i)$
are:

 $Vp(i);\;1 = {V_e}$
,
 $Vp(i);\;2 = {V_i}$
,
 $Vp(i);\;3 = {V_{app}}$
,
 $Vp(i);\;4 = {V_f}$
and
 $Vp(i);\;5 = {V_{ar}}$
.
 $A(p(i))$
is the position of the aircraft
 $Ap(i)$
in zone 1.
Distances computation
With the same concept in the past sections, to consume the delay in the arcs’ path, while we shall consider the modified calculated speeds in the delay section, with:
 \begin{align}fi({d_i}{,_1};\;{d_i}{,_2}) = {{{d_i}{,_1}} \over {(bi + 1)Vp(i),2}} + {{{d_i}{,_2}} \over {(ci + 1)Vp(i),3}}\end{align}
bi and ci are the speeds’ percentages of the aircraft
 $Ap(i)$
related in sequence with Vi and Vapp. Rvi is the aircraft
 $Ap(i)$
delay after speed adjustments. The new minimisation problem is:
 \begin{align}min\sum\limits_{i = 2}^n |fi({d_i}{,_1},{d_i}{,_2}) - Rvi|\end{align}
u.c:
 \begin{align*}{d_{i,1}} &\lt S1 - R2 \times \Theta j\\[5pt] {d_{i,2}} &\lt max\left(S2 - {R_1} \times {\Theta _j} - {{{d_{i,1}}} \over 2},{R_1} \times {\Theta _j} + {{{d_{i,1}}} \over 2}\right)\\[5pt] {d_{i,1}} &\lt {d_{i,2}}\\[5pt] {d_{i,1}} &\gt 0\\[5pt] {d_{i,1}} &\gt 0\end{align*}
7.0 Applications
In a decreasing performance order, we will arrange the aircraft to find the permutation p. Then, we will instruct the first aircraft
 $Ap(1)$
to accelerate to the maximum possible speed, after that we will add a 10% to its recorded speeds in the database APD.
Next step is updating the touchdown estimates with speeds’ adjustments:
 $testv1 \lt tp(1)$
.
Then we will proceed to the optimisation of the problem 15 to compute a, b and c the speeds’ percentages within
 $a \pm 10\% $
interval so that the aircraft
 $Ap(2)$
might land at:
 $testv2 \gt testv1 + 2min$
. The same process for the remaining aircraft
 $Ap(i)$
will be repeated with the condition:
 $testvi \gt testv(i - 1) + 2min$
. Once done, Rvi the aircraft Ap(i) delay after speeds’ adjustments will be computed as:
 $Rvi = testvi - tp(i)$
. In the case where
 $Rvi \gt 0$
, the crossed distances
 ${d_i}{;_1}$
and
 ${d_i}{;_2}$
respectively in the arcs
 $S1$
and
 $S2$
are computed for each aircraft
 $Ap(i)$
by minimising 23 under constraints 24 while incorporating the modified speeds.
7.1 Application for four aircraft (n = 4)
Table 1 description
-
A/ Aircraft
${A_i}$
: As a reference order, the descending order of speeds was chosen, with
${A_1}$
having the highest speed profile and
${A_4}$
having the lowest. -
B/ Aircraft position: Computing
$A(i)$
the position aircraft Ai in a circle of
$R3 = 30Nm$
which is the first zone with profile
$V(i)$


Four aircraft scenario application

A number ui has been selected at random within the interval
 $[0;1]$
(uniform law) for each aircraft Ai
-
If
$ui \lt 1/3$
, then
${A_i}$
is inbound from zone SIERA1, we put
$O(i) = 0$
. -
If
$1/3 \le ui \lt 2/3$
, the aircraft
${A_i}$
is inbound from zone SIERA2, we put
$O(i) = 1$
. -
If
$2/3 \le ui \le 1$
, then
${A_i}$
is inbound from zone SIERA3, we put
$O(i) = 2$
. -
C/ Associated zone (entrance side): As a result of this draw,
${A_1}$
is inbound from zone SIERA1,
${A_2}$
from SIERA2,
${A_3}$
from SIERA1, and
${A_4}$
from SIERA3. In order to remember this data, we must store it in a vector O, where the value of
$O(i)$
is either 0,1 or 2. -
D/ Touchdown estimates: Compute the touchdown estimates (in hours) for each
${A_i}$
in the order of reference. -
E/ Permutation p: Determine the ideal permutation p to reduce the delay (touchdown number based on the sequencing concept).
-
F/ Permutation q: Determine the permutation q (FCFS touchdown number).
-
G/ Touchdown estimates speed restriction: Compute the estimated landing time testi based on the sequencing concept (speed restrictions) with ti associated with
$Ap(i)$
. -
H/Touchdown estimates FCFS: Compute the touchdown estimate time tf based on the FCFS concept with tfi associated with
$Aq(i)$
. -
I/ Touchdown estimates speed adjustment: Compute the touchdown estimate testv based on the sequencing concept (speed adjusments) with testvi associated with
$Ap(i)$
, by computing the percentages of modified speeds associated to
$Ap(i)$
are: -
J & K/ Touchdown estimates speed adjustment: Delays computation for each
$Ap(i)$
, compute the delays Ri and Rvi (in hours) according to sequencing with speed restrictions and speed adjustments models.


Speed Modification:
In Tables 1 and 2 we found that the 10% addition to the speeds
 ${V_e}$
,
 ${V_i}$
and
 ${V_{app}}$
(stored in the database) to the aircraft
 ${A_1}$
was applied, the same for
 ${A_3}$
and
 ${A_4}$
. While for aircraft
 ${A_2}$
,
 ${V_e}$
was reduced by 10%,
 ${V_i}$
was reduced by 5% and
 ${V_{app}}$
was increased by 5%. The delays of the aircraft:
 ${A_1}$
,
 ${A_3}$
and
 ${A_4}$
have been reduced to zero; on the other hand the aircraft
 ${A_2}$
has a delay of
 $R2 = 1min45s$
. Sometimes, speed adjustments will allow us to land the aircraft before their estimated landing times, as for
 ${A_1}$
,
 ${A_3}$
, and
 ${A_4}$
.
Four aircraft scenario application percentages

Cumulative delays:
Compare cumulative delays according to FCFS, sequencing with speed restriction and speed adjustments:
-
$Rcf = 0.0469 \times 4 \times 60 = 11min15s$
(cumulative delay for FCFS).
-
$Rcs = 0.0073 \times 4 \times 60 = 1min45s$
(delay with speed restrictions).
-
$Rcv = - 0.0150 \times 4 \times 60 = - 3min36s$
(gain with speed adjustments).


The gain using sequencing with speed restriction is:
 \begin{align*}11min15s - 1min45s = 9min20min.\end{align*}
The gain using sequencing with speed adjustments is:
 \begin{align*}11min15s + 3min36s = 14min51s.\end{align*}
Flown and cumulative distances:
Aircraft are required to fly the maximum distance in the arc
 $S2(31.5NM)$
. For the flown distances:
for the model with speed restrictions;
in the case where:
 $Ri \times V(p(i);\;3) \lt 31.5$
, all the distance
 ${d_{i,1}}$
will be run on
 $S2$
.
in the case where:
 $Ri \times V(p(i);\;3) \ge 31.5$
,
 ${d_{i,1}} = 31.5$
will be run on
 $S2$
and the remained distance
 ${d_{i,2}}$
on
 $S1$
for the model with speed adjustments;
and the case where
 $Rvi \times (1 + ci)V(p(i);\;3) \lt 31.5$
: all the distance
 ${d_{i,1}}$
will be run on
 $S2$
and the case where
 $Rvi \times (1 + ci)V(p(i);\;3) \ge 31.5$
,
 ${d_{i,1}} = 31.5$
will be run on
 $S2$
and the remained distance
 ${d_{i,2}}$
on
 $S1$
where
 $V(p(i);\;3)$
is the
 ${V_{app}}$
of the aircraft
 $Ap(i)$
and (ci) is the percentage of the approaching speed
 $Ap(i)$
calculated by minimization.
Aircraft
 ${A_2}$
must cross
 $6.5Nm$
in the arc
 $S2$
.
In the speed adjustments’ model
 ${A_2}$
must cross
 $2Nm$
in the arc
 $S2$
.
We will compare the distances accumulated by each principle:
-
The cumulative distance in FCFS is
$64.5Nm$
. -
The cumulative distance with speed restrictions is
$6.4Nm$
. -
The cumulative distance with speed adjustments is
$2.17Nm$
.


7.2 Application for nine aircraft (n = 9)
With the same process of the previous section for four aircraft, the sequencing algorithm with speed adjustments SAA provides remarkable results in comparison with the algorithms FCFS and sequencing with speed restrictions SRA for the first nine aircraft.
Tables 3 and 4 resume the obtained results with nine aircraft:
Nine aircraft scenario application

Nine aircraft scenario application percentages

7.3 Application for thirty aircraft (n = 30)
In Mohammed the V airport TMA the instance arrival capacity does not usually exceed nine aircraft. In this section we are going to visualise the gain in the case of 30 aircraft on arrival partitioned in five groups: 4, 5, 6, 7 and 8 aircraft. (Other group partition is also possible.)
Cumulative distances as illustrated in Fig. 8:
-
The DCF vector represents the cumulative distances using the (FCFS) concept.
-
The DCS vector shows the cumulative distances using the speed restriction model SRA.
-
The DCV vector shows the cumulative distances with the speed adjustment model SAA.
Evolution of the cumulated distances in Nm.

Cumulative delays as illustrated in Fig. 9:
-
The RCF vector represents the cumulative delays using the (FCFS) concept.
-
The RCS vector shows the cumulative delays using the speed restriction model SRA.
-
The RCV vector shows the cumulative delays with the speed adjustment model SAA.
Evolution of cumulated delays in min of 30 aircrafts.

7.4 Graph interpretation
As shown in Table 5, the sum of the crossed distances by the 30 aircraft is:
-
$388.7NM$
using the FCFS model.
-
$43.5NM$
using the speed restriction model SRA.
-
$11.1NM$
using the speed adjustment model SAA.
-
The cumulative distance using SRA is 2% of the cumulative distance using FCFS.
-
The cumulative distance using SAA is 11% of the cumulative distance using FCFS.


Aircraft group cumulative distances

As shown in Table 6, the sum of the delays crossed by the 30 aircraft is:
-
$1h58min48s$
using the FCFS.
-
$17min47s$
using the speed restriction model SRA.
-
The sum of the gains is
$23min18s$
using the speed adjustment model SAA. The application of SAA allowed us to save
$2h22min6s$
compared to FCFS. The application of SRA allowed us to save
$1h41min1s$
compared to the FCFS.


Aircraft group cumulative delays

For our study case, the SAA algorithm is applicable for nine aircraft maximum at once due to the sum of the lengths of the two arcs, which is
 $94Nm$
. To increase the capacity of the SAA, we suggested adding another arc and passing to
 $7NM$
longitudinal separation instead of 10NM to handle more aircraft.
8.0 Conclusion
The purpose of this work is to help ATCos establish efficient inbound traffic sequences with a real-time decision tool. This support permit increasing the TMA capacity and enhancing the ATM by lessening the ATCos’ workload. Using real-time algorithms operating on the speed performance during the descent and approach phases, this tool proposes the maintain of a high level of safety while cutting down expenses.
The suggested approach offers outstanding outcomes and advantages that reduce costs in terms of flying time, flown distance, energy use and gas emissions.
The most successful method for reducing congestion for inbound traffic in the TMA is to efficiently control the flight profile and speed during the approach phase. However, there could be some other alternative approaches that can be used to better utilise the air resources and manage the air network.