


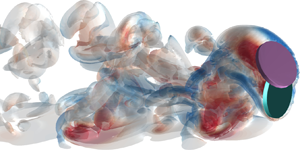

1. Introduction
Sedimentation of particles in a fluid is ubiquitous in industrial applications and environmental processes, such as industrial waste treatment, coal-water slurry transport, proppant transport in hydraulic cracking, soot particle dispersion, falling of leaves and settling of sand in a river. Understanding the falling patterns is helpful to predict particle trajectories and final locations of the settling particles. Unfortunately, the falling patterns are rather complex due to fluid–particle and particle–particle interactions. Thus, extensive studies have been performed to reveal the underlying mechanism of the particle sedimentation in a fluid.
Fortes, Joseph & Lundgren (Reference Fortes, Joseph and Lundgren1987) observed two spheres settling in a pattern of drafting-kissing-tumbling (DKT) in their experiments, demonstrating the strong hydrodynamic interactions between the particles. In the two-dimensional (2-D) numerical simulations of two circular particles falling in a long narrow channel (Aidun & Ding Reference Aidun and Ding2003), effects of confinement from the channel walls on dynamics of the particles are significant as the width of channel  ${L_w}$ is only four times the particle diameter
 ${d_p}$. The particle motion is driven by a dimensionless weight of a particle,
 ${W^\ast } = {\rm \pi}{G_a}({\rho _r} - 1)/4$, in which
 ${G_a}$ is the Galileo number (
 ${G_a} = d_p^3g/\nu _f^2$, g is the gravitational acceleration and
 ${\nu _f}$ is the kinematic viscosity of the fluid) and
 ${\rho _r}$ is the density ratio of particle to fluid. Under the channel boundary confinement of
 ${L_w}/{d_p} = 4$, the falling styles of the particles are controlled by the parameter
 ${W^\ast }$. An increase in
 ${W^\ast }$ from 100 to 200 leads to an increase in particle terminal Reynolds number Re from 2 to 5. In this regime, as
 ${W^\ast }$ increases, the initial periodic state of the horizontal particle motion transits to another periodic branch. Further increase in
 ${W^\ast }$ results in a cascade of period-doubling bifurcations to a chaotic state represented by a low dimensional chaotic attractor (Aidun & Ding Reference Aidun and Ding2003). For
 $200 < {W^\ast } < 400$, corresponding to 6 < Re < 10, the pair of particles fall in the DKT pattern (Feng & Joseph Reference Feng and Joseph1995). At the large driving forces, i.e.
 $400 < {W^\ast } < 500$, the two particles tend to form a horizontal structure, causing the maximum effective blockage ratio. The falling speeds are reduced and the particle Reynolds numbers return to the range 5 < Re < 7. Then, the DKT vanishes and the settling experiences a quasi-periodic transition to the chaotic state by increasing the driving force (Verjus et al. Reference Verjus, Guillou, Ezersky and Angilella2016). To estimate the particle–particle contact duration, a scaling law was proposed by Li et al. (Reference Li, Zhang, Wang and Wu2020), considering the effects of particle–fluid density ratio, fluid viscosity, interparticle friction, and adhesive force.
Various factors can affect the sedimentation patterns. After removing the rotational degrees of freedom of the particles, the lateral migration still occurred but the divergent particle oscillation disappeared, making the particles fall with a steady oblique or horizontal structure at smaller terminal Reynolds numbers (Zhang et al. Reference Zhang, Zhang, Pan and Haeri2018). Sedimentation of two unequal particles of different sizes and densities was numerically investigated (Nie & Lin Reference Nie and Lin2020; Nie, Guan & Lin Reference Nie, Guan and Lin2021). A pattern of horizontal oscillatory motion, characterized by a structure with a large and light particle above a small and heavy one and strong oscillations of both particles in the horizontal direction, was observed for diameter ratio of 0.3 at intermediate Reynolds numbers, and the magnitude of oscillations decreased with an increase in the density ratio (Nie et al. Reference Nie, Guan and Lin2021). In three-dimensional (3-D) sedimentation of two spheres of different densities in a square tube, the spheres oscillated in the central plane of the tube at high Galileo numbers  $({G_a})$; while at low
 ${G_a}$, the spheres moved to one of the diagonal planes of the tube, reaching a steady or periodic state depending on the density difference between them (Nie & Lin Reference Nie and Lin2020).
The sedimentation of particles in a fluid exhibits a strong dependence on particle shape. The simulation results by Fornari, Ardekani & Brandt (Reference Fornari, Ardekani and Brandt2018) showed that the mean settling speed of oblate particles was significantly higher than that of spheres in dilute suspensions at the solid volume fractions of 0.5–1 %, due to the formation of columnar-like clusters of the oblate particles. The early experimental observations of a single disk falling in a quiescent viscous fluid by Willmarth, Hawk & Harvey (Reference Willmarth, Hawk and Harvey1964) and Field et al. (Reference Field, Klaus, Moore and Nori1997) demonstrated the remarkable effect of particle shape, which was characterized by a dimensionless moment of inertia (the ratio of the moment of inertia of a thin disk about its diameter  ${I_d}$ and a quantity proportional to the moment of inertia of a rigid sphere of fluid about its diameter):
 \begin{equation}{I^\ast } = \frac{{{I_d}}}{{{\rho _f}d_c^5}} = \frac{{{\rm \pi}{\rho _s}{l_c}}}{{64{\rho _f}{d_c}}} + \frac{{{\rm \pi}{\rho _s}l_c^3}}{{48{\rho _f}d_c^3}},\end{equation}
in which  ${\rho _s}$ and
 ${\rho _f}$ are the densities of the solid disk and fluid, respectively; and
 ${l_c}$ and
 ${d_c}$ are the thickness and diameter, respectively, of the disk. For the very thin disks, the thickness
 ${l_c}$ is much smaller than
 ${d_c}$, thus, the second term, i.e.
 ${\rm \pi}{\rho _s}l_c^3/(48{\rho _f}d_c^3)$, on the right-hand side of the equal sign in (1.1) was neglected in the previous work (Willmarth et al. Reference Willmarth, Hawk and Harvey1964; Field et al. Reference Field, Klaus, Moore and Nori1997; Zhong, Chen & Lee Reference Zhong, Chen and Lee2011). The falling pattern was also dependent on the terminal Reynolds number Re of the disk, which was calculated from the mean vertical velocity of the disk during the sedimentation (excluding the initial acceleration stage). Based on
 ${I^\ast }$ and Re, Field et al. (Reference Field, Klaus, Moore and Nori1997) classified the falling processes of a single disk into four distinct styles: steady falling, periodic, chaotic and tumbling. A steady falling pattern occurred at low Re. At high Re, a disk with a smaller dimensionless moment of inertia
 ${I^\ast }$ settled periodically; as
 ${I^\ast }$ increased, the falling pattern transited from the periodic to the chaotic and then to the tumbling. With more experimental observations, Zhong et al. (Reference Zhong, Chen and Lee2011) partitioned the periodic falling pattern further into three sub-modes: planar zigzag, transitional and spiral. It was believed that the transition from the 2-D zigzag motion to the 3-D spiral motion occurred due to the growth of 3-D disturbances (Lee et al. Reference Lee, Su, Zhong, Chen, Zhou and Wu2013). In their numerical simulations, Auguste, Magnaudet & Fabre (Reference Auguste, Magnaudet and Fabre2013) observed two additional 3-D sedimentation patterns in which the disk experienced a slow horizontal precession superimposed on zigzagging or tumbling motions. For the infinitely thin disks with very small
 ${I^\ast }$, Chrust, Bouchet & Dušek (Reference Chrust, Bouchet and Dušek2013) created a comprehensive phase diagram of transition scenarios of the different settling types, based on the Galileo number and a dimensional mass. The hydrodynamics and typical nonlinear paths of various non-spherical bodies freely falling or rising in fluids were systematically reviewed by Ern et al. (Reference Ern, Risso, Fabre and Magnaudet2012).
The interaction of two identical disks falling in tandem in a fluid was experimentally investigated by Brosse & Ern (Reference Brosse and Ern2011, Reference Brosse and Ern2014). It was observed that the trailing body would catch up to the leading one for vertical separation distances up to 14 diameters under the condition of a horizontal separation distance less than 0.5 diameters. The wake of the leading body had an impact on the fluid drag force exerted on the trailing one, depending on the distance between them. Thick disks separated laterally after the collision and eventually fell side by side. At low Re of 115 and 152, thinner disks formed a steady Y-configuration by contacting each other and fell together in rectilinear paths as the wakes of the two bodies merged, creating strong interbody attraction. Such steady falling with a small relative inclination between the two bodies was also obtained in the numerical simulations of the sedimentation of two oblate ellipsoids (Ardekani et al. Reference Ardekani, Costa, Breugem and Brandt2016). At higher Re of 255 and 275, the thinner disks exhibited inclined periodic motions with the relative distance and inclination of the bodies fluctuating in time. The periodic vortex shedding played a role in the oscillatory motions of the two disks. In addition, the inhomogeneity of the wake of the leading body destabilized the wake of the trailing one, amplifying the oscillation of the trailing one. In the experiments of two identical disks falling side by side in a fluid at rest for Re ranging from 100 to 300 (Ern & Brosse Reference Ern and Brosse2014), the two disks repelled each other at the smaller horizontal separation distances and they appeared to move independently at the larger horizontal distances. In the case of oscillatory paths, no synchronization was observed between the paths and between the wakes of the two disks. A repulsion coefficient, which is proportional to the magnitude of repulsion force, was found to decrease with the horizontal separation distance and increase with the thickness-to-diameter ratio of the disks.
Compared to the sedimentation of a pair of circular particles (2-D) and spheres (3-D), the hydrodynamic behaviour of a pair of 3-D disks settling in a viscous fluid is much less understood. In this work, a lattice Boltzmann method (LBM) and a cylindrical particle discrete element method (DEM) are combined to simulate sedimentations of a pair of disks in a Newtonian viscous fluid for a comprehensive understanding of such processes. Corresponding physical experiments are also conducted to verify the simulation results and to complement the investigations. The disks of various dimensionless moments of inertia  ${I^\ast }$ are used in the simulations and experiments. The falling motions of the disks are analysed and classified for wide ranges of
 ${I^\ast }$ (0.006–0.14) and Re (5–1000). Phase diagrams are eventually drawn to determine falling patterns and contact styles of the two interactive disks based on
 ${I^\ast }$ and Re.
2. Methodology
In the coupled LBM-DEM method, the flow field is solved by the LBM, which was developed by Wang et al. (Reference Wang, Peng, Guo and Yu2016) based on the lattice Boltzmann method coupled with a proper treatment of the moving fluid–solid interface (Peng et al. Reference Peng, Teng, Hwang, Guo and Wang2016). The dynamics and interactions of the disks are modelled by the cylindrical particle DEM, which was implemented by Guo et al. (Reference Guo, Wassgren, Ketterhagen, Hancock, James and Curtis2012b). The momentum exchange method (Wen et al. Reference Wen, Zhang, Tu, Wang and Fang2014) is used to calculate the fluid–disk interaction forces with the disk surfaces treated as no-slip boundaries by an interpolated bounce-back scheme (Bouzidi, Firdaouss & Lallemand Reference Bouzidi, Firdaouss and Lallemand2001).
2.1. Lattice Boltzmann method
The multi-relaxation time (MRT) LBM (D'Humieres Reference D'Humieres2002) is used to solve the evolution of mesoscopic velocity distribution function:
 \begin{equation}\boldsymbol{f}(\boldsymbol{x}
+ {\boldsymbol{e}_\alpha }{\delta _t},t + {\delta _t}) =
\boldsymbol{f}(\boldsymbol{x},t) - {\boldsymbol{\mathsf{M}}^{ -
1}}\boldsymbol{\cdot }\boldsymbol{\mathsf{S}}\boldsymbol{\cdot
}[\boldsymbol{m} - {\boldsymbol{m}^{(eq)}}] +
\boldsymbol{Q}{\delta
_t},\end{equation}
where  $\boldsymbol{f}$ is the particle distribution function for the discrete velocity
 ${\boldsymbol{e}_\alpha }$ in the
 $\alpha \textrm{th}$ direction at the position
 $\boldsymbol{x}$ and time t,
 ${\delta _t}$ is the lattice time step,
 $\boldsymbol{\mathsf{M}}$ is an orthogonal transformation matrix that relates the distribution function
 $\boldsymbol{f}$ and moment space
 $\boldsymbol{m}$ as
 $\boldsymbol{m} = \boldsymbol{\mathsf{M}}\boldsymbol{\cdot }\boldsymbol{f}$ and
 $\boldsymbol{f} = {\boldsymbol{\mathsf{M}}^{ - 1}}\boldsymbol{\cdot }\boldsymbol{m}$,
 ${\boldsymbol{m}^{(eq)}}$ represents the equilibrium distribution of the moment space
 $\boldsymbol{m}$, and
 $\boldsymbol{\mathsf{S}}$ is the diagonal relaxation matrix which specifies relaxation rates for non-conservative moments. Forcing field
 $\boldsymbol{Q}$ (Guo, Zheng & Shi Reference Guo, Zheng and Shi2002) applies a body force to the fluid and the
 $\alpha \textrm{th}$ component of
 $\boldsymbol{Q}$ is calculated as
 \begin{equation}{Q_\alpha } = {\omega _\alpha }\left[ {\frac{{{\boldsymbol{e}_\alpha }\boldsymbol{\cdot }\boldsymbol{F}}}{{c_s^2}} + \frac{{\boldsymbol{Fu}:({\boldsymbol{e}_\alpha }{\boldsymbol{e}_\alpha } - c_s^2\boldsymbol{\mathsf{I}})}}{{c_s^4}}} \right],\end{equation}
in which  ${\omega _\alpha }$ represents a weight coefficient along the αth direction,
 $\boldsymbol{F}$ is an external force vector,
 $\boldsymbol{u}$ is the macroscopic fluid velocity vector, the sound speed
 ${c_s}$ is equal to
 $1/\sqrt 3 $ in lattice unit and
 $\boldsymbol{\mathsf{I}}$ is an identity matrix.
Fluid density  $\rho $, pressure
 $p$ and velocity vector
 $\boldsymbol{u}$ are the macroscopic variables, which can be obtained from the mesoscopic distribution function
 $\boldsymbol{f}$. For the incompressible flows, they have the forms (He & Luo Reference He and Luo1997)
 \begin{equation}\rho = {\rho _0} + \delta \rho ,\end{equation}
in which
 \begin{gather} {\rho _0} = 1\quad \textrm{and}\quad \delta \rho = \sum\limits_\alpha {{f_\alpha }} ,\end{gather}
 \begin{gather}p = \delta \rho c_s^2,\end{gather}
 \begin{gather}{\rho _0}\boldsymbol{u} = \sum\limits_\alpha {{f_\alpha }{\boldsymbol{e}_\alpha }} + \frac{{{\delta _t}}}{2}{\rho _0}\boldsymbol{F}.\end{gather}
As shown in figure 1, the 19-velocity model in three dimensions, i.e. the D3Q19 model, is adopted for the discrete velocities, which are written as
 \begin{equation}{\boldsymbol{e}_\alpha }
= \left\{\begin{array}{@{}l@{\quad}l} {(0,0,0)}&{\alpha =
0,}\\ {({\pm} 1,0,0),(0, \pm 1,0),(0,0,
\pm 1)}&{\alpha = 1,2, \ldots ,6,}\\
{({\pm} 1, \pm 1,0),({\pm} 1,0, \pm 1),(0, \pm 1, \pm
1)}&{\alpha = 7,8, \ldots ,18.} \end{array}
\right.\end{equation}
Thus, the weight coefficient  ${\omega _\alpha }$ is determined as
 \begin{equation}{\omega _\alpha } =
\left\{\begin{array}{@{}cc} {1/3,}&{e_\alpha^2 =
0}\\ {1/18,}&{e_\alpha^2 =
1}\\ {1/36,}&{e_\alpha^2 = 2}
\end{array}\right..\end{equation}
The expressions of  $\boldsymbol{\mathsf{M}}$,
 $\boldsymbol{m}$,
 ${\boldsymbol{m}^{(eq)}}$ and
 $\boldsymbol{\mathsf{S}}$ of the D3Q19 model are provided in the work by Wang et al. (Reference Wang, Peng, Guo and Yu2016).
An illustration of the D3Q19 model.

2.1.1. No-slip boundary condition
The no-slip condition on solid surfaces is crucial for interface-resolved particle-laden flow simulations. In the present LBM, an interpolated bounce-back scheme of second-order accuracy, proposed by Bouzidi et al. (Reference Bouzidi, Firdaouss and Lallemand2001), is used to account for the no-slip boundaries. As shown in figure 2,  ${\boldsymbol{x}_w}$ is the location where a boundary link intercepts with the solid surface, and
 ${\boldsymbol{x}_f}$ and
 ${\boldsymbol{x}_b}$ are the locations of two lattice nodes on the opposite sides of the solid boundary. The solid boundary location is described by
 $q = |{\boldsymbol{x}_f} - {\boldsymbol{x}_w}|/|{\boldsymbol{x}_f} - {\boldsymbol{x}_b}|$. When
 $q \le 0.5$, the distribution function at
 ${\boldsymbol{x}_r}$ (located between
 ${\boldsymbol{x}_f}$ and
 ${\boldsymbol{x}_{ff}}$) is first interpolated and then streamed exactly to
 ${\boldsymbol{x}_f}$ after bouncing back from the wall for a total distance of a lattice grid size
 ${\delta _x}$ in a single time step
 ${\delta _t}$, as shown in figure 2(a). Therefore, the velocity distribution function at the boundary node is updated using a linear-interpolation scheme:
 \begin{equation}{f_\alpha }({\boldsymbol{x}_f},t + {\delta _t}) = 2qf_{\bar{\alpha }}^\ast ({\boldsymbol{x}_f},t) + (1 - 2q)f_{\bar{\alpha }}^\ast ({\boldsymbol{x}_{ff}},t) + 2{\rho _0}{\omega _\alpha }\frac{{{\boldsymbol{e}_\alpha }\boldsymbol{\cdot }{\boldsymbol{u}_w}}}{{c_s^2}},\end{equation}
or a quadratic-interpolation one:
 \begin{equation}\begin{array}{ccccc} {f_\alpha }({\boldsymbol{x}_f},t + {\delta _t}) & = q(2q + 1)f_{\bar{\alpha }}^\ast ({\boldsymbol{x}_f},t) + (1 + 2q)(1 - 2q)f_{\bar{\alpha }}^\ast ({\boldsymbol{x}_{ff}},t)\\ & \quad - q(1 - 2q)f_{\bar{\alpha }}^\ast ({\boldsymbol{x}_{fff}},t) + 2{\rho _0}{\omega _\alpha }\dfrac{{{\boldsymbol{e}_\alpha }\boldsymbol{\cdot }{\boldsymbol{u}_w}}}{{c_s^2}}, \end{array}\end{equation}
where  ${f_\alpha }$ and
 $f_{\bar{\alpha }}^\ast $ are the bounce-back distribution function and incident distribution function, respectively, with
 ${\boldsymbol{e}_\alpha } ={-} {\boldsymbol{e}_{\bar{\alpha }}}$, and
 ${\boldsymbol{u}_w}$ is the velocity at the wall location
 ${\boldsymbol{x}_w}$. When
 $q > 0.5$, as shown in figure 2(b), the distribution function at
 ${\boldsymbol{x}_f}$ is first streamed to
 ${\boldsymbol{x}_r}$ (located between
 ${\boldsymbol{x}_f}$ and
 ${\boldsymbol{x}_w}$) after bouncing back from the wall, then an interpolation is performed to obtain
 ${f_\alpha }({\boldsymbol{x}_f},t + {\delta _t})$, yielding a linear scheme:
 \begin{equation}{f_\alpha }({\boldsymbol{x}_f},t + {\delta _t}) = \frac{1}{{2q}}\left[ {f_{\bar{\alpha }}^\ast ({\boldsymbol{x}_f},t) + 2{\rho_0}{\omega_\alpha }\frac{{{\boldsymbol{e}_\alpha }\boldsymbol{\cdot }{\boldsymbol{u}_w}}}{{c_s^2}}} \right] + \frac{{(2q - 1)}}{{2q}}{f_\alpha }({\boldsymbol{x}_{ff}},t + {\delta _t}),\end{equation}
or a quadratic one:
 \begin{equation}\begin{array}{ccccc} {f_\alpha }({\boldsymbol{x}_f},t + {\delta _t}) & = \dfrac{1}{{q(2q + 1)}}\left[ {f_{\bar{\alpha }}^\ast ({\boldsymbol{x}_f},t) + 2{\rho_0}{\omega_\alpha }\dfrac{{{\boldsymbol{e}_\alpha }\boldsymbol{\cdot }{\boldsymbol{u}_w}}}{{c_s^2}}} \right] + \dfrac{{2q - 1}}{q}{f_\alpha }({\boldsymbol{x}_{ff}},t + {\delta _t})\\ & \quad - \dfrac{{2q - 1}}{{1 + 2q}}{f_\alpha }({\boldsymbol{x}_{fff}},t + {\delta _t}). \end{array}\end{equation}
If the three fluid nodes  ${\boldsymbol{x}_f}$,
 ${\boldsymbol{x}_{ff}}$ and
 ${\boldsymbol{x}_{fff}}$ are all available, the quadratic-interpolation schemes ((2.10) and (2.12)) are used. If only two fluid nodes
 ${\boldsymbol{x}_f}$ and
 ${\boldsymbol{x}_{ff}}$ exist (
 ${\boldsymbol{x}_{fff}}$ is absent or separated from
 ${\boldsymbol{x}_{ff}}$ by a solid boundary), the linear schemes ((2.9) and (2.11)) should be invoked.
Bounce-back scheme for the no-slip boundary condition near a solid wall.

2.1.2. Force evaluation
Based on the work by Ladd (Reference Ladd1994), Wen et al. (Reference Wen, Zhang, Tu, Wang and Fang2014) proposed a Galilean invariant momentum exchange method (GIMEM) to calculate hydrodynamic force  ${\boldsymbol{F}_H}$ and torque
 ${\boldsymbol{T}_H}$ exerted on a solid object in a fluid:
 \begin{gather}{\boldsymbol{F}_H}{\delta _t} = \sum\limits_{{\boldsymbol{x}_f},\alpha } {[f_{\bar{\alpha }}^\ast ({\boldsymbol{x}_f},t)({\boldsymbol{e}_{\bar{\alpha }}} - {\boldsymbol{u}_w}) - {f_\alpha }({\boldsymbol{x}_f},t + {\delta _t})({\boldsymbol{e}_\alpha } - {\boldsymbol{u}_w})]} ,\end{gather}
 \begin{gather}{\boldsymbol{T}_H}{\delta _t} = \sum\limits_{{\boldsymbol{x}_f},\alpha } {({\boldsymbol{x}_w} - {\boldsymbol{x}_c}) \times [f_{\bar{\alpha }}^\ast ({\boldsymbol{x}_f},t)({\boldsymbol{e}_{\bar{\alpha }}} - {\boldsymbol{u}_w}) - {f_\alpha }({\boldsymbol{x}_f},t + {\delta _t})({\boldsymbol{e}_\alpha } - {\boldsymbol{u}_w})]} ,\end{gather}
in which  ${\boldsymbol{x}_c}$ is the position of mass centre of the solid object. The summation is performed over all boundary links
 $\alpha $ and all boundary nodes
 ${\boldsymbol{x}_f}$.
In the present LBM simulations, the solid disks move within the fixed lattice grids. Thus, when a grid node is uncovered as the solid moves, proper initial distribution functions should be assigned to this node to ensure that the flow is properly defined at the new fluid node. An ‘equilibrium plus non-equilibrium’ refilling scheme originally proposed by Caiazzo (Reference Caiazzo2008) is used in the present work. In this refilling scheme, the distribution functions at a newly uncovered node  ${\boldsymbol{x}_{uc}}$ are partitioned into the equilibrium and non-equilibrium parts:
 \begin{equation}{f_\alpha }({\boldsymbol{x}_{uc}},t + {\delta _t}) = f_\alpha ^{(eq)}({\boldsymbol{u}_w},\overline {\delta \rho } ) + f_\alpha ^{(neq)}({\boldsymbol{x}_{uc}} + {\boldsymbol{e}_c}{\delta _t},t + {\delta _t}).\end{equation}
The equilibrium part  $f_\alpha ^{(eq)}$ is obtained from the local wall velocity
 ${\boldsymbol{u}_w}$ and the average density fluctuation of available neighbouring fluid nodes
 $\overline {\delta \rho } $. The non-equilibrium term
 $f_\alpha ^{(neq)}$ is determined as the non-equilibrium part from the neighbouring node
 ${\boldsymbol{x}_{uc}} + {\boldsymbol{e}_c}{\delta _t}$, in which
 ${\boldsymbol{e}_c}$ is the lattice direction giving the minimum value of
 $({\boldsymbol{e}_c}\boldsymbol{\cdot }\boldsymbol{n})/(|{\boldsymbol{e}_c}||\boldsymbol{n}|)$ and
 $\boldsymbol{n}$ is the outer normal vector on the solid surface from where the new fluid node is uncovered. According to the comparative studies among different refilling schemes (Peng et al. Reference Peng, Teng, Hwang, Guo and Wang2016), the present ‘equilibrium plus non-equilibrium’ refilling scheme performed well in computational efficiency and numerical stability.
As two solid cylindrical objects come close to each other with a small gap between them, the lattice grids are not sufficiently fine to resolve the fluid dynamics within the gap. Thus, the lubrication force model proposed by Brändle de Motta et al. (Reference Brändle de Motta, Breugem, Gazanion, Estivalezes, Vincent and Climent2013) is used to calculate the additional hydrodynamic forces exerted on the cylinders due to the squeezed thin fluid layer:
 \begin{equation}F_L^{ij}(\varepsilon ) ={-} 6{\rm \pi}{\mu _f}{R^\ast }{v_n}[\lambda (\varepsilon ) - \lambda ({\varepsilon _0})],\end{equation}
in which  ${\mu _f}$ is the fluid viscosity and
 ${v_n}$ is the normal component of the relative velocity between the two cylinders at the approaching point. The effective solid size
 ${R^\ast } = R_c^iR_c^j/(R_c^i + R_c^j)$, in which
 $R_c^i$ and
 $R_c^j$ are the characteristic sizes of the two cylinders defined as the minimum value between the radius
 ${r_c}$ and the half-length
 ${l_c}/2$ of the cylinder, i.e.
 ${R_c} = \textrm{MIN(}{r_c}, {l_c}/2\textrm{)}$. For the collision between a cylinder and a planar wall, the effective solid size is equal to the characteristic size of the cylinder
 ${R^\ast } = R_c^i$. The asymptotic functions
 $\lambda (\varepsilon )$, in which
 $\varepsilon = {\delta _{gap}}/{R_c}$ and
 ${\delta _{gap}}$ is the gap size between two approaching cylinders, have different forms for the cylinder–cylinder and cylinder–wall interactions (Brändle de Motta et al. Reference Brändle de Motta, Breugem, Gazanion, Estivalezes, Vincent and Climent2013):
 \begin{gather}\textrm{cylinder--cylinder:}\ \lambda (\varepsilon ) = \frac{1}{{2\varepsilon }} - \frac{9}{{20}}\ln \varepsilon - \frac{3}{{56}}\varepsilon \ln \varepsilon + 1.346,\end{gather}
 \begin{gather}\textrm{cylinder--wall:}\ \lambda (\varepsilon ) = \frac{1}{\varepsilon } - \frac{1}{5}\ln \varepsilon - \frac{1}{{21}}\varepsilon \ln \varepsilon + 0.9713.\end{gather}
As shown in figure 3, three critical scaled gap sizes,  ${\varepsilon _0}$,
 ${\varepsilon _1}$ and
 ${\varepsilon _2}$, are defined. The lubrication force is invoked when
 $\varepsilon < {\varepsilon _0}$. The lubrication force
 $F_L^{ij}(\varepsilon )$ is calculated using (2.16) and ((2.17a) or (2.17b)) when
 ${\varepsilon _1} < \varepsilon < {\varepsilon _0}$, and it is constant and equal to the value at
 $\varepsilon = {\varepsilon _1}$, i.e.
 $F_L^{ij}(\varepsilon ) = F_L^{ij}({\varepsilon _1})$, when
 $0 \le \varepsilon \le {\varepsilon _1}$. Solid–solid contact between the two cylinders occurs when
 $\varepsilon < 0$, then the solid–solid contact force
 $F_{ss}^{ij}$ should be considered:
 \begin{gather}F_{ss}^{ij} ={-} {k_n}|{\delta _{gap}}|- {\beta _n}{v_n},\end{gather}
 \begin{gather}{k_n} ={-} \frac{{{m_e}({{\rm \pi}^2} + {{(\ln {e_d})}^2})}}{{{{({N_c}{\delta _t})}^2}}},\end{gather}
 \begin{gather}{\beta _n} ={-} \frac{{2{m_e}(\ln {e_d})}}{{({N_c}{\delta _t})}},\end{gather}
where  ${m_e} = {m_i}{m_j}/({m_i} + {m_j})$ for the cylinder–cylinder collision and
 ${m_e} = {m_i}$ for the cylinder–wall collision with the masses of the cylinders
 ${m_i}$ and
 ${m_j}$. The coefficient of restitution is specified as
 ${e_d} = 0.97$, and
 ${N_c}{\delta _t}$ represents the contact duration in which
 ${N_c}$ is set to 8 in the present simulations, as suggested by Brändle de Motta et al. (Reference Brändle de Motta, Breugem, Gazanion, Estivalezes, Vincent and Climent2013). The interaction force is calculated as a sum of the solid–solid contact force
 $F_{ss}^{ij}$ and lubrication force
 $F_L^{ij}({\varepsilon _1})$ when
 ${\varepsilon _2} \le \varepsilon < 0$, and only the solid–solid contact force exists when
 $\le {\varepsilon _2}$. In the present simulations, the three critical gap sizes
 ${\varepsilon _0}$,
 ${\varepsilon _1}$ and
 ${\varepsilon _2}$ are specified as 0.125, 0.001 and −0.005, respectively, for the cylinder–cylinder contact, and 0.15, 0.001 and −0.005, respectively, for the cylinder–wall contact. It is noted that the lubrication force models represented by (2.16) and (2.17a,b), which were originally calibrated for the sphere–sphere and sphere–wall interactions, are used for the interactions involving the cylinders in the present work. The effect of this approximate treatment is considered small, because the magnitudes of the lubrication forces are much smaller than those of resolved hydrodynamic forces, as illustrated below by the results in § 5.
Multilayer lubrication force model for two contacting cylindrical objects.

2.2. DEM for cylindrical particles
The code of the cylindrical particle DEM used in the present study was originally developed by Guo et al. (Reference Guo, Wassgren, Ketterhagen, Hancock and Curtis2012a,Reference Guo, Wassgren, Ketterhagen, Hancock, James and Curtisb). The translational and rotational motion of an individual cylinder i is governed by Newton's second law of motion:
 \begin{equation}{m_i}\frac{{\textrm{d}{\boldsymbol{v}_i}}}{{\textrm{d}t}} = \boldsymbol{F}_H^i + \boldsymbol{F}_L^i + \boldsymbol{F}_{ss}^i + {m_i}\boldsymbol{g},\end{equation}
and
 \begin{equation}{\boldsymbol{I}_i}\boldsymbol{\cdot }\frac{{\textrm{d}{\boldsymbol{\omega }_i}}}{{\textrm{d}t}} - ({\boldsymbol{I}_i}\boldsymbol{\cdot }{\boldsymbol{\omega }_i}) \times {\boldsymbol{\omega }_i} = \boldsymbol{T}_H^i + \boldsymbol{T}_L^i + \boldsymbol{T}_{ss}^i,\end{equation}
in which  ${\boldsymbol{v}_i}$ and
 ${\boldsymbol{\omega }_i}$ are the translational and angular velocities, respectively, of the cylinder, and their derivatives with respect to the time t give the corresponding accelerations. The translational movement of the cylinder of mass
 ${m_i}$ is driven by a combination of the hydrodynamic force
 $\boldsymbol{F}_H^i$, lubrication force
 $\boldsymbol{F}_L^i$, solid–solid contact force
 $\boldsymbol{F}_{ss}^i$ and the gravitational force
 ${m_i}\boldsymbol{g}$. The rotation of the cylinder is propelled by a sum of torques
 $\boldsymbol{T}_H^i$,
 $\boldsymbol{T}_L^i$ and
 $\boldsymbol{T}_{ss}^i$, arising from the hydrodynamic force, lubrication force and solid–solid contact force, respectively. For the three-dimensional non-spherical objects,
 ${\boldsymbol{I}_i}$ represents the moment of inertia tensor. The evolution of velocities, positions and orientations of the objects can be obtained by the time integration of (2.21) and (2.22) using a central finite difference scheme with a fixed time step.
In the DEM simulations, several typical cylinder–cylinder contact types were recognized by Kodam et al. (Reference Kodam, Bharadwaj, Curtis, Hancock and Wassgren2010), as shown in figure 4. In the present work, the contact detection algorithms are proposed to determine the gap size  ${\delta _{gap}}$, contact normal direction and contact point position for each contact scenario, following the previous work by Kodam et al. (Reference Kodam, Bharadwaj, Curtis, Hancock and Wassgren2010) and Guo et al. (Reference Guo, Wassgren, Ketterhagen, Hancock and Curtis2012a). Thus, the lubrication force
 $\boldsymbol{F}_L^i$, solid–solid contact force
 $\boldsymbol{F}_{ss}^i$, and the two torques
 $\boldsymbol{T}_L^i$ and
 $\boldsymbol{T}_{ss}^i$ due to
 $\boldsymbol{F}_L^i$ and
 $\boldsymbol{F}_{ss}^i$ can be calculated.
Typical cylinder–cylinder contact types considered in the DEM simulations (Kodam, et al. Reference Kodam, Bharadwaj, Curtis, Hancock and Wassgren2010; Guo et al. Reference Guo, Wassgren, Ketterhagen, Hancock and Curtis2012a).

2.3. Validation of the LBM-DEM code
Four sets of simulations are performed and analysed using the developed LBM-DEM code. First, the sedimentations of a single disk of aspect ratio AR = 0.1 and dimensionless moment of inertia  ${I^\ast } = 5.97 \times {10^{ - 3}}$ at various particle terminal Reynolds numbers Re are simulated. The
 $AR$ of a disk is defined as the ratio of the thickness
 ${l_c}$ to the diameter
 ${d_c}$ of the disk, i.e.
 $AR = {l_c}/{d_c}$. In the simulations, steady, transitional and periodic falling patterns are sequentially obtained as Re increases. The simulations are consistent with the previous experimental observations by Field et al. (Reference Field, Klaus, Moore and Nori1997). Second, the drag coefficients of the disk (AR = 0.1) falling in a fluid at a range of particle terminal Reynolds numbers Re from 10 to 400 are obtained from the present simulations. The simulation results are in good agreement with the predictions by Clift, Grace & Weber (Reference Clift, Grace and Weber1978), which were determined by the extensive experimental results. Third, fluid flows around a cylinder (AR = 5) fixed at a specified position are simulated. As the cylinder Reynolds number is specified as Re = 300, the lift and torque coefficients of the cylinder at various orientational angles (or attack angles) are compared with the previous simulation results by Zastawny et al. (Reference Zastawny, Mallouppas, Zhao and Wachem2012). Also, good agreement is achieved. Fourth, a simulation of two disks falling in tandem is performed and compared with the existing experimental results by Brosse & Ern (Reference Brosse and Ern2011). The details about the LBM-DEM code validation and the definitions of the Reynolds numbers are provided in Appendix A.
In addition, the contact detection algorithms and contact force models for the cylinder–cylinder and cylinder–wall interactions were validated in our previous work by modelling the cylindrical particle packings in a container (Tangri, Guo & Curtis Reference Tangri, Guo and Curtis2017) and the hopper flows (Tangri, Guo & Curtis Reference Tangri, Guo and Curtis2019).
3. Computational set-up of the sedimentation of two interacting disks
A 3-D rectangular computational domain of dimensions  ${L_x} = {L_z} = 300$ (lattice unit or LU) and
 ${L_y} = 1200$ (LU) is created, as shown in figure 5(a). Two identical disks of the equivalent volume sphere diameter
 ${d_{eq}}$ are placed in tandem at the positions of the coordinates (
 ${L_x}/2$,
 ${L_y} - {d_1}$,
 ${L_z}/2$) and (
 ${L_x}/2$,
 ${L_y} - {d_1} - {d_2}$,
 ${L_z}/2$), respectively. The clearance to the top boundary is specified as
 ${d_1} = 6.27{d_{eq}}$. The initial distance between the centres of the two disks
 ${d_2}$ (figure 5a) and the initial inclination angle
 ${\theta _0}$, which is the angle between the major axis of a disk and the y axis (figure 5b), are varied to understand the effects of the initial conditions of the disk release. Four different aspect ratios (AR = 0.1, 0.4, 0.7 and 1), defined as the ratio of the thickness
 ${l_c}$ to the diameter
 ${d_c}$ of the disk, are used in the present simulations to examine the effect of disk shape on the falling dynamics. All the disks have the same volume and the equivalent volume sphere diameter is assigned as
 ${d_{eq}} = 31.88$ (LU). The densities of fluid and cylinders are assigned as
 ${\rho _f} = 1$ and
 ${\rho _s} = 1.2$, respectively. The dimensionless moments of inertia
 ${I^\ast }$, which can be calculated for the disks using (1.1), are listed in table 1. The ratios of the moment of inertia of the disk about its axis of symmetry
 ${I_l}$ and the moment of inertia of the same disk about its diameter
 ${I_d}$ are also shown in table 1. A ratio of
 ${I_l}/{I_d}$ reflects the relative significance of the inertia rotating about the axis of symmetry to that about a diameter for a disk.
(a) Computational domain of two disks falling in a viscous fluid and (b) an illustration of the initial angle between the major axis of a disk and the vertical direction y.

Moments of inertia of the disks used in the simulations.

No-slip wall boundary conditions are specified in the x and z directions. Periodic boundary conditions are used in the y direction for the modelling of the disks falling in a very deep tank. The fluid and two disks are initially at rest and sedimentation starts when constant downward body forces are exerted on the disks. The disks settle at different terminal velocities by adjusting the fluid viscosity. In the present simulations, the confinement effects of solid wall boundaries are minimized by using a sufficiently large domain. The size ratio of  ${L_x}/{d_{eq}}$ and
 ${L_z}/{d_{eq}}$ is set to approximately 9.4, resulting in nearly the same results of settling paths and rotation of the disks as using a wider domain of the ratio
 ${L_x}/{d_{eq}} = {L_z}/{d_{eq}} = 18.8$. The effect of height
 ${L_y}$, the distance between two periodic boundaries, is examined by increasing the ratio
 ${L_y}/{d_{eq}}$ from 37.6 to 75.3 for the simulations with
 ${I^\ast } = 5.97 \times {10^{ - 3}}$ and Re = 600, and nearly the same results are obtained. Thus, a smaller domain of
 ${L_x}/{d_{eq}} = {L_z}/{d_{eq}} = 9.4$ and
 ${L_y}/{d_{eq}} = 37.6$ is used in most of the present simulations for a lower computational cost. The sensitivity to the grid resolution has been examined by doubling the present grid resolution, and almost the identical simulation results are obtained.
4. Experimental set-up of the sedimentation of two interactive disks
Physical experiments of two interacting disks falling in a fluid are conducted to provide additional results for a better understanding of sedimentation behaviour and to validate the present simulation results. Six types of disks with different sizes (diameter  ${d_c}$ and thickness
 ${l_c}$) and AR, as listed in table 2, are used in the experiments. The disks, made of acrylic of density
 ${\rho _s} = 1.2\ \textrm{g}\ \textrm{c}{\textrm{m}^{ - 3}}$, are manufactured using a laser cutting machine. To achieve different settling Reynolds numbers, various solutions of glycerol in water with different viscosities are employed, as shown in table 3.
Geometric properties of six types of disks.

Properties of three solutions at the temperature of 20 °C.

The experiments are conducted at the room temperature of 20 °C. At the beginning, two identical disks are held by a single clamp and are fully immersed in the stationary liquid inside a tank of 200 × 2000 × 200 mm3. The initial positions and orientations of the two disks are the same as those specified in the present numerical simulations. The clamp opens slowly and slightly to release the two disks simultaneously, minimizing flow perturbations. The two disks then settle in the liquid under the effect of gravitational force. The falling processes of the disks are recorded by cameras, and the videos are analysed by a MATLAB® code to determine the positions and settling speeds of the disks. In the present experiments, at least three runs are conducted for a specified set of control parameters.
5. Results and discussion
To understand the sedimentation process, we analyse the horizontal drifting displacements, orientation and hydrodynamic forces of the two disks. The orientation of a disk can be described by a pitch angle  $\theta $ and a yaw
 $\phi $. A shown in figure 6(a), the pitch angle
 $\theta $ is the angle from the vertical y axis to the line l’, which is the projection of the major axis of the disk (l) onto the y–z plane, and the yaw angle
 $\phi $ is the angle from l′ to l.
Illustration of (a) pitch angle  $\theta $ and yaw angle
 $\phi $ of a disk and (b) hydrodynamic force components in the direction of the vector connecting the two centres of the disks.

The hydrodynamic forces exerted on the disks by the surrounding fluid play a critical role in the contacts between the disks. For a better understanding of such hydrodynamic contributions to the disk–disk contacts, the components of the hydrodynamic forces in the direction of the vector connecting the mass centres of the two disks are examined. As illustrated in figure 6(b), the hydrodynamic force component  $F_H^{{\ast} i}$ can be written as
 \begin{equation}F_H^{{\ast} i} = \frac{{\boldsymbol{F}_H^i\boldsymbol{\cdot }{\boldsymbol{n}_{ji}}}}{{({\rho _s} - {\rho _f})g{V_d}}}\quad (i,j = 1, 2),\end{equation}
in which 1 and 2 represent the trailing disk and leading disk, respectively,  $\boldsymbol{F}_H^i$ is the hydrodynamic force vector acting on the disk i, which is calculated using (2.13), and
 ${\boldsymbol{n}_{ji}}$ is the unit branch vector from the mass centre of the disk j to that of the disk i. The dot product is normalized by the gravitational force term
 $({\rho _s} - {\rho _f})g{V_d}$, in which
 ${V_d}$ is the volume of a disk and g is the gravitational acceleration. Thus, the positive and negative values of
 $F_H^{{\ast} i}$ contribute to the separation and approaching, respectively, of the two disks.
In the falling, the disks accelerate from zero velocity to a terminal state, in which the vertical component of the disk velocity  ${u_y}$ fluctuates around a time-average value (see figure 11). Thus, the Reynolds number is defined as
 \begin{equation}Re = \frac{{{u_l}{d_{eq}}}}{{{\nu _f}}},\end{equation}
in which  ${u_l}$ is the time-average vertical velocity of the leading disk (in the lower position) at the terminal state,
 ${d_{eq}}$ is the equivalent volume sphere diameter and
 ${\nu _f}$ is the kinematic viscosity of the fluid.
The present disk-surface-resolved direct numerical simulation (DNS) and experimental results show that the dynamics of two closely arranged flat disks in the sedimentation are remarkably different from that of two spheres, attributed to the effect of the object shape. Further analyses reveal that the falling patterns are determined by a combination of disk shape (characterized by a dimensionless moment of inertia  ${I^\ast }$) and
 $Re$, as a result of complex multiphase flows involving disk–fluid and disk–disk interactions.
5.1. Effects of initial conditions
The effects of the initial disk inclination angle  ${\theta _0}$ and distance between mass centres of the two disks
 ${d_2}$ (see figure 5a) have been examined and the results are shown in figures 7 and 8. The dimensionless horizontal displacement of a disk is expressed as
 ${Z^\ast } = z/{d_{eq}}$, in which z is the z-displacement of the disk. The evolution of
 ${Z^\ast }$ and the pitch angle
 $\theta $ is plotted as a function of a dimensionless falling displacement defined as
 ${Y^\ast } = {y_2}/{d_{eq}}$, in which
 ${y_2}$ is the y-displacement of the leading disk.
Effects of the initial inclination angle of the disks  ${\theta _0}$ on (a–d) horizontal displacements in the z direction
 ${Z^\ast }$ and (e–h) pitch angles θ obtained from the DNS simulations. The results of disk 1 and disk 2 are placed in the left-hand and right-hand columns, respectively. The initial distance between the two disks is
 ${d_2} = 2.82{d_{eq}}$. The control parameters are
 ${I^\ast } = 5.97 \times {10^{ - 3}}$ and Re = 255.

Effects of the initial distance  ${d_2}$ on (a,b) horizontal displacements in the z direction
 ${Z^\ast }$ and (c,d) pitch angles θ obtained from the simulations. The results of disk 1 and disk 2 are placed in the left-hand and right-hand columns, respectively. The initial inclination angle of the disks is
 ${\theta _0} = 60\mathrm{^\circ }$. The control parameters are
 ${I^\ast } = 5.97 \times {10^{ - 3}}$ and Re = 150.

As shown in figure 7(a,b), when the disks fall broadside at zero initial inclination angle  ${\theta _0} = 0\mathrm{^\circ }$, the instability with the oscillation in the horizontal displacement
 ${Z^\ast }$ occurs when the dimensionless falling displacement
 ${Y^\ast }$ is greater than 50. At small initial inclination angles
 ${\theta _0} = 2\mathrm{^\circ }$ and 5°, the significant oscillating horizontal movement
 ${Z^\ast }$ occurs much earlier after
 ${Y^\ast } = 10$, indicating that a small asymmetry at the beginning of disk falling leads to a quicker development of instability. At larger initial angles
 ${\theta _0} = 30\mathrm{^\circ }$, 60° and 80° (see figure 7c,d), the two disks exhibit significant horizontal oscillations in
 ${Z^\ast }$ immediately after they are released. Significant horizontal departure from the original position
 $({Z^\ast } = 0)$ is observed for the paths with very large initial inclination angles
 ${\theta _0} = 60\mathrm{^\circ }$ and 80°. The periodic oscillating behaviour of the angle
 $\theta $ is similar to that of the horizontal displacement
 ${Z^\ast }$, as shown in figure 7(e–h). The angle
 $\theta $ eventually fluctuates around
 $\theta = 0\mathrm{^\circ }$ regardless of the values of initial inclination angle
 ${\theta _0}$.
The experiments by Brosse & Ern (Reference Brosse and Ern2014) showed that at Re = 255, the thin disks of AR = 0.1 settled in the oscillatory paths with the inclination angles fluctuating periodically in time. These experimental observations are qualitatively similar to the present simulation results. In addition, the global linear stability analysis by Tchoufag, Fabre & Magnaudet (Reference Tchoufag, Fabre and Magnaudet2014) predicted that a disk settled down in a periodic oscillating path with the set of parameters  ${\theta _0} = 0\mathrm{^\circ }$, Re = 255, AR = 0.1 and
 ${I^\ast } = 5.97 \times {10^{ - 3}}$, and the present simulation results are consistent with the prediction.
By maintaining the initial inclination angle  ${\theta _0} = 60\mathrm{^\circ }$ and varying the distance
 ${d_2}$, the effects of the initial separation between the two disks are shown in figure 8. For the distances
 ${d_2}$ between
 $0.94{d_{eq}}$ and
 $3.76{d_{eq}}$, all the disks oscillate periodically, and the horizontal deviation of the path from the initial position
 $({Z^\ast } = 0)$ increases slightly as the distance
 ${d_2}$ increases (figures 8a and 8b). Similar periodic oscillations in the pitch angles θ are observed for all the distances
 ${d_2}$ considered (figures 8c and 8d). Thus, the similar falling patterns are observed for the cases with the initial distance
 ${d_2}$ between
 $0.94{d_{eq}}$ and
 $3.76{d_{eq}}$, though the quantitative differences in the disk motion exist.
In the following sections, to study the combined effects of disk aspect ratio and Reynolds number, the initial conditions of the disks are specified as  ${\theta _0} = 60\mathrm{^\circ }$ and
 ${d_2} = 2.82{d_{eq}}$.
5.2. Steady falling with enduring contact
Sequential snapshots of the two disks of AR = 0.1 and  ${I^\ast } = 5.97 \times {10^{ - 3}}$ falling at a Reynolds number of Re = 100 obtained from the simulations are shown in figure 9. The two falling disks initially translate horizontally in the positive z direction and rotate about the negative x axis, due to the initial inclined angle
 ${\theta _0} = 60\mathrm{^\circ }$. After reaching the maximum horizontal displacement in the z direction, the disks return to the central vertical line of the domain and, meanwhile, they rotate about the positive x axis. The trailing disk falls at a faster speed and can collide on the back of the leading disk, since the wake flow behind the leading disk reduces the drag force on the trailing disk. The two disks remain in contact and eventually fall together in a steady mode.
Sequential snapshots of the two disks falling in a fluid obtained from the simulations. The control parameters are  ${I^\ast } = 5.97 \times {10^{ - 3}}$ and Re = 100.

In the steady falling process, the high- and low-pressure regions are formed in the front of and behind, respectively, the two contacting disks (figure 10a), and the vortices are formed from the edges of the disks (figure 10b). The high- and low-pressure regions and vortices also remain steady, as the two disks fall in the steady mode. The falling patterns of the two disks obtained from the numerical simulation are similar to those observed from the physical experiment with the same values of  ${I^\ast }$ and Re (figure 10c). It is noted that the images in figure 10(c) are reproduced from the movie recorded in the physical experiment (provided in the supplementary material, available at https://doi.org/10.1017/jfm.2023.186). The present steady falling pattern of the two disks in a Y-configuration (figure 10) was also observed in the previous experiments of two disks falling in tandem with the parameters of AR = 0.1 and Re = 80, 115 and 152 (Brosse & Ern Reference Brosse and Ern2011).
Contours of (a) fluid pressure P and (b) fluid vorticity in the x direction  ${w_x}$ at various time instants t in the sedimentation of two disks obtained from the simulation. (c) Corresponding images at the similar time instants obtained from the physical experiment. The views are in the y–z plane. The control parameters are
 ${I^\ast } = 5.97 \times {10^{ - 3}}$ and Re = 100. The movies of the simulation and physical experiment are provided in the supplementary material.

By converting the lattice units to the international system of units (SI), as described in Appendix B, the vertical velocities of the two disks,  ${u_y}$, obtained from the LBM-DEM simulation are compared with those obtained from the real experiment, as shown in figure 11. In general, the simulation results are in good agreement with the experimental results. At the early stage, the trailing disk 1 has a higher falling speed than the leading disk 2. After the trailing disk catches up to the leading one, the two disks fall at similar speeds. The noisy fluctuations of the experimental data may be attributed to the fact that the resolution of the disk images is not sufficiently high, causing the errors in the determination of the centres of the gravity of the disks.
A comparison of the vertical velocities of the disks between the simulation and experiment. The control parameters are  ${I^\ast } = 5.97 \times {10^{ - 3}}$ and Re = 100.

The horizontal displacements of the two disks in the z direction are shown in figure 12(a), in which  $Z_1^\ast= {z_1}/{d_{eq}}$,
 $Z_2^\ast= {z_2}/{d_{eq}}$,
 ${Y^\ast } = {y_2}/{d_{eq}}$,
 ${z_1}$ and
 ${z_2}$ are the z-displacements of the trailing disk and leading disk, respectively, and
 ${y_2}$ is the y-displacement of the leading disk. The two disks initially deviate from the vertical central line
 $(Z_1^\ast= Z_2^\ast= 0)$, and then return closer to the central line. The horizontal oscillations are observed in both simulations and experiments. The two disks have initial angles of
 ${\theta _1} = {\theta _2} = 60\mathrm{^\circ }$ and
 ${\phi _1} = {\phi _2} = 0\mathrm{^\circ }$, in which the subscripts 1 and 2 represent the trailing and leading disks, respectively. As shown in figure 12(b), the angles
 ${\theta _1}$ and
 ${\theta _2}$ oscillate periodically with reduced amplitudes. The angles
 ${\phi _1}$ and
 ${\phi _2}$ maintain
 $0\mathrm{^\circ }$ at the early stage and then fluctuate with a magnitude smaller than
 $2\mathrm{^\circ }$ (figure 12c), indicating that the rotation of the two disks mainly occurs in the y–z plane. It is noted that the experimental results in figures 12(a) and 12(b) are from one of three runs under the same conditions. The same falling styles are observed from the three runs, although small differences exist in the displacements of the disks. This also applies in figures 14(a,b) and 18(a).
Evolution of (a) horizontal displacements in the z direction, (b) pitch angle  $\theta $, (c) yaw angle
 $\phi $, and (d) hydrodynamic force components and lubrication force. The control parameters are
 ${I^\ast } = 5.97 \times {10^{ - 3}}$ and Re = 100.

The evolution of the hydrodynamic force components is plotted in figure 12(d). The hydrodynamic force component on the leading disk  $F_H^{{\ast} 2}$ tends to make the two disks collide, while the hydrodynamic force component on the trailing disk
 $F_H^{{\ast} 1}$ separates them. However, the average magnitude of
 $F_H^{{\ast} 2}$ is larger than that of
 $F_H^{{\ast} 1}$, leading to the closing-in and eventually contact of the two disks. Consistent with the oscillations of the disk motion (figures 12a and 12b), the hydrodynamic forces also oscillate periodically. The contact of the two disks is defined as the gap between them is sufficiently small (i.e.
 $\varepsilon < {\varepsilon _0}$ in figure 3) that the lubrication force
 ${F_L}$ is invoked. The evolution of the scaled lubrication force,
 $F_L^\ast= {F_L}/[({\rho _s} - {\rho _f})g{V_d}]$ (the solid–solid contact force
 ${F_{ss}}$ is included in
 ${F_L}$), is also plotted in figure 12(d), in which a long presence of non-zero values of
 $F_L^\ast $ indicates the enduring contact between the two disks.
5.3. Periodic swinging with intermittent contact
With the same dimensionless moment of inertia  ${I^\ast }$ of
 $5.97 \times {10^{ - 3}}$, the steady falling pattern is changed to a double-disk periodic swinging pattern by increasing the Re from 100 to 255. As shown in figure 13(a), the trailing disk can catch up and collide with the leading disk, as the drag force on the trailing disk is reduced by the wake flow behind the leading disk. After the first collision, the trailing disk starts to swing periodically above the leading disk: translational and rotational oscillations occur simultaneously. Similar to the steady falling (figure 10a), high- and low-pressure regions are generated in the front of and behind, respectively, the two disks, as shown in figure 13(a). Associated with the periodic oscillation of the disks, the vortex shedding occurs periodically, as shown in figure 13(b), which is different from the steady vortices in the steady falling (figure 10b). The physical experiment of sedimentation is performed with the same parameters of
 ${I^\ast } = 5.97 \times {10^{ - 3}}$ and Re = 255 as in the simulation. The snapshots of the disks reproduced from the video taken in the experiment (provided in the supplementary material) are similar to those obtained from the simulation, as shown in figure 13(c). The periodic oscillations in the two disks falling were also observed in the previous experiments by Brosse & Ern (Reference Brosse and Ern2011, Reference Brosse and Ern2014) with the parameters of AR = 0.1 and Re = 255 and 275.
Contours of (a) fluid pressure P and (b) fluid vorticity in the x direction  ${w_x}$ at various time instants in the sedimentation of two disks obtained from the simulation. (c) Corresponding images at the similar time instants obtained from the physical experiment. The views are in the y–z plane. The control parameters are
 ${I^\ast } = 5.97 \times {10^{ - 3}}$ and Re = 255. The movies of the simulation and physical experiment are provided in the supplementary material.

In the periodic falling, the translational oscillation in the horizontal z direction and the rotational oscillation are demonstrated in figures 14(a) and 14(b), respectively. After the early stage, the trailing and leading disks oscillate with a phase difference of approximately a quarter of period, and the trailing disk has larger oscillating amplitudes than the leading one. Compared to the falling pattern with Re = 100 (figure 12), larger amplitudes of the oscillations in the horizontal displacement  ${Z^\ast }$ and inclination angle
 $\theta $ are obtained for the periodic swinging pattern with Re = 255. A significant difference between the falling patterns at Re = 100 and Re = 255
 $({I^\ast } = 5.97 \times {10^{ - 3}})$ is that the two disks form a stable Y-configuration at Re = 100 (figures 10b and 10c), and the Y-configuration periodically changes direction at Re = 255 (figures 13b and 13c).
Evolution of (a) horizontal displacements in the z direction, (b) pitch angle  $\theta $, (c) yaw angle
 $\phi $, and (d) hydrodynamic force components and lubrication force. The control parameters are
 ${I^\ast } = 5.97 \times {10^{ - 3}}$ and Re = 255.

As shown in figure 14(c), the yaw angle  $\phi $ develops gradually and remains minimal within
 $2\mathrm{^\circ }$, indicating the dominance of the planar motion of the disks in the y–z plane. When the two disks come to contact, the hydrodynamic force components on them exhibit periodic variations (figure 14d), which are associated with periodic oscillations of the disks. In the periodic oscillation, the disk–disk contact occurs intermittently as the non-zero lubrication forces
 $F_L^\ast $ appear occasionally, as shown in figure 14(d), which is different from the enduring contact in the steady falling (figure 12d).
5.4. Separation after a single collision
The falling pattern also depends on the shape of the disks. At the Reynolds number of Re = 320, by increasing the disk aspect ratio AR from 0.1 to 0.4 ( ${I^\ast }$ from
 $5.97 \times {10^{ - 3}}$ to
 $2.86 \times {10^{ - 2}}$), the two disks collide once and thereafter separate, without periodic oscillation of the horizontal translation. As shown in figure 15(a), the two disks initially fall along the vertical central line
 $({Z^\ast } = 0)$ until they collide at approximately
 ${Y^\ast } = 18$. The trajectories of the two disks deviate from the central line after the collision. At the early stage, the two disks rotate to have the major axes aligned vertically with
 $\theta $ close to 0°, as shown in figure 15(b). The collision at
 ${Y^\ast } = 18$ causes stronger rotation of the two particles, which is thereafter reduced as the two disks settle separately. Non-trivial magnitudes of the yaw angle
 $\phi $ are observed after the collision, as shown in figure 15(c), illustrating the three-dimensional rotation, rather than the planar motion, of the disks. As shown in the inset of figure 15(d), non-zero lubrication force
 $F_L^\ast $ is obtained at approximately
 ${Y^\ast } = 18$ as the collision occurs. After the collision, the contributions of the hydrodynamic forces for the disks to contact or separate are significantly reduced, because the angles between the hydrodynamic force vectors
 $\boldsymbol{F}_H^i$ and the branch vector
 ${\boldsymbol{r}_{ji}}$ increase, resulting in the reduced projections of the hydrodynamic forces in the branch vector direction. This situation is associated with the side-by-side falling of the two disks. In addition, after the collision, the initially trailing disk (disk 1) surpasses the other one (disk 2) and becomes the new leading disk. As a result, the hydrodynamic force component
 $F_H^{{\ast} 1}$ changes its sign from positive to negative and
 $F_H^{{\ast} 2}$ changes its sign from negative to positive. The drafting, kissing and tumbling (DKT) behaviours, which frequently occur in the settling of a pair of spheres at high Reynolds numbers, are also observed in this sedimentation with the two disks of
 ${I^\ast } = 2.86 \times {10^{ - 2}}$ and Re = 320. The above falling pattern with AR = 0.4 and Re = 320 is similar to the pattern with AR = 1/3 and Re = 255 and 285 observed in the experiments by Brosse & Ern (Reference Brosse and Ern2014) and Ern & Brosse (Reference Ern and Brosse2014), in which the two thick disks (AR = 1/3) separated after contact and fell side by side.
Evolution of (a) horizontal displacements in the z direction, (b) pitch angles  $\theta $, (c) yaw angles
 $\phi $, and (d) hydrodynamic force components and lubrication force obtained from the simulation. The control parameters are
 ${I^\ast } = 2.86 \times {10^{ - 2}}$ and Re = 320.

5.5. Tumbling without disk–disk contact
For the disks of a large dimensionless moment of inertia  ${I^\ast } = 1.37 \times {10^{ - 1}}$ (aspect ratio AR = 1) at a very large Reynolds number Re = 1000, the disks fall in a tumbling pattern with nearly random orientations and no disk–disk contact occurs, as shown in figure 16. The motions of the disks are not constrained in the y–z plane, and displacements in the x-direction are also observed. As the disks remain separated, high- and low-pressure regions, which are created in the front of and behind each individual disk (figure 17a), are much smaller than those formed near the contacting pair of disks (figures 10a and 13a). Associated with the complex motion of the disks, the structures of the vortices induced by the disks are very chaotic, as shown in figure 17(b).
Sequential snapshots of the falling disks superimposed in the same plot of domain obtained from the simulation. The two pictures are obtained from different view angles. The control parameters are  ${I^\ast } = 1.37 \times {10^{ - 1}}$ and Re = 1000.

Contours of (a) fluid pressure P and (b) fluid vorticity in the x direction  ${w_x}$ at various time instants t in the sedimentation of two disks obtained from the simulation. The views are in the y–z plane. The control parameters are
 ${I^\ast } = 1.37 \times {10^{ - 1}}$ and Re = 1000. The movies of the simulation and physical experiment are provided in the supplementary material.

For the settling pattern of segregation without contact, the two disks deviate from the vertical central line at the very beginning and follow inclined paths thereafter, as shown in figure 18(a). The pitch angle  $\theta $ varies in a wide range of
 $- 90\mathrm{^\circ }$ to
 $90\mathrm{^\circ }$ (figure 18b), due to the tumbling of the disks. The yaw angles
 $\phi $ oscillate between
 $- 20\mathrm{^\circ }$ and
 $20\mathrm{^\circ }$ (figure 18c), and thus the two disks undergo 3-D rotations. Consistent with the observation of no contact, the lubrication force
 $F_L^\ast $ remains zero in the whole settling process, as shown in figure 18(d). In addition, the magnitudes of the hydrodynamic force components, which contribute to the contact or separation of the two disks, decrease as the separated disks settle side-by-side.
Evolution of (a) horizontal displacements in the z direction, (b) pitch angles θ, (c) yaw angles  $\phi $, and (d) hydrodynamic force components and lubrication force. The control parameters are
 ${I^\ast } = 1.37 \times {10^{ - 1}}$ and Re = 1000.

The evolution of the ratio of the angular velocity component in the axis-of-symmetry direction,  ${\omega _l}$, to the angular-velocity component in a diameter direction,
 ${\omega _d}$, is plotted for each disk in figure 19. For the settling in a tumbling mode with
 ${I^\ast } = 1.37 \times {10^{ - 1}}$ and Re = 1000, as shown in figure 19(a), the angular velocity component
 ${\omega _l}$ is significant compared to the component
 ${\omega _d}$, indicating the remarkable disk rotation about the axis of symmetry. However, in the periodic swinging sedimentation with
 ${I^\ast } = 5.97 \times {10^{ - 3}}$ and Re = 255, as shown in figure 19(b), the angular velocity component
 ${\omega _l}$ is negligible compared to the component
 ${\omega _d}$ for most of the settling process. Thus, the rotation about a diameter is more dominant than the rotation about the axis of symmetry for the disks in the periodic swinging pattern, and the relative importance of the rotation about the axis of symmetry compared to that about a diameter increases in the tumbling pattern. The flatter disks with a smaller
 ${I^\ast }$ have a larger moment-of-inertia ratio
 ${I_l}/{I_d}$, leading to greater resistance to the rotation about the axis of symmetry. Thus, a larger moment-of-inertia ratio
 ${I_l}/{I_d}$ contributes to the more dominant rotation about a diameter than about the axis of symmetry for the disks in the sedimentation process.
Evolution of ratios of angular velocity components obtained from the simulations for the control parameters: (a)  ${I_l}/{I_d} = 0.857,{I^\ast } = 1.37 \times {10^{ - 1}}$ and Re = 1000; (b)
 ${I_l}/{I_d} = 1.97,{I^\ast } = 5.97 \times {10^{ - 3}}$ and Re = 255.

5.6. Phase diagrams of falling patterns
The present results and the previous results (Brosse & Ern Reference Brosse and Ern2011, Reference Brosse and Ern2014) show that the falling styles of the two identical disks in a viscous fluid are determined jointly by the dimensionless moment of inertia of the disks  ${I^\ast }$ and the terminal Reynolds number of the leading disk Re. Thus, based on
 ${I^\ast }$ and Re, a phase diagram is generated in figure 20(a) to classify the two-disk sedimentation into ten patterns: (1) steady falling with enduring disk–disk contact; (2) periodic swinging with intermittent disk–disk contacts; (3) three-dimensional oscillating with intermittent contacts; (4) separation after a single collision and steady falling with major axes of the disks aligned vertically; (5) separation after a single collision and chaotic 3-D oscillating with the major axes aligned almost vertically; (6) falling without disk–disk contact and three-dimensional oscillating with the major axes aligned almost vertically; (7) separation after a single collision and steady falling with major axes aligned horizontally; (8) separation after a single collision and steady falling with no preferential alignment of the major axes; (9) falling without disk–disk contact and 3-D oscillating with the major axes aligned almost horizontally; and (10) tumbling without disk–disk contact. For the flatter disks with a small value of
 ${I^\ast } = 5.97 \times {10^{ - 3}}$, steady falling with enduring contact occurs when Re < 100, while 2-D periodic swinging with intermittent contacts takes place when 100 < Re < 270, and the 2-D periodic swinging transits to a 3-D periodic oscillation when Re > 270. The disks with larger values of I* settle in a DKT mode when 10 < Re < 100, and the disks fall steadily after the separation. When Re > 200, the increase in I* leads to single or no collision and the chaotic 3-D oscillating motions of the disks. A detailed description of the major features of the two-disk falling patterns is provided in Appendix C.
Phase diagrams of two-disk falling patterns: (a) planar motion (regime I) versus three-dimensional motion (regime II) and (b) regimes of various disk–disk contact types: (i) enduring contact; (ii) intermittent and multiple contacts; (iii) a single contact; and (iv) no contact. Open marks represent the present simulation results and filled marks are the present experimental results. The black filled marks represent the experimental data from Brosse & Ern (Reference Brosse and Ern2011, Reference Brosse and Ern2014).

As shown in figure 20(a), the phase diagram is partitioned by a black dash curve into regimes I and II, which are associated with the planar motion and 3-D motion, respectively, of the disks. Thus, the planar or 3-D motion is determined primarily by the Re regardless of the AR or  ${I^\ast }$ of the disks, because the stronger turbulent flows enhance the 3-D rotation of the disks (see §§ 5.4 and 5.5). This conclusion is valid for the symmetric disk-like objects. However, it was observed that the asymmetric rigid fibres settled in 3-D helical paths at very low Re (<1) in the previous experiments (Tozzi et al. Reference Tozzi, Scott, Vahey and Klingenberg2011). As a result, the change in the object shape from symmetry to asymmetry can have a significant impact on the planar or 3-D motion of the objects.
By comparing the phase diagram of two-disk falling patterns (figure 20a) with that of a single disk falling (figure 24 in Appendix A.1), the 3-D falling patterns of the two disks are related to the 3-D motion of a separated disk in the sedimentation. As shown in figure 20(a), the 3-D falling of the two disks occurs at approximately  $Re > 3 \times {10^2}$. For a separated disk, as shown in figure 24 in Appendix A.1, when
 $Re > 3 \times {10^2}$, the thicker disks of
 ${I^\ast } > 4 \times {10^{ - 2}}$ settle in a tumbling mode, the moderately thick disks of
 ${10^{ - 2}} < {I^\ast } < 4 \times {10^{ - 2}}$ in a chaotic mode and the thinner disks of
 ${I^\ast } < {10^{ - 2}}$ in a periodic mode. The tumbling and chaotic modes are essentially characterized as complex 3-D motions. The periodic oscillations of a separated thinner disk at high Re exhibited a planar Zigzag pattern (Zhong et al. Reference Zhong, Chen and Lee2011; Lee et al. Reference Lee, Su, Zhong, Chen, Zhou and Wu2013) or a 3-D hula-hoop pattern (Auguste et al. Reference Auguste, Magnaudet and Fabre2013). Thus, it is interesting to note that the two thinner disks at a high
 $Re( > 3 \times {10^2})$, at which a separated disk falls in a planar zigzag pattern, can settle in 3-D motion due to the hydrodynamic interaction between them.
According to the types of disk–disk contacts in the sedimentation process, the phase diagram can be also classified into four distinctive regimes: (i) enduring contact; (ii) intermittent and multiple contacts; (iii) a single contact; and (iv) no contact, as shown in figure 20(b). Therefore, the contacts are affected by a combination of  ${I^\ast }$ and Re, and the probability and duration of the disk–disk contact are increased by reducing
 ${I^\ast }$ and Re. It is noted that the phase diagrams shown in figure 20 are valid for the disks with the initial inclination angles
 ${\theta _0}$ between 30° and 80°, and the disks with zero initial inclination angles may exhibit different falling behaviour according to the studies on the effects of initial conditions in § 5.1.
The evolutions of the distance D between the mass centres of two disks, scaled by the equivalent volume sphere diameter  ${d_{eq}}$, for various falling patterns are shown in figure 21, in which
 ${D^\ast } = D/{d_{eq}}$. The evolutions of the corresponding scaled lubrication forces
 $F_L^\ast $ are plotted in figure 22. For the enduring-contact falling (pattern 1), the scaled distance
 ${D^\ast }$ maintains as approximately one in the contacting process and
 $F_L^\ast $ is present as the contact persists. For the intermittent and multiple contacts (patterns 2 and 3),
 ${D^\ast }$ oscillates around one and
 $F_L^\ast $ appears occasionally. For the single-contact fallings (patterns 4, 5, 7 and 8),
 ${D^\ast }$ initially decreases and then increases. The non-zero value of
 $F_L^\ast $ is invoked only when the two disks move very close to each other (corresponding to the small
 ${D^\ast }$) and
 $F_L^\ast $ disappears when
 ${D^\ast }$ increases. The falling style in this single-contact regime is analogous to the DKT of a pair of spheres settling in a fluid. For the no-contact fallings (patterns 6, 9 and 10),
 ${D^\ast }$ generally increases from the beginning and
 $F_L^\ast $ vanishes in the whole falling process.
Evolutions of the distance between the mass centres of two disks, scaled by the equivalent volume sphere diameter  ${d_{eq}}$, for various falling patterns with (a) planar motion and (b) three-dimensional motion of the disks. The data are obtained from the simulations.

Evolutions of the scaled lubrication force between the two disks  $F_L^\ast $ for various falling patterns with (a) planar motion and (b) three-dimensional motion of the disks. The data are obtained from the simulations.

6. Conclusions
Solid-surface-resolved DNS of a pair of disks falling in a fluid are performed using a coupled approach of lattice Boltzmann method (LBM) and cylindrical particle discrete element method (DEM). The simulation results are generally consistent with the present and previous experimental observations (Brosse & Ern Reference Brosse and Ern2011, Reference Brosse and Ern2014). Based on the simulations, translational and rotational displacements of the disks are presented to illustrate the sedimentation patterns, the contributions of hydrodynamic forces to collision or separation of the disks are discussed, and the evolution of the lubrication force is analysed to understand the disk–disk contact scenarios.
It is observed that the settling behaviour is determined by the combination of a dimensionless moment of inertia of the disks I* and a disk Reynolds number Re. For the flatter disks with a small value of  ${I^\ast } = 5.97 \times {10^{ - 3}}$, steady falling with enduring contact occurs when Re < 100, while 2-D periodic swinging with intermittent contacts takes place when 100 < Re < 270, and the 2-D periodic swinging transits to a 3-D periodic swinging when Re > 270. The disks with larger values of I* fall in a DKT mode when 10 < Re < 100. When Re > 200, the increase in I* leads to single or no collision and the chaotic 3-D oscillating motions of the disks. Based on I* and Re, a planar phase diagram is created to classify the two-disk falling into ten distinctive patterns. The planar motion or 3-D motion of disks is determined primarily by Re. It is believed that the strong disturbance flows at a high Re contribute to the chaotic 3-D rotation of disks. The chance for the two disks to contact is increased when I* and Re are reduced.
This work presents a primary study on the hydrodynamic interactions of two non-spherical particles in the sedimentations. Future work may be conducted to understand the effects of solid wall boundaries on the sedimentation of a pair of non-spherical particles and the settling behaviours of multiple non-spherical particles.
Supplemental movies
Supplementary movies are available at https://doi.org/10.1017/jfm.2023.186.
Acknowledgements
The authors express their gratitude to Dr Z. Dong for the helpful discussion in the numerical code development and Dr G. Wang for providing the MATLAB code to extract data from videos taken in the physical experiments. At the time, both Dr Dong and Dr Wang worked at the Southern University of Science and Technology, Shenzhen, China.
Funding
The National Science Foundation of China (nos. 12132015, 91852205, 11872333, 12072319 and 11988102), the Zhejiang Provincial Natural Science Foundation of China (no. LR19A020001) and the Fundamental Research Funds for the Central Universities (no. 2021FZZX001-11) are acknowledged for their financial support.
Declaration of interests
The authors report no conflict of interest.
Appendix A. Validation of the coupled scheme of lattice Boltzmann method (LBM) and cylindrical particle discrete element method (DEM)
Four sets of simulations have been performed using the coupled LBM-DEM code developed in this work. The present simulation results are compared with the existing experimental and numerical results for the code validation.
A.1. Falling modes for a single disk
Using the present LBM-DEM method, sedimentations of a single disk of AR = 0.1 and  ${I^\ast } = 5.97 \times {10^{ - 3}}$ at various particle terminal Reynolds numbers are simulated. A 3-D rectangular computational domain of dimensions
 ${L_x} = {L_z} = 300$ (lattice unit or LU) and
 ${L_y} = 1200$ (LU) is created, as shown in figure 5(a). The disk of an equivalent volume sphere diameter of
 ${d_{eq}} = 31.88$ (LU) is placed at the position of the coordinates
 $({L_x}/2,{L_y} - {d_1},{L_z}/2)$. The clearance to the top boundary is specified as
 ${d_1} = 6.27{d_{eq}}$. Here, the Reynold number is defined as
 \begin{equation}Re = \frac{{{u_c}{d_c}}}{{{\nu _f}}},\end{equation}
in which  ${u_c}$ and
 ${d_c}$ are the terminal vertical velocity and diameter, respectively, of the disk, and
 ${\nu _f}$ is the kinematic viscosity of the fluid. The disk is released with the initial angle of 60° between the axis of the disk and the vertical direction, and it falls under the gravitational force. The sequential snapshots of the falling disk at different Re are shown in figure 23. At a low Reynolds number (Re = 55), the disk eventually achieves a steady falling mode with the axis of the disk aligned vertically. At a higher Reynolds number (Re = 120), periodic movement in the horizontal direction and periodic rotation of the disk are observed. The further increases in Reynolds number (Re = 180 and 350) lead to an increase in the amplitudes of the periodic motion.
Sequential snapshots of the falling disk at different Re.

Based on the dimensionless moment of inertia  ${I^\ast }$ and particle Reynolds number Re, Field et al. (Reference Field, Klaus, Moore and Nori1997) classified four distinctive falling modes for a single disk in a viscous fluid: steady falling, periodic, chaotic and tumbling, as shown in figure 24. The falling modes obtained from the present simulations are consistent with the classification by Field et al. (Reference Field, Klaus, Moore and Nori1997) (see figure 24).
Phase diagram of the typical modes of a disk falling in a viscous fluid.

Using the experimental set-up described in § 4, the sedimentation of a single acrylic disk in a solution of glycerol at Re = 180 is conducted with an initial inclination angle of  ${\theta _0} = 60\mathrm{^\circ }$. The disk has a density of 1.2 g cm−3, a diameter of
 ${d_c} = 20\ \textrm{mm}$, a thickness of
 ${l_c} = 2\ \textrm{mm}$ and thus AR = 0.1. A comparison between the simulation and experimental results is made for the horizontal displacements
 ${Z^\ast }$ and pitch angles
 $\theta $ in figures 25(a) and 25(b), respectively. The experimental data from three runs under the same conditions are presented. Similar sinusoidal oscillations are obtained in the simulation and experiments. The differences between the simulation and experiments in the oscillatory magnitudes and frequencies are approximately 15 %, which is comparable to the extent of the difference between two experimental runs. In the experiment, a disk was held and released by a clamp, which might affect the initial falling of the disk by interacting with the surrounding fluid. The clamp did not exist in the numerical simulation. Thus, the initial conditions of the disk falling were not exactly the same between the experiment and simulation, which could cause the discrepancy in the comparison.
Evolution of (a) horizontal displacements in the z direction  ${Z^\ast }$ and (b) pitch angle
 $\theta $ of the settling disk for the control parameters
 ${I^\ast } = 5.97 \times {10^{ - 3}}$ and Re = 180.

A.2. Drag coefficient versus particle terminal Reynolds number
Clift et al. (Reference Clift, Grace and Weber1978) experimentally determined the correlation between drag coefficient  ${C_D}$ of a disk falling in a fluid and particle terminal Reynolds number Re, as shown in figure 26. The drag coefficient is defined as
 \begin{equation}{C_D} = \frac{{{F_D}}}{{\frac{1}{2}{\rho _f}u_t^2\frac{\rm \pi}{4}d_{eq}^2}},\end{equation}
in which  ${F_D}$ is the drag force on the disk (i.e. the hydrodynamic force in the vertical direction),
 ${u_t}$ is the terminal falling velocity of the disk and
 ${d_{eq}}$ is the equivalent volume sphere diameter of the disk. Two regimes can be distinguished: (i) for Re < 100, the disk eventually achieves a steady falling mode, and thus the drag coefficient exhibits a quick decrease with increasing Re; (ii) for Re > 100, secondary motion of the disk (horizontal movement and rotation) occurs, associated with wake shedding at the edge of the disk, leading to the drag coefficient insensitive to Re.
Drag coefficient versus Re for a falling disk of AR = 0.1 and  ${I^\ast } = 5.97 \times {10^{ - 3}}$ in a fluid.

Sedimentations of a single disk (AR = 0.1 and  ${I^\ast } = 5.97 \times {10^{ - 3}}$) at various Re are simulated using the present coupled LBM-DEM method, and the computational set-up is the same to that in Appendix A.1. The drag coefficients obtained from the simulations are also plotted in figure 25. A comparison shows that the present simulation results are in very good agreement with the correlation by Clift et al. (Reference Clift, Grace and Weber1978) in both Re-sensitive and Re-insensitive regimes.
A.3. Lift and torque coefficients for a cylindrical particle
Fluid flows around a cylinder fixed at a specified position and orientation are simulated using the present coupled LBM-DEM approach. As illustrated in figure 27(a), a rectangular domain of x × y × z dimensions of 200 × 900 × 600 (lattice unit or LU) is created, and a cylinder, which has a diameter dc = 12 LU, a length lc = 60 LU and thus an aspect ratio  $AR = {l_c}/{d_c} = 5$, is fixed at the centre of the domain. The effect of the cylinder orientation is examined by adjusting the attack angle
 $\alpha $ in the x–y plane, as shown in figure 27(b). The fluid flows along the y direction from the left-hand side to the right-hand side. A constant fluid velocity U is specified on the inlet boundary. The outlet boundary and the boundaries in the y and z directions are the fully developed flows with zero gradients of fluid velocities and pressures. In the simulations, the cylinder Reynolds number is specified as
 $Re = U{d_{eq}}/{\nu _f} = 300$, in which
 ${d_{eq}}$ is the equivalent volume sphere diameter of the cylinder.
(a) A numerical domain of a fluid flowing around a fixed cylinder, and (b) an illustration of attack angle  $\alpha $: the angle between the major axis of the cylinder and the streamwise direction y in the y–z plane.

With an attack angle  $\alpha $, the lift force
 ${F_L}$ perpendicular to the streamwise y direction can be calculated. Thus, the lift coefficient
 ${C_L}$ can be obtained as
 \begin{equation}{C_L} = \frac{{{F_L}}}{{\frac{1}{2}{\rho _f}{U^2}\frac{\rm \pi}{4}d_{eq}^2}}.\end{equation}
The lift coefficient  ${C_L}$ is plotted as a function of the attack angle
 $\alpha $ in figure 28(a), and good agreement is obtained between the present simulation results and the previous DNS results of an ellipsoid with the same aspect ratio of AR = 5 by Zastawny et al. (Reference Zastawny, Mallouppas, Zhao and Wachem2012). Also, the present simulation results follow the prediction by the models proposed by Kharrouba, Pierson & Magnaudet (Reference Kharrouba, Pierson and Magnaudet2021), which are available for the attack angles
 $\alpha \le 30\mathrm{^\circ }$. In the article by Kharrouba et al. (Reference Kharrouba, Pierson and Magnaudet2021), the Reynolds number is defined as
 $R{e^\ast } = U{d_c}/{\nu _f}$ and thus the present Re and the previous Re* follow the correlation:
 \begin{equation}R{e^\ast } = Re{\left( {\frac{2}{{3AR}}} \right)^{1/3}}.\end{equation}
The parallel and perpendicular coefficients are defined as
 \begin{gather}C_\parallel ^\ast= \frac{{{F_\parallel }}}{{{\textstyle{1 \over 2}}{\rho _f}{U^2}{l_c}{d_c}}},\end{gather}
 \begin{gather}C_ \bot ^\ast= \frac{{{F_ \bot }}}{{{\textstyle{1 \over 2}}{\rho _f}{U^2}{l_c}{d_c}}},\end{gather}
in which  ${F_\parallel }$ and
 ${F_ \bot }$ represent the hydrodynamic force components parallel and perpendicular, respectively, to the symmetric axis of the cylindrical object. The lift force can be written as
 \begin{equation}{F_L} = {F_ \bot }\cos \alpha - {F_\parallel }\sin \alpha .\end{equation}
 \begin{equation}{C_L} = \frac{4}{\rm \pi}{\left( {\frac{2}{3}} \right)^{2/3}}A{R^{1/3}}(C_ \bot ^\ast \cos \alpha - C_\parallel ^\ast \sin \alpha ).\end{equation}
The mathematical expressions of  $C_ \bot ^\ast $ and
 $C_\parallel ^\ast $ as functions of AR, Re* and
 $\alpha $ can be found in the paper by Kharrouba et al. (Reference Kharrouba, Pierson and Magnaudet2021).
(a) Lift coefficient and (b) torque coefficient of a single cylinder as a function of attack angle  $\alpha $.

Pitching torque (in the z direction)  ${T_P}$ exerted on the cylinder can be also obtained from the simulations, and a torque coefficient
 ${C_T}$ is defined as
 \begin{equation}{C_T} = \frac{{{T_P}}}{{\frac{1}{2}{\rho _f}{U^2}\frac{\rm \pi}{8}d_{eq}^3}}.\end{equation}
Figure 28(b) shows the torque coefficient as a function of the attack angle. The present simulation results are consistent with the previous simulation results (Zastawny et al. Reference Zastawny, Mallouppas, Zhao and Wachem2012) and the prediction of the torque coefficient model (Kharrouba et al. Reference Kharrouba, Pierson and Magnaudet2021). In the work by Pierson et al. (Reference Pierson, Hammouti, Auguste and Wachs2019), the torque coefficient  $C_T^\ast $ is defined as
 \begin{equation}C_T^\ast= \frac{{{T_P}}}{{{\textstyle{1 \over 2}}{\rho _f}{U^2}l_c^2{d_c}}}.\end{equation}
Thus, the present torque coefficient  ${C_T}$ is related to
 $C_T^\ast $ as
 \begin{equation}{C_T} = \frac{{16AR}}{{3{\rm \pi}}}C_T^\ast .\end{equation}
The mathematical model of  $C_T^\ast $ as a function of AR, Re* and
 $\alpha $ is provided in the paper by Kharrouba et al. (Reference Kharrouba, Pierson and Magnaudet2021).
A.4. Two disks falling in tandem
In a simulation of two identical disks falling in tandem, the disks have an aspect ratio of AR = 0.1 and a diameter of  ${d_c} = 9\ \textrm{mm}$. The densities of fluid and disks are
 ${\rho _f} = 1010\ \textrm{kg}\ {\textrm{m}^{ - 3}}$ and
 ${\rho _s} = 1020\ \textrm{kg}\ {\textrm{m}^{ - 3}}$, respectively. The Reynolds number of the leading disk is
 $Re = {u_l}{d_c}/{\nu _f} = 115$. These parameters in the present simulation are the same as those in an experimental case by Brosse & Ern (Reference Brosse and Ern2011). In the experiment (Brosse & Ern Reference Brosse and Ern2011), the disks were released at separate times through a 20 cm long tube. The velocities and orientation of the disks and the vertical distance between them were unclear when they moved out of the tube. Thus, it is impossible to ensure the same initial conditions for the previous experiment and the present simulation. To produce the similar process of two disks falling in tandem, in the present simulation, the two disks are released simultaneously with a small initial inclination angle of
 ${\theta _0} = 5\mathrm{^\circ }$ and an initial distance of
 ${d_2} = 2.282 {d_{eq}}$ (see figure 5). The trailing disk catches up to the leading one, and the two disks fall together steadily in a Y-configuration. This falling pattern is similar to the experimental observation by Brosse & Ern (Reference Brosse and Ern2011) with same set of parameters (AR = 0.1 and Re = 115). The quantitative comparison between the experimental and simulation results is made in figure 29. The similar periodic oscillation patterns of the horizontal displacement
 $z/{d_c}$ and inclination angle
 $\theta $ are obtained between the experiment and simulation. However, larger periods and magnitudes of the oscillations are observed in the simulation than in the experiment. The discrepancies may be attributed to the differences in the initial conditions between the experiment and simulation. In addition, a small disturbance in the fluid can cause a notable change in the dynamics of the disks, causing the differences even between two independent experimental runs. It is very hard to ensure completely identical conditions between the experiment and simulation.
Time evolution of (a) the normalized horizontal displacement  $z/{d_c}$ and (b) the inclination angle
 $\theta $ at the steady falling state. The time instant
 ${t^\ast }$ is 40 s for the experiment and
 ${t^\ast }$ is 21.3 s for the simulation to ensure that the comparison starts from the same phase position of the periodic oscillations. The controlling parameters are AR = 0.1 and Re = 115.

Appendix B. Conversion of the lattice units used in the lattice Boltzmann method (LBM) to the international system of units (SI)
The conversion factor of length is expressed as
 \begin{equation}{C_H} = \frac{{\tilde{D}}}{D},\end{equation}
in which  $\tilde{D}$ and D represent the cylinder diameters in physical unit and lattice unit, respectively. To ensure the equality of Reynolds numbers between the physical unit system and lattice unit system, the conversion factor of time is derived as
 \begin{equation}{C_t} = \frac{{C_H^2}}{{{C_\nu }}},\end{equation}
where  ${C_\nu }$ is the conversion factor of kinematic viscosity and has the form:
 \begin{equation}{C_\nu } = \frac{{\tilde{\nu }}}{\nu },\end{equation}
and  $\tilde{\nu }$ and
 $\nu $ are the kinematic viscosities in the physical unit and lattice unit, respectively. Thus, the conversion factor of velocity is obtained as
 \begin{equation}{C_u} = \frac{{{C_H}}}{{{C_t}}}.\end{equation}
The velocity  $\tilde{u}$ and time
 $\tilde{t}$ in the physical units can be determined using the corresponding quantities u and t in the lattice units:
 \begin{equation}\tilde{u} = u {C_u},\end{equation}
and
 \begin{equation}\tilde{t} = t {C_t}.\end{equation}
Appendix C. Features of the two-disk falling patterns
The major features of the ten falling patterns are described in table 4.
Features of the two-disk falling patterns.



