Introduction
Deformation twinning in metals and alloys has been investigated extensively because it is one of the few mechanisms that can increase strength and ductility simultaneously [Reference Lu, Shen, Chen, Qian and Lu1, Reference Shen, Lu, Lu, Jin and Lu2, Reference Zhu, Liao and Wu3]. It is well known that the activation of deformation twinning is affected by intrinsic physical and structural characteristics of materials [e.g., stacking-fault energy (SFE) and grain size] [Reference Ni, Wang, Liao, Li, Figueiredo, Ringer, Langdon and Zhu4] and extrinsic deformation conditions (e.g., strain, strain rate and temperature) [Reference Li, Tao and Lu5, Reference Zhao, Wang, Fan, Bie, Zhou, Suo, Li, Chen, Liu, Qi, Zhu and Luo6]. Among these factors, the grain size effect is less explored because its significance was mainly noticed after the discovery of nanocrystalline (NC) materials. The grain size effect on deformation twinning has attracted significant attentions recently, most of which are paid to the grain size effect on twinning propensity [Reference Chen, Ma, Hemker, Sheng, Wang and Cheng7, Reference Liao, Zhou, Lavernia, He and Zhu8, Reference Wu and Zhu9].
As an effective dislocation barrier, it is well known that the strengthening effect of twin boundaries is considered similar to that of grain boundaries and can be evaluated by the following equation [Reference Shen, Lu, Lu, Jin and Lu2]:
 $${\sigma _{{\rm{TB}}}} = {{{K_{{\rm{TB}}}}} \over {\sqrt t }}\quad ,$$
where K TB is a constant value and t is the average twin thickness. It is obvious that, when the twin thickness is larger than a critical value, the strengthening effect of twin boundaries is inversely proportional to the twin thickness [Reference Lu, Chen, Huang and Lu10]. Apparently, besides twinning density, twin thickness is another important microstructural feature, and increasing interests have been put on nanoscale twinned materials with unprecedented strengths [Reference Lu, Shen, Chen, Qian and Lu1, Reference Huang, Yu, Xu, Hu, Ma, Wang, Zhao, Wen, He, Liu and Tian11]. Twin thickness has been reported to be affected by SFE [Reference An, Wu, Wang and Zhang12] and extrinsic deformation conditions such as strain rate and temperature [Reference Li, Zhang, Tao and Lu13]. However, the relationship between grain size and twin thickness has been rarely investigated, especially when the grain size enters into the <1000 nm regime. In 2001, Meyers et al. [Reference Meyers, Vöhringer and Lubarda14] proposed an elegant model to predict the twin embryo size (minimum twin size) as a function of twinning stress in coarse-grained materials. Meyers’ model takes into account the classical Hall–Petch relationship between the global twinning stress and grain size and demonstrates that twin embryo size decreases with the decreasing grain size in coarse-grained face-centered cubic (fcc) materials. This dislocation-based model is invalid in NC and ultrafine-grained (UFG) materials since dislocation activities are suppressed in such fine grains. Thus, it is necessary to investigate the grain size effect on twin thickness, especially for NC and UFG materials.
Although the twinning mechanisms are different in coarse-grained and NC materials, they share some similarities. For example, twins can be formed by overlapping of stacking faults [Reference Mahajan and Chin15, Reference Zhu, Liao, Srinivasan, Zhao, Baskes, Zhou and Lavernia16], and twinning is always stress driven [Reference Cao, Wang, Liao, Kawasaki, Ringer, Langdon and Zhu17, Reference McCabe, Beyerlein, Carpenter and Mara18]. Therefore, it is being wondered if the twin thickness, which is theoretically governed by stress, is also affected by grain size in NC and UFG materials. In our previous work [Reference Li, Zhao, Liu, Xu, Horita, Liao, Zhu, Langdon and Lavernia19], high-pressure torsion (HPT) and equal-channel angular pressing (ECAP) followed by cold rolling were used to achieve a wide range of grain sizes from about 3 μm to 70 nm in a Cu–30% Zn alloy. We found that, with decreasing grain size, the average deformation twin thickness decreases gradually from 177 to 24 nm, while the density of deformation twins (the length of twin boundary in unit area) exhibits a maximum value at an ECAP + 95% rolling sample with an average grain size of 110 nm. Due to the resolution limitation of transmission electron microscopy (TEM), the twin thickness variation versus grain size below 70 nm was not investigated, and the underlying mechanism for the relationship of twin thickness versus grain size was not clarified [Reference Beyerlein, Capolungo, Marshall, McCabe and Tomé20]. Beyerlein et al. [Reference Beyerlein, Capolungo, Marshall, McCabe and Tomé20] reported that the twin thickness in Mg and Zr is independent of grain size. It is worthy to note that these conclusions were based on observations derived from optical microscopy, TEM and electron back-scattered diffraction; due to the resolution limitations of these techniques, it is difficult to study the grain size effect in atomic scale, and the twinning mechanisms and twin thickness-grain size relationship need to be further clarified.
In this work, to solve the abovementioned problems, we used high-resolution TEM (HRTEM) to reexamine aspects of our previous statistical analysis in Cu–30% Zn alloy [Reference Li, Zhao, Liu, Xu, Horita, Liao, Zhu, Langdon and Lavernia19] that related twin thickness to grain size, especially in the grain size range below 70 nm. Cu–30% Zn alloy was selected as a model material to study this phenomenon because it has a low SFE and twinning is its dominant deformation mechanism. A large data set was created by extensive HRTEM analyses over hundreds of grains, through a wide range of grain sizes, to illustrate the relationship between twin thickness and grain sizes. The trend is found similar to what was observed/estimated in coarse-grained materials, but below a critical grain size, only stacking faults were observed.
Results
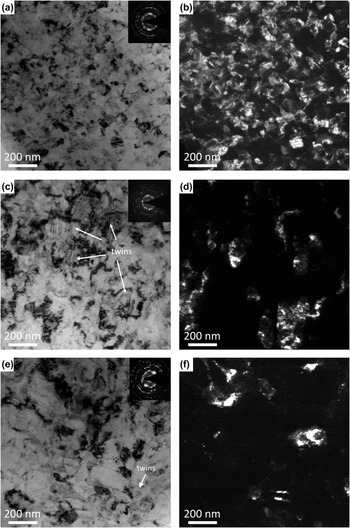
Figures 1(a) and 1(b) show the bright field (BF) and dark field (DF) TEM images of the HPT-processed Cu–30% Zn alloy, respectively. The microstructure exhibits homogeneously distributed equiaxed nanograins and ultrafine grains. Most grains contain planar structural features [see in Fig. 1(b)], which were proved to be twins and stacking faults. The relatively continuous rings of the selected area electron diffraction (SAED) pattern confirm again that there is no obvious preferential grain orientation in the NC Cu–30% Zn alloy. Figures 1(c) and 1(d) show the microstructures of the Cu–30% Zn alloy processed by ECAP + 95% rolling. Compared with that of the HPT-processed sample, the grains are obviously bigger and mostly within the UFG regime. High density of deformation twins were also found in the sample, as shown by the white arrowheads in Fig. 1(c). The SAED in Fig. 1(c) indicates the existence of texture-free equiaxed grains. Figures 1(e) and 1(f) show the microstructures of the Cu–30% Zn alloy processed by ECAP + 75% rolling. As can be seen, the grains in the sample are much bigger than that of the ECAP + 95% rolling sample. Additionally, the twin frequency appearing in an ECAP + 75% rolling sample is lower than that in an ECAP + 95% rolling sample, and only one grain containing deformation twins was identified in the ECAP + 75% rolling sample [see the white arrowhead in Fig. 1(e)].
(a, b) BF and DF TEM images of the HPT sample; (c, d) BF and DF TEM images of the ECAP + 95% rolling sample; (e, f) BF and DF TEM images of the ECAP + 75% rolling sample. The diameter of the selected area diffraction aperture is (a, c) 4.0 μm and (e) 1.2 μm, respectively. White arrowheads point out some typical nanotwins.

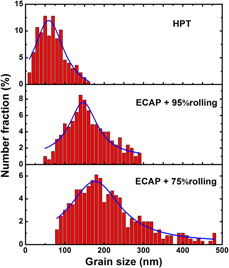
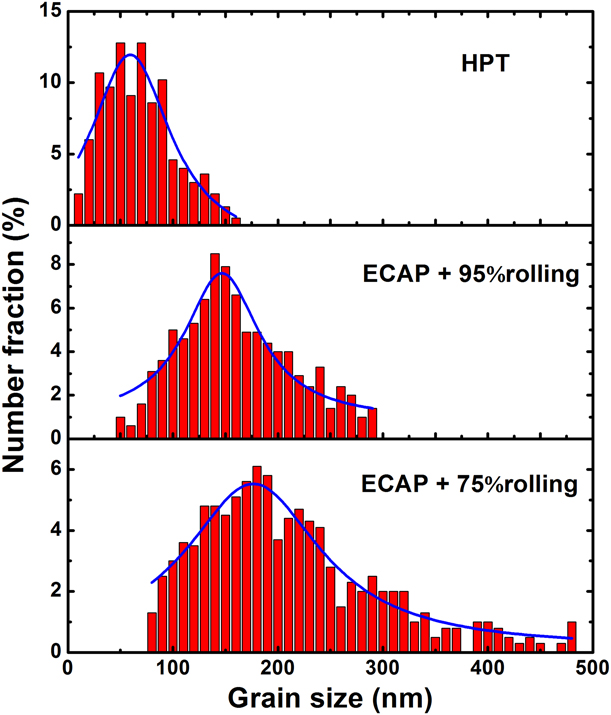
Figure 2 gives the measured statistical grain size distributions for Cu–30% Zn alloys processed by HPT, ECAP + 95% rolling and ECAP + 75% rolling, determined from a large number of TEM images. The grain size in the HPT sample distributes from ∼5 to ∼160 nm with an average size of ∼80 nm. ECAP + 95% rolling and ECAP + 75% rolling samples are with grain sizes distributed in the range of ∼50 nm–300 nm and ∼80 nm–500 nm, respectively. The average grain size is ∼160 nm for the ECAP + 95% rolling sample and ∼260 nm for the ECAP + 75% rolling sample. Thus, a wide range of grain size can be derived from these three kinds of samples to study the relationship between the grain size and twin thickness.
Measured statistical grain size distribution for Cu–30% Zn alloys processed by HPT, ECAP + 95% rolling and ECAP + 75% rolling, determined from a large number of TEM images.
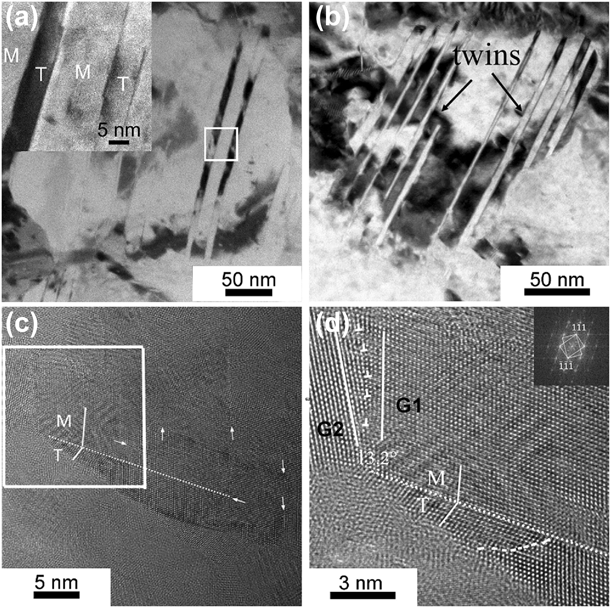
A large number of HRTEM images reveal that grains in the size range of ∼20–500 nm contain both stacking faults and deformation twins. Figure 3(a) shows an example of a ∼300 nm grain containing deformation twins and stacking faults. The inset is an HRTEM image of the white rectangle area in Fig. 3(a), which confirms the twinning relationship. Figure 3(b) shows a BF TEM image of a ∼150 nm grain, which contains high density of twins. The thickness of the twins ranges from a few nanometers to a few tens of nanometers. Most of them passed through the whole grain, while some twins stopped in the grain interior.
(a) TEM image of a typical ∼300 nm grain, the inset is the magnified image of the framed area; (b) TEM image of a typical ∼150 nm grain; (c) HRTEM image of a typical ∼60 nm grain; (d) magnified image of the framed area in (c) and inset of a fast Fourier-transformed pattern showing the twin relationship.

Figure 3(c) shows a ∼60 nm grain. There are many stacking faults in this grain as indicated by white arrowheads. A twin is observed at the bottom of the grain boundary (GB) denoted by M/T. The area enclosed by the white rectangle is magnified in Fig. 3(d). Grain 1 (G1) has 13.2° misorientation with grain 2 (G2). The twin was initiated at the junction between G1, G2 and the grains that are out of the low-index zone axes. Deformation twinning requires sufficient high stress, and a multiple boundary junction is an ideal stress concentration site as well as a dislocation source. Therefore, twinning partials have high probability to emit from a multiple boundary junction [Reference Randle21, Reference Kibey, Liu, Johnson and Sehitoglu22]. The twin did not pass through the whole grain, but left an incoherent twin boundary in the grain interior, as indicated by the white dashed line. This suggests insufficient driving force for this twin to propagate through the grain [Reference An, Song, Huang, Liao, Ringer, Langdon and Zhu23].
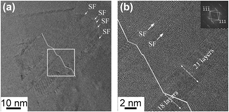
Figure 4(a) shows a typical HRTEM image of a ∼40 nm grain with many twins and staking faults. The white rectangle framed area in Fig. 4(a) is enlarged in Fig. 4(b), where the upper twin contains a stacking fault as indicated by a white arrowhead. The twin at the bottom of the image contains incoherent twin boundaries that stopped inside the grain. This indicates that GB-mediated twinning and detwinning mechanisms are operative at this grain size [Reference Zhu, Liao, Srinivasan, Zhao, Baskes, Zhou and Lavernia16, Reference Wang, Li, Anderoglu, Zhang, Misra, Huang and Hirth24].
(a) HRTEM images of an HPT sample with a grain size of ∼40 nm; (b) magnified image of the framed area in (a). White arrowheads point out some stacking faults and microtwins.

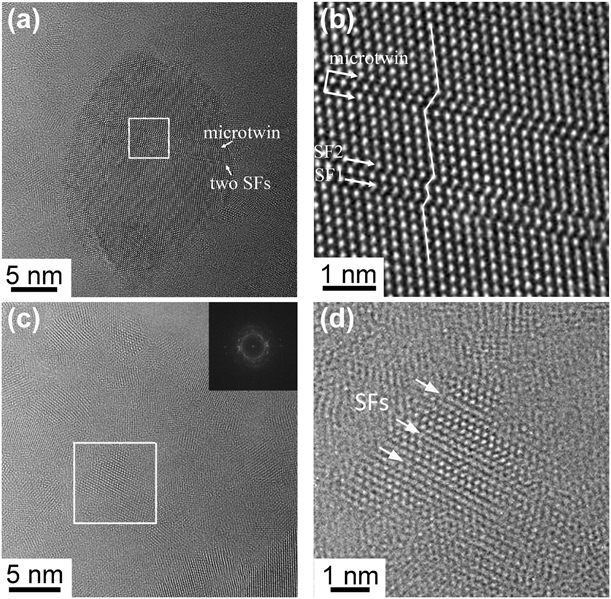
Figure 5(a) shows an example of an ∼20 nm grain. Figure 5(b) gives the enlarged image of white rectangle framed area in Fig. 5(a). It is clearly seen from Fig. 5(b) that there is a two-layer microtwin (extrinsic stacking fault) and two intrinsic stacking faults passing through the whole grain, as indicated by the white arrowheads. Figure 5(c) shows some typical nanograins found at the edge of an HPT sample and Fig. 5(d) shows a magnified view of an ∼8 nm grain enclosed by a white rectangle in Fig. 5(c). There are two stacking faults passing through the whole grain, as indicated by the white arrowheads. Extensive HRTEM analyses show that there are profuse stacking faults instead of deformation twins in those grains smaller than 20 nm. This suggests that twinning is no longer operative in grains smaller than 20 nm in this Cu–30% Zn alloy under the current deformation conditions.
HRTEM images of an HPT sample with different grain sizes (a) ∼20 nm and (c) ∼8 nm. (b, d) magnified images of framed areas in (a) and (c), respectively.

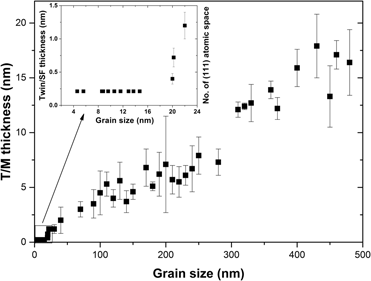
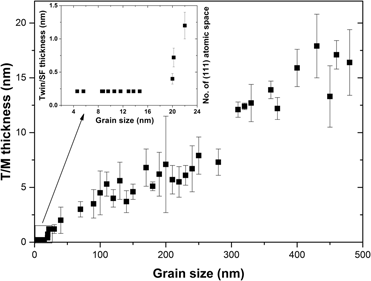
Figure 6 reveals the relationship between twin thickness and grain size in UFG and NC Cu–30% Zn alloy samples, derived from a large number of HRTEM images. It is noteworthy that, for a given grain size, the average twin thickness shows no big difference between the three samples; thus, Fig. 6 gives the data from the three samples without differentiation. It is clearly seen that with decreasing grain size from ∼500 to ∼20 nm, twin thickness gradually reduces to two atomic layers (a microtwin, 0.424 nm). When the grain size is below 20 nm, only one atomic layer (a stacking fault) with a thickness of 0.212 nm is found, as shown in the inset (Fig. 6). The observed relationship between twin thickness and the grain size is governed by both twinning stress and twinning mechanisms. Therefore, a preliminary attempt to explain the twin thickness and grain size relationship in UFG and NC fcc alloys can be made in section “Conclusions”.
A plot of the experimental data correlating the twin thickness with the grain size in UFG and NC Cu–30% Zn alloys.

Discussion
Dislocation-based mechanisms [Reference Mahajan and Chin15, Reference Cohen and Weertman25] have been proposed to explain twin nucleation in coarse-grained fcc materials. Meyers et al. [Reference Meyers, Vöhringer and Lubarda14] applied the twinning nucleation mechanism [Reference Venables26] to predict the critical twin nucleus size above which the twin can form and grow in a stable manner. It was assumed that a twin embryo is a disk-shaped nucleus with radius r c and thickness λc, and the relationship between r c and λc is λc/r c = ρ, where ρ is a constant aspect ratio. Consequently, the twin embryo size is directly related to the SFE and driving stress, as expressed by [Reference Meyers, Vöhringer and Lubarda14]
 $${\lambda _{\rm{c}}} = {{5\pi G} \over 4}{{{\gamma _{{\rm{SF}}}}} \over {\sigma _{\rm{T}}^2}}\rho \quad ,$$
where G is the shear modulus and γSF is the SFE. Another variable σT is the twinning stress estimated based on the Hall–Petch relationship. Therefore, while the Hall–Petch relationship is valid, σT increases with decreasing grain size. Consequently, described by formula (2), the twin embryo size decreases with decreasing grain size in coarse-grained materials. This is similar to what has been observed in the current work in UFG and NC Cu–30% Zn alloys (Fig. 6). However, a simple adoption of formula (2) to estimate the twin embryo size and twin thickness in UFG and NC materials is inappropriate because the conventional Hall–Petch relationship and Venables’ twinning model, which the formula is based on, are no longer valid in NC materials [Reference Mahajan27, Reference Kumar, Van Swygenhoven and Suresh28, Reference Shan, Stach, Wiezorek, Knapp, Follstaedt and Mao29]. Notwithstanding, the similarity between the estimation by the formula and the result of our work is not a coincidence. Meyers’ model considered two important factors, twinning stress (σT) and SFE (γSF), which are also determinative factors for twinning in UFG and NC materials. Additionally, Meyers’ model [Reference Meyers, Vöhringer and Lubarda14] assumed the stress concentration site is on the GB which is also true in NC materials [Reference Yamakov, Wolf, Phillpot, Mukherjee and Gleiter30, Reference Huang, Wang, Wu, Zhang, Li and Li31].
Once the grain sizes decrease to the UFG and NC regimes, the conventional dislocation-based twinning mechanisms cease to operate [Reference Mahajan27]; instead, GB-mediated deformation mechanisms start to dominate [Reference Yamakov, Wolf, Phillpot, Mukherjee and Gleiter30, Reference Cao, Ni, Liao, Song and Zhu32], as shown in Figs. 3–5. Twin nucleation requires a flow stress higher than both leading Shockley partial emission stress and twinning partial emission stress. As the grain size decreases, both stresses increase [Reference Zhu, Liao and Wu3, Reference Wu and Zhu9, Reference Yamakov, Wolf, Phillpot, Mukherjee and Gleiter33, Reference Van Swygenhoven, Derlet and Froseth34]. Combined with the requirement of higher stress for twinning than for leading partial emission, one can envisage that below a certain critical grain size, the stress required for twinning is eventually higher than the applied flow stress; therefore, twinning will stop, but extended stacking faults can still form, as shown in Fig. 6. This is consistent with early observations in NC Ni deformed at the liquid nitrogen temperature [Reference Wu and Zhu9].
In NC materials, SFE alone is insufficient to explain the twinning behavior; a generalized planar fault energy (GPFE) curve also plays a significant role [Reference Van Swygenhoven, Derlet and Froseth34]. The GPFE contains the stacking-fault energy (γSF), unstable stacking-fault energy (γUSF) and unstable twin fault energy (γUTF). Under GB-mediated twinning mechanisms, the applied stress needs to first overcome the energy barrier γUSF to emit a leading partial to form a SF in the grain and the energy barrier γUTF to nucleate a two-layer twin. As the grain sizes decrease, the GB areas increase in a bulk material and the number of partial dislocation emission sites increases. However, active SF activities could delay twin formation because it relieves the local stress concentration that is needed for subsequent twin nucleation. Meanwhile, the active partial dislocation activities create single-layer SFs that are potential twin nucleation sites, which may lead to high density of twin nuclei. These nuclei will compete with each other for growth. As the grain size decreases, the twin growth competitions will limit the growth space of individual twins, which leads to smaller twin thickness. This is similar to the twin embryo growth competitions in coarse-grained low-SFE materials [Reference An, Wu, Wang and Zhang12]. Moreover, detwinning activity becomes stronger with decreasing grain size due to higher flow stress to drive partial dislocation interactions with twin boundaries [Reference Wu and Zhu9, Reference Ni, Wang, Liao, Figueiredo, Li, Ringer, Langdon and Zhu35, Reference Li, Wang, Misra, Zhang, Huang and Hirth36].
From another perspective, the space for twin embryos will be smaller when the grains get smaller; therefore, the small grain cannot contain more twin embryos, which reduces the twin thickness. Specifically, on a {111} plane, the partial dislocation slip needs to be “promoted” to the next {111} plane, so that twinning partials become available on successive planes one after another in a highly corrected fashion to thicken the twin. The “promotion-to-the-next-layer” probability is as follows [Reference Zhang, Liu, Wang, Sun and Ma37]:
 $$P_{{\rm{Partials}}}^{{\rm{Promote}}} = kdP_{{\rm{reaction}}}^{{\rm{GB}}}\quad ,$$
where  $P_{{\rm{reaction}}}^{{\rm{GB}}}$ is the probability to accomplish the dislocation reaction and successfully promote identical partial slip on plane n + 1 at the GB site, d is the grain size and k is the scaling constant. From Eq. (3), one can notice that with grain size decreasing, the probability of twinning partial dislocations promotion to the next layer is decreasing. Therefore, after the nucleus of twins, it is difficult to emit twinning partial dislocations on the neighboring {111} plane, and this will lead to thinner twins. This result suggests that twinning in UFG/NC alloys with low SFE is operated via partial dislocations emission from the GBs, as indicated in Figs. 3(c) and 3(d).
Twin thickness has a significant impact on material properties [Reference Lu, Chen, Huang and Lu10, Reference Huang, Yu, Xu, Hu, Ma, Wang, Zhao, Wen, He, Liu and Tian11, Reference Li, Cao, Gao, Li and Zhu38] and applications [Reference Hsiao, Liu, Lin, Liu, Lu, Huang, Chen and Tu39]. Our results have experimentally illustrated the intrinsic relationship between grain size and twin thickness in UFG and NC materials. To optimize the mechanical properties of nanostructured materials, a physical model is urgently needed to describe the grain size effect on twin thickness in NC materials. Our results combined with the available knowledge of deformation twinning physics [Reference Meyers, Vöhringer and Lubarda14, Reference Yamakov, Wolf, Phillpot, Mukherjee and Gleiter33, Reference Ma, Xu, Zhou, Moering, Narayan and Zhu40] provide some physical insight for the development of such model. Moreover, it is of great importance to understand the physical significance of the critical grain size below which twins could not exist, and this needs to be further investigated.
Conclusions
In summary, HPT and ECAP followed by cold rolling were used to achieve a wide range of grain sizes from ∼5 to ∼500 nm in a Cu–30% Zn alloy. The grain size effect on twin thickness in UFG and NC Cu–30% Zn alloys was investigated by HRTEM observations, and a systematic statistical analysis was made. It was found that twin thickness gradually reduces to one atomic layer (a stacking fault) with decreasing grain size down below ∼20 nm. Stacking faults exist throughout the grain size range of ∼5–500 nm, while twins only present in the grains with size larger than 20 nm. This shows a similar trend with that in the coarse-grained regime, although the twinning mechanisms are different. Importantly, our results provide statistical data for building a model to predict the twin thickness in UFG and NC fcc materials, which is helpful in designing metallic materials with good mechanical properties.
Experimental
The material used in this study is a commercial Cu–30% Zn rod with a diameter of 10 mm. Its SFE is ∼7 mJ/m2, which is much lower than that of Cu (∼41 mJ/m2) [Reference Carter and Ray41]. HPT processing and ECAP followed by cold rolling were used to process a series of samples with grain sizes in the NC regime (<100 nm) and UFG regime (100–1000 nm). In the case of HPT, disks with a diameter of ∼10 mm and a thickness of ∼0.8 mm were cut from the rod and processed for five rotations under an applied pressure of 6 GPa at room temperature (RT) and a rotation speed of 1 revolution per minute, and the processing details can be found in Ref. Reference Zhao, Liao, Zhu, Horita and Langdon42. In the case of ECAP processing, the as-received rods were annealed at 600 °C for 1 h and then processed by ECAP at 220 °C for three passes using route Bc, in which the sample rod is rotated 90° after each pass, and detailed processing can be found in previous reports [Reference Zhu and Lowe43, Reference Valiev and Langdon44]. To further reduce the grain size, the ECAP-processed Cu–30% Zn rods were subjected to RT rolling with thickness reductions of ∼75% and ∼95%, respectively. The rolling direction was along the longitudinal axis of the rod. For simplicity, these samples are labeled hereafter as HPT, ECAP + 75% rolling and ECAP + 95% rolling, respectively. Microstructural characterization was performed by TEM on an FEI Titan G2 60-300 (FEI, Hillsboro, OR, USA) operated at 300 kV. The thin foils for TEM observation were carefully prepared using the standard mechanical grinding and ion-milling on a Gatan PIPS 691 facility at a voltage of 4 kV.
Acknowledgments
The authors acknowledge the financial support of the National Key R&D Program of China (2017YFA0204403), the National Natural Science Foundation of China (Grant Nos. 51741106, 51225102, and 2012CB932203), the Program for New Century Excellent Talents in University from Chinese Ministry of Education, the 8th “Liu Da Ren Cai Gao Feng” (B932203) from Jiangsu Province, China, the Fundamental Research Funds for the Central Universities (30919011256) and the Jiangsu Key Laboratory of Advanced Micro & Nano Materials and Technology. Transmission electron microscopy was performed in the Materials Characterization and Research Center of the Nanjing University of Science and Technology.