Introduction
The sense of smell, also known as olfaction, can profoundly affect an individual’s overall quality of life and emotional, physical, and social well-being.Reference Boesveldt and Parma1, Reference Croy, Symmank, Schellong, Hummel, Gerber and Joraschky2 The anterior olfactory nucleus (AON) is a critical component of the olfactory system, which plays an important role in olfactory perception, discrimination, and identification of different odors.Reference Dalal, Gupta and Haddad3 Given its critical role in olfactory processing, changes in its functional and structural properties may correspond to changes in olfactory performance.Reference Yunpeng, Han, Joshi and Hummel4, Reference Esposito, Cirillo, De, Caiazzo, Siciliano and Russo5 Recent studies have increasingly used the power of functional magnetic resonance imaging (fMRI) to better understand the function of the AON, although these are relatively rare.Reference Yunpeng, Han, Joshi and Hummel4, Reference Esposito, Cirillo, De, Caiazzo, Siciliano and Russo5 However, these studies mainly focused on functional parameters derived from fMRI, leaving structural parameters such as signal intensity (SI) and area measurements largely unexplored.
Understanding the underlying neurological mechanisms and different aetiologies of olfactory disorders is of paramount importance as it can lead to improved diagnostic accuracy, personalised treatment approaches, and improved patient outcomes. Therefore, we hypothesize that there may be significant radiological differences or a relationship between structural parameters of AON and olfactory dysfunction (OD) due to different causes.
Materials and methods
Study design and participants
Patients who had OD and underwent olfactory magnetic resonance imaging (MRI) between 2020 and 2022 were included in the study. Patients were divided into three groups based on the underlying cause of OD: post–coronavirus disease 2019 (COVID-19; CG), other post-viral (VG), and post-traumatic (TG). Detection of viral RNA or DNA, nasopharyngeal swabs, bronchial aspiration, bronchoalveolar lavage, and reverse transcriptase polymerase chain reaction (RT-PCR) tests were used to distinguish VG from CG. Patients who had previously been treated for anosmia, patients taking medications that could alter olfactory function, and patients who were pregnant or breastfeeding were excluded from the study.
Data collection
This retrospective study performed a comprehensive analysis of olfactory MRI scans obtained from patients’ electronic medical records, considering both qualitative and quantitative parameters. Threshold, Discrimination, and Identification (TDI) scores and clinical data obtained from Sniffin’ Sticks tests were evaluated by an otolaryngologist (A.A.) with 30 years of experience. The presence of anosmia, hyposmia, or parosmia was determined. In addition, parosmia scores were evaluated.
MRI evaluation
High-resolution olfactory MRI scans were acquired using a 1.5 Tesla magnetic resonance scanner with T2-weighted coronal sequences and sagittal 3D Sampling Perfection with Application-optimised Contrasts using different flip angle evolutions (SPACE) olfactory images (Slice thickness, 3mm; field of view [FOV], 220×220 mm; matrix size, 256×256). Multiplanar reconstruction (MPR) was used for better analysis and visualisation of the AON.
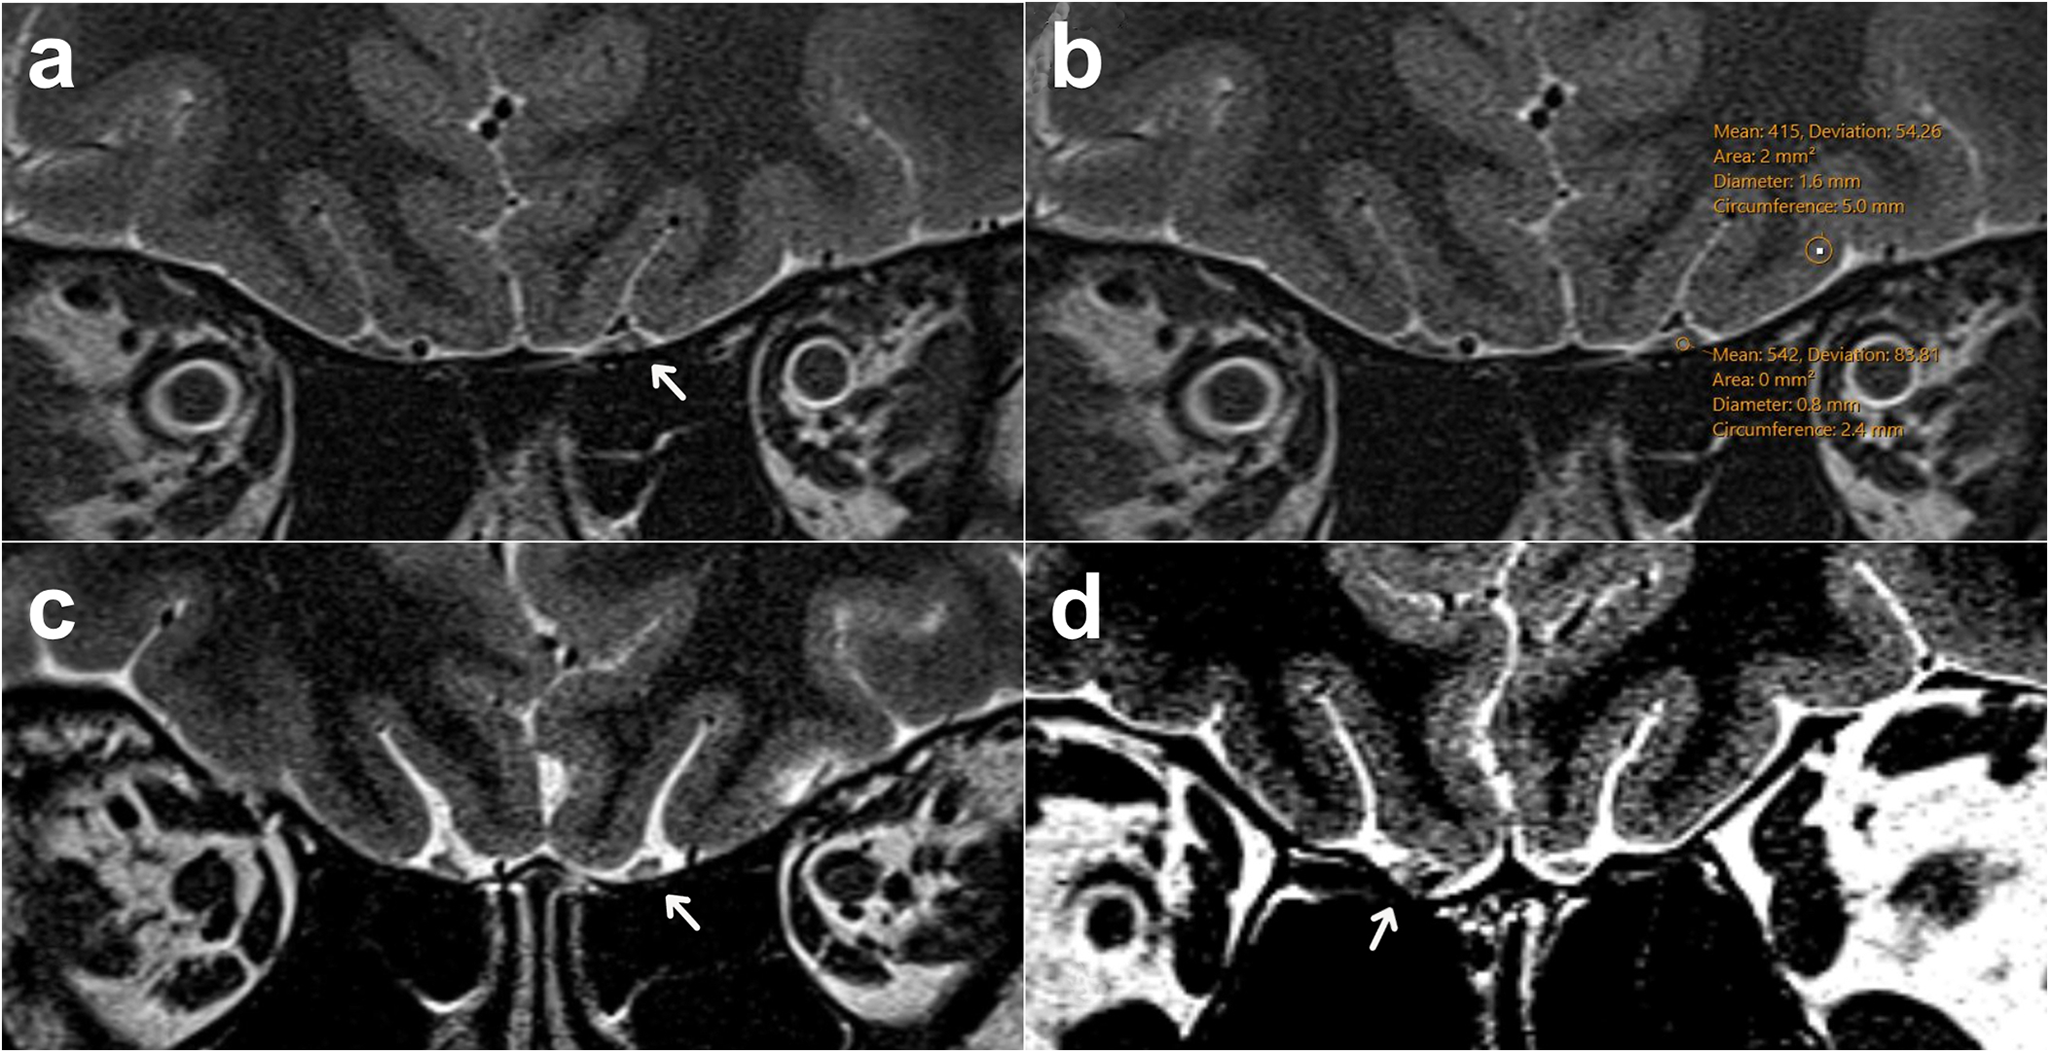
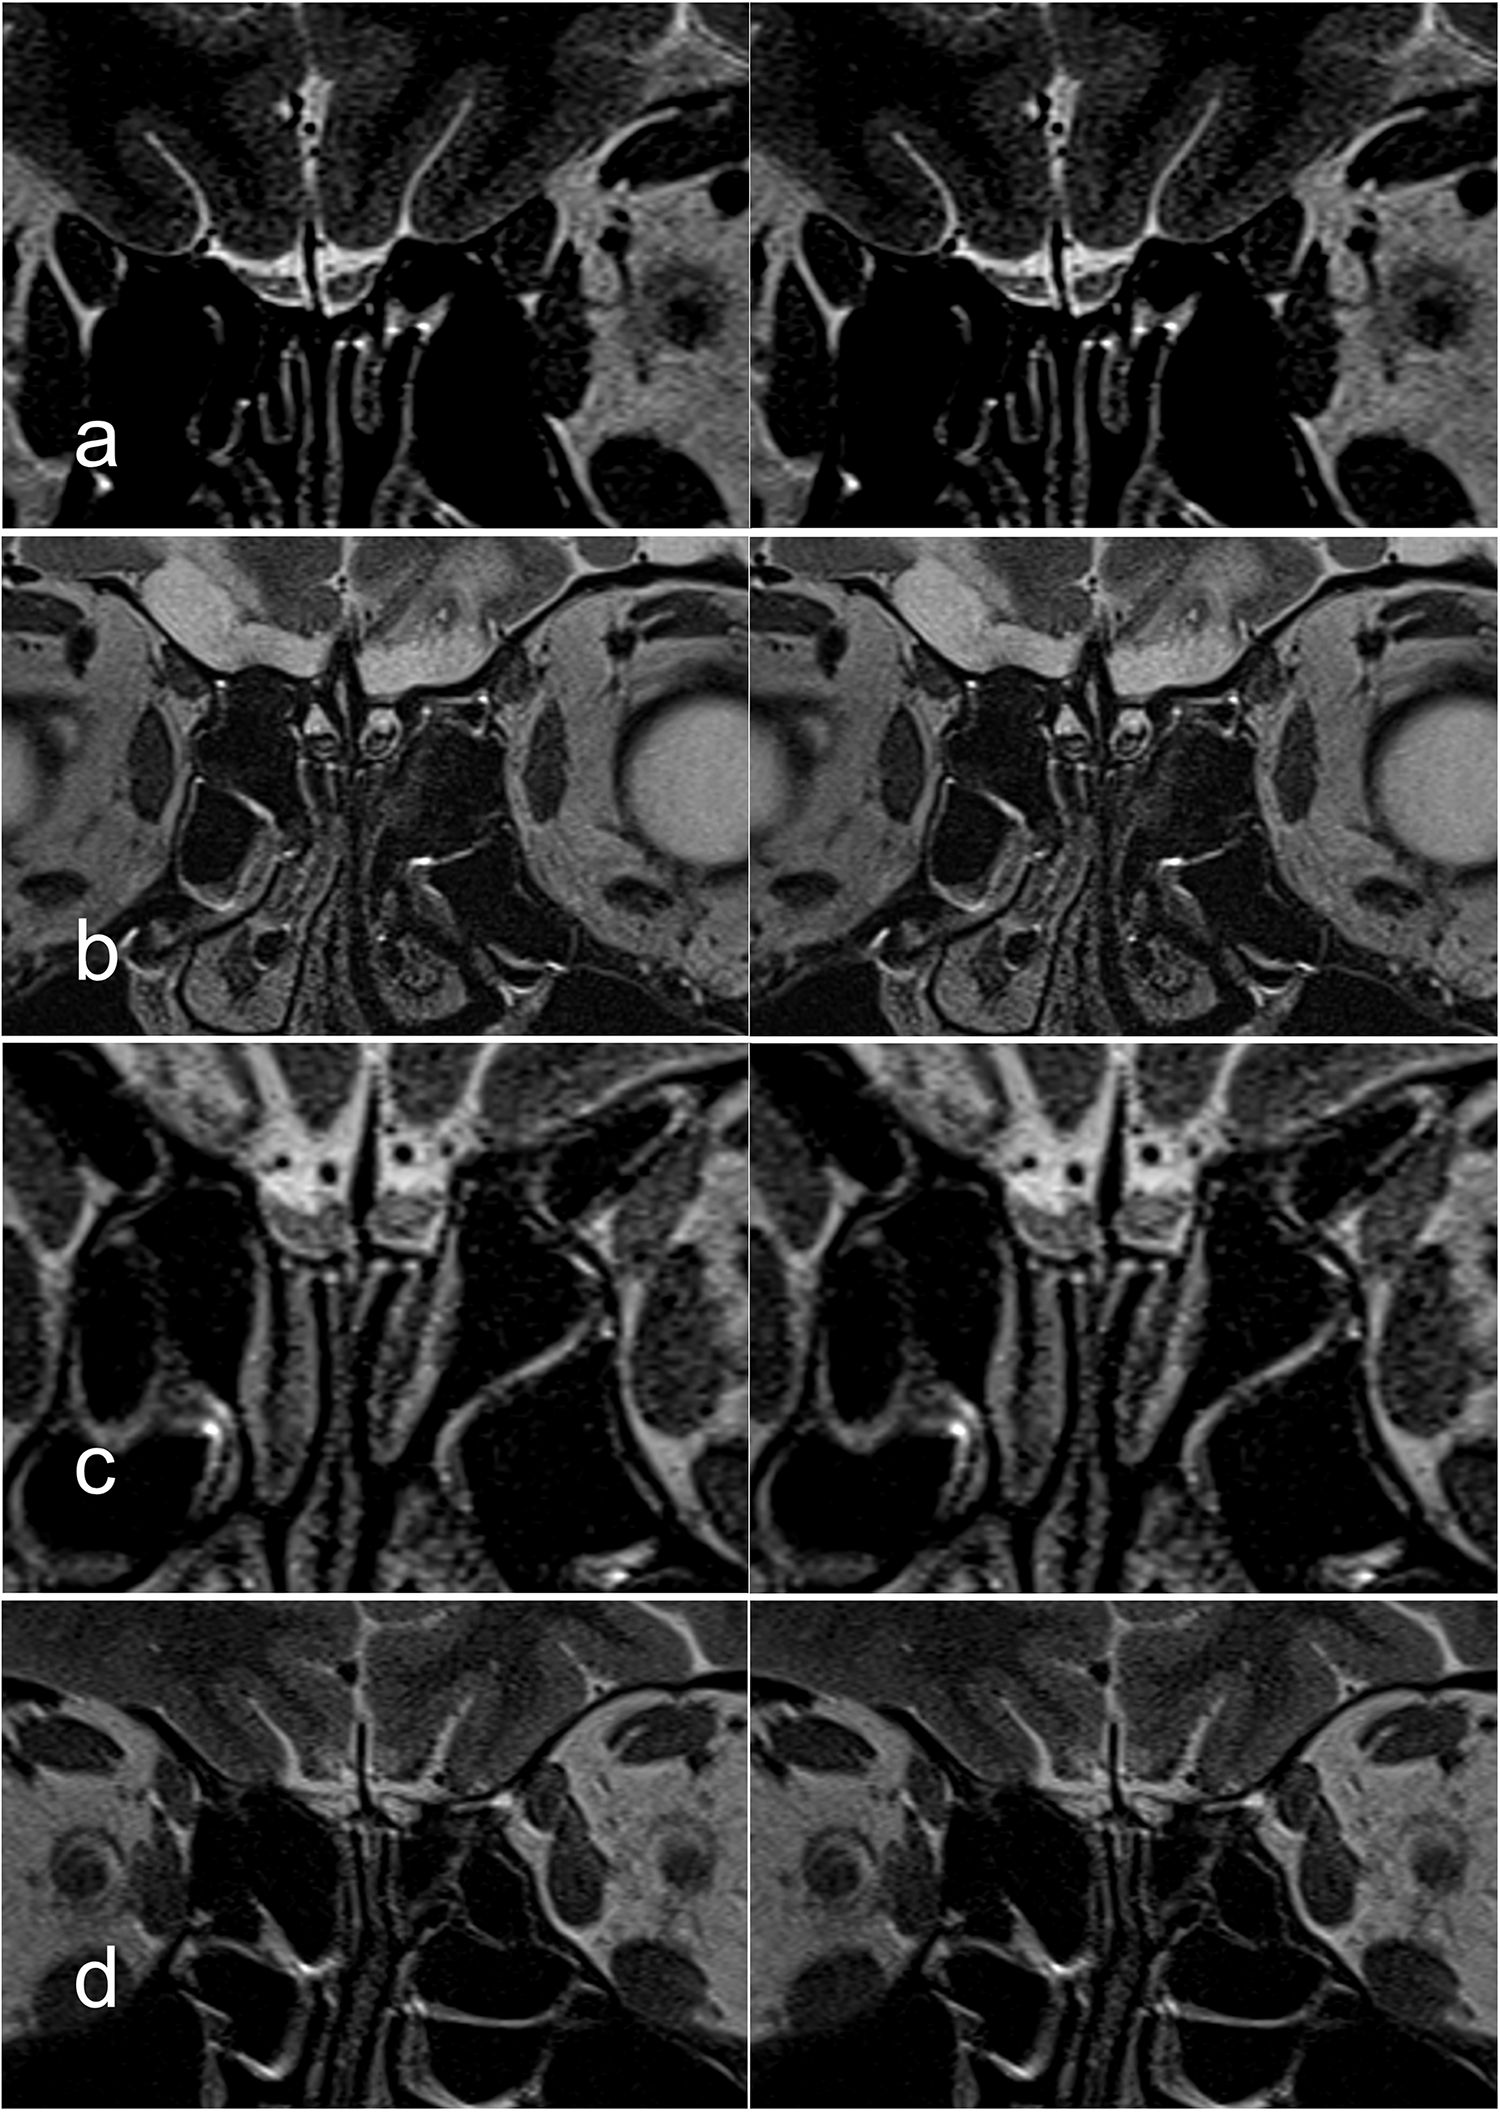
The MRI evaluation focused specifically on the posterior third segment of the olfactory bulb (OB) and the adjacent olfactory tract, on both the right and left sides.Reference Esposito, Cirillo, De, Caiazzo, Siciliano and Russo5 These areas corresponded to the projections of the AON according to histological study guidelines. The imaging findings of these patients were evaluated retrospectively by an experienced radiologist (D.Y.) with 20 years of experience in neuroradiology and olfactory imaging. This experienced observer, blinded to the identity of the subjects, manually examined the AON on magnified coronal high-resolution turbo spin echo (TSE) T2-weighted images (Figure 1). The observer documented any atrophy or abnormal SI in these regions (punctate, malasic, central), the morphology of the OB, and the location of this abnormal signal in the OB (Figures 1,2). Our previous study was taken as the reference for OB morphology evaluation.Reference Yildirim, Altundag, Tekcan, Bakir, Eryurekli and Alis6 The presence of a siderotic rim was also considered (Figures 1,2). Quantitative measurements of the AON (SI and area) were obtained to explore potential structural parameters related to olfactory function. Grey matter intensity specifically from the lateral orbitofrontal gyrus (LG) on the same slice as the AON measurements was also calculated, and to standardise the measurement for each patient, the ratio of SImean values to SI of the LG values was calculated (Figure 1).
(a) While the right AON is normal, a central focal abnormal signal increase is observed in the left AON (arrow). b) Signal intensity (SI) measurements of the pathological AON area and the grey matter. c) Focal abnormal signal increase in the inferior part of the left AON (arrow). d) Morphological degeneration and siderosis findings in the right AON localization (arrow).

Representative examples of pathological signal alterations in the olfactory bulbs (OBs) on high-resolution T2-weighted coronal MRI images. a) Punctate signal changes are demonstrated, typically observed in post-viral olfactory dysfunction. b) Siderotic signal changes with a peripheral hypointense rim appearance, predominantly seen in post-traumatic cases. c) Central hyperintense signal changes, more frequently associated with post-COVID-19-related olfactory dysfunction. d) Malasic degeneration, characterized by diffuse signal changes and structural distortion, observed in patients with post-traumatic etiology.

Statistical analyses
The statistical analysis plan was developed in consultation with a biostatistics consultant affiliated with our institution. Additionally, all analyses were carried out by a researcher with formal training in medical statistics (A.N.S.) and were cross-validated using SPSS (v29). The statistical analysis was conducted using SPSS version 29.0.2.0. The Pearson Chi-Square test was employed to assess the relationships between categorical variables. One-way analysis of variance (ANOVA) was utilised to compare the means of three or more independent groups, followed by Tukey’s honest significant difference test for post-hoc analysis to identify specific group differences. For non-parametric data, the Kruskal–Wallis test was applied to determine differences among independent groups, with the Games-Howell test used as a post-hoc analysis when the assumption of equal variances was violated. Additionally, Spearman’s correlation coefficient was calculated to assess the strength and direction of the association between ranked variables. All statistical tests were performed at a significance level of p less than 0.05.
Results
Demographic characteristics
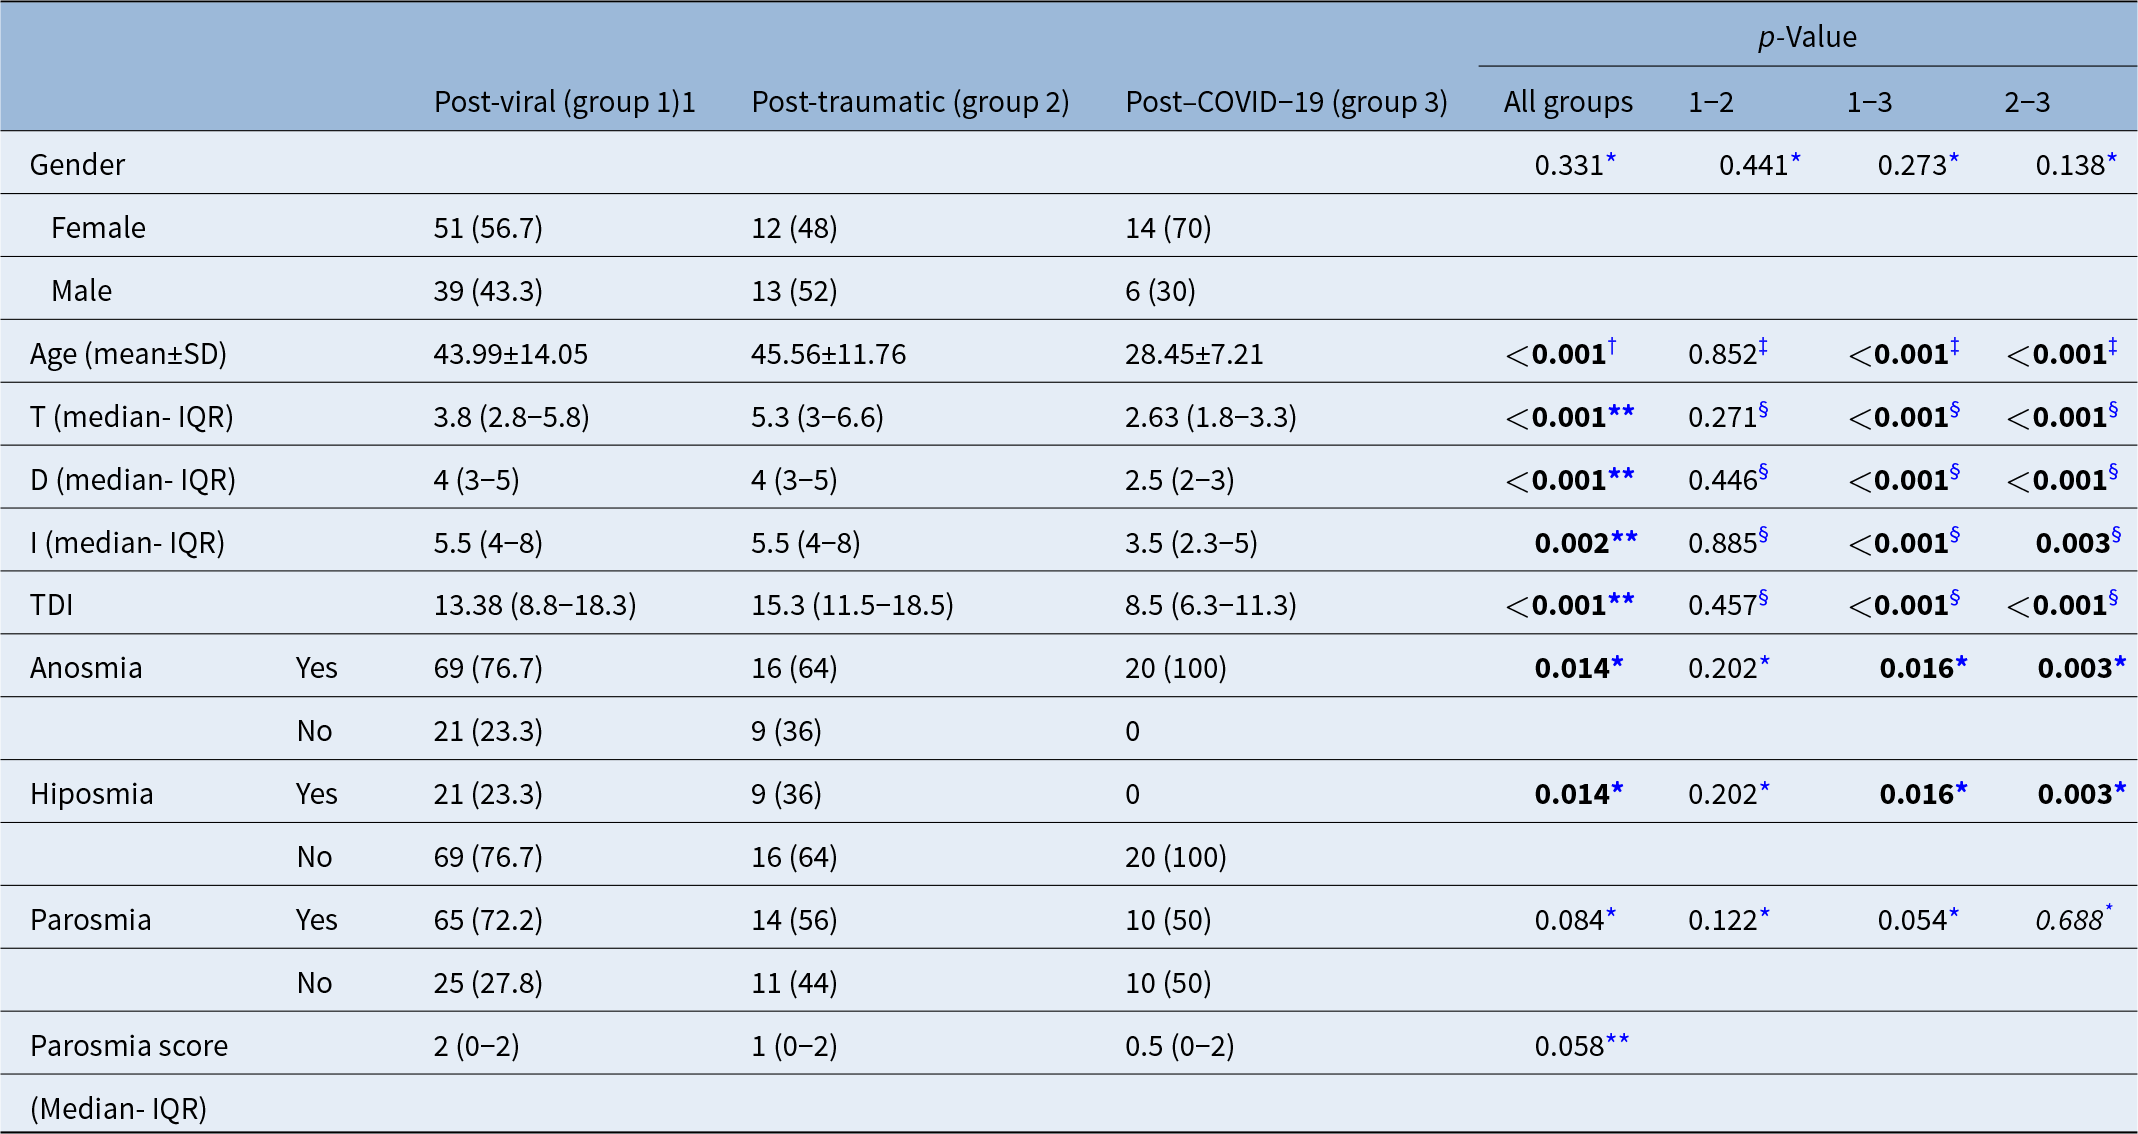
A total of 135 patients were included. The mean age of all patients was 41.98 plus or minus 13.93(18-79) years, and patients in CG were significantly younger than other groups (p < 0.001) (Table 1).
Demographic and olfactory dysfunction data according to groups

Note: The values given in boldface type are statistically significant.
* Pearson chi-squared.
† One-way analysis of variance.
‡ Tukey.
** Kruskal–Wallis test.
§ Games–Howell.
IQR = interquartile range; SD = standard deviation; TDI = Threshold, Discrimination and Identification.
A total of 43 % (n = 58) of all patients were male and 57 % (n = 77) were female. The proportion of females was higher in VG and CG, and the proportion of males was higher in TG. However, there was no significant statistical difference between the groups according to gender (p = 0331).
Clinical results
A total of 69.6 % of all patients had anosmia (n = 94), 30.4% had hyposmia (n = 41), and 66 % (n = 89) had parosmia. The incidence of anosmia was higher than hyposmia in all groups. All patients in the CG (n = 20) had anosmia (Table 1).
Parosmia was present in 66 % (n = 89) of all patients. The mean parosmia score was 2 in VG, 1 in TG, and 0.5 in CG (Table 1). No significant difference was found between the groups in terms of parosmia incidence and scores.
TDI scores
TDI values were analysed separately and also as total TDI values. Although all values were lowest in the CG, there was a significant difference in the T and D values compared to the other groups (p < 0.01). The mean TDI values were 13.38 (8.8-18.3) in the VG, 15.3 (11.5-18.5) in the TG, and 8.5 (6.3-11.3) in the CG. The lowest TDI score was in the CG and was significantly lower than in the other groups (p < 0.01) (Table 1).
Morphological changes and abnormal signal localisation on MRI
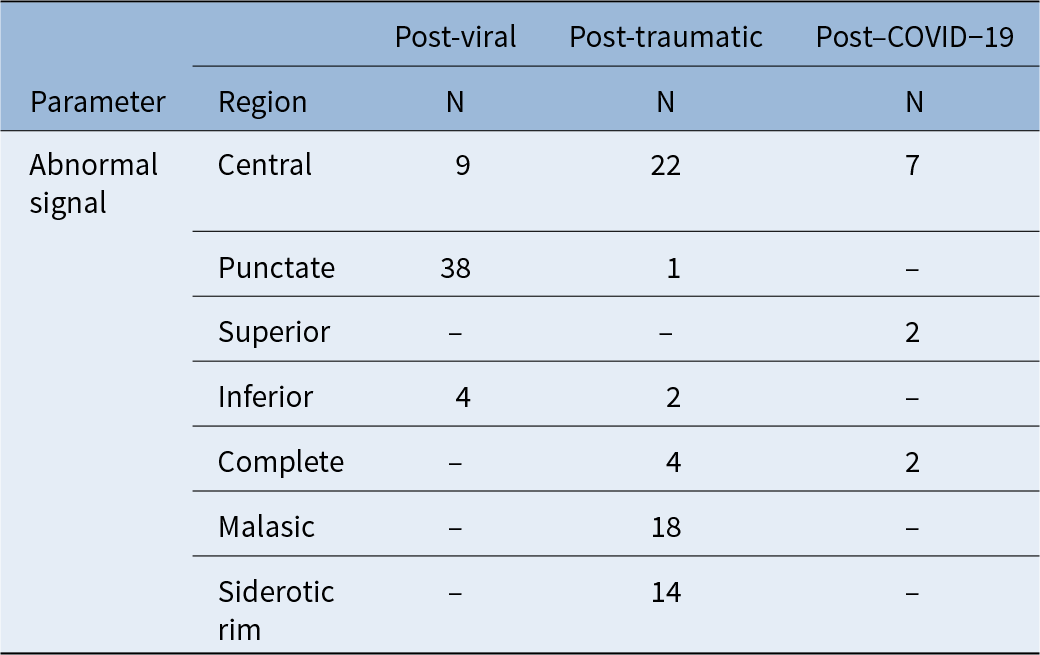
In the total of 135 patients and 270 AONs, 92 right, left, or bilateral signal changes of AONs in 75 patients (55.5%) were observed (Table 2). While the dominant abnormal signal pattern was punctate in the VG, central signal changes were more frequent in the TG and CG. In addition, TG showed 18 malasic changes of OBs in 10 patients and 14 siderotic rims in 8 patients (Table 2). These changes were not observed in VG or CG.
Localizations of the abnormal signal changes of olfactory bulbs in MRI according to group

COVID-19 = coronavirus disease 2019; MRI = magnetic resonance imaging.
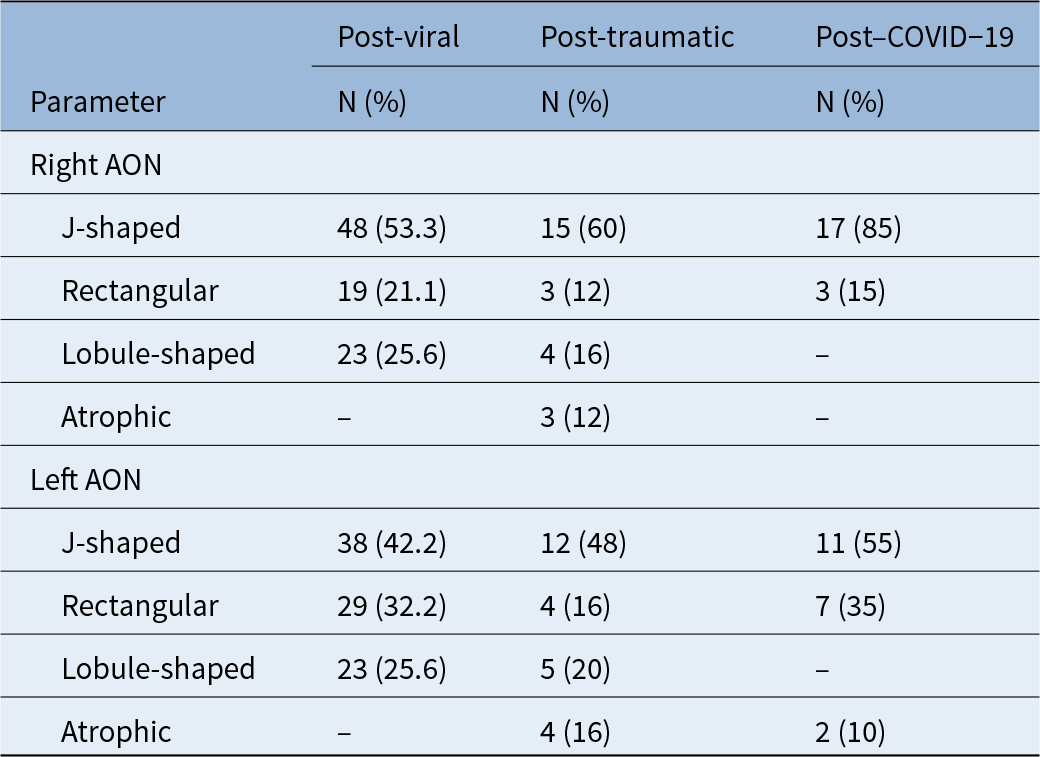
The left and right OB shapes were analysed separately. Three main shapes were found in each group: J-shaped, rectangular, and lobular-shaped. The morphological findings showed that three patients in the TG had bilateral, and one patient had left OB atrophy. These patients did not progress to the later stage of the study.
The most common morphology on both sides in all groups was the J-shape. The rectangular shape was similar between groups, while the lobular shape was never seen in CG, total OB atrophy was only seen in TG (Table 3).
Distribution of olfactory bulb shapes in MRI according to group

AON = anterior olfactory nucleus; COVID-19 = coronavirus disease 2019; MRI = magnetic resonance imaging.
Quantitative measurements of AON on MRI
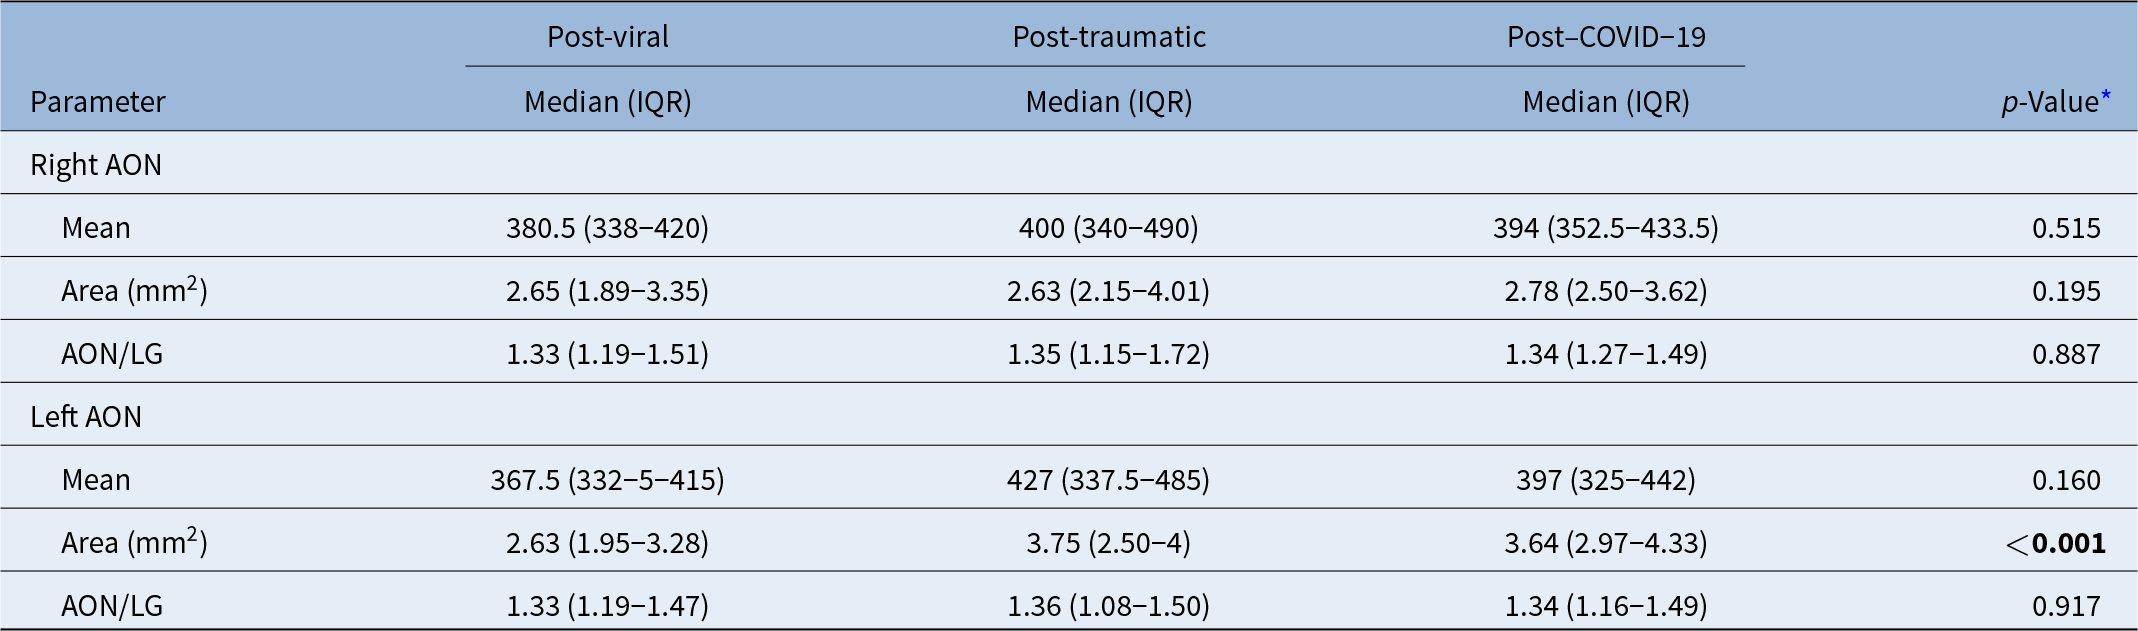
The SI mean of the right AON was 380.5 (338-420) in the VG, 400 (340-490) in the TG, and 394 (352.5-433.5) in the CG. The SI mean of the left AON was 367.5 (332-5-415) in the VG, 427 (337.5-485) in the TG, and 397 (325-442) in the CG. No statistically significant difference was found between the SI values according to the groups (Table 4).
Quantitative measurements of anterior olfactory nucleus in MRI

Note: The value given in boldface type is statistically significant.
* Kruskal–Wallis test.
AON = anterior olfactory nucleus; COVID-19 = coronavirus disease 2019; IQR = interquartile range; LG = lateral orbitofrontal gyrus; MRI = magnetic resonance imaging.
The right AON/LG signal ratio was 1.33 in the VG, 1.35 in the TG and 1.34 in the CG. The left AON/LG signal ratio was 1.33 in VG, 1.36 in TG and 1.34 in CG. No statistically significant difference was found between the groups regarding the right and left AON/LG signals (Table 4).
The mean area of the right AON was 2.65(1.89-3.35) mm2 in the VG, 2.63(2.15-4.01) mm2 in the TG and 2.78 (2.50-3.62) mm2 in the CG. The mean area of the left AON was 2.63 (1.95-3.28) mm2 in VG, 3.75 (2.50-4) mm2 in TG, and 3.64 (2.97-4.33) mm2 in CG. Although no significant difference was found between the groups in terms of right AON areas, left AON areas were significantly lower in VG than in the other groups (Table 4).
Analysis of the correlation between TDI and quantitative AON changes
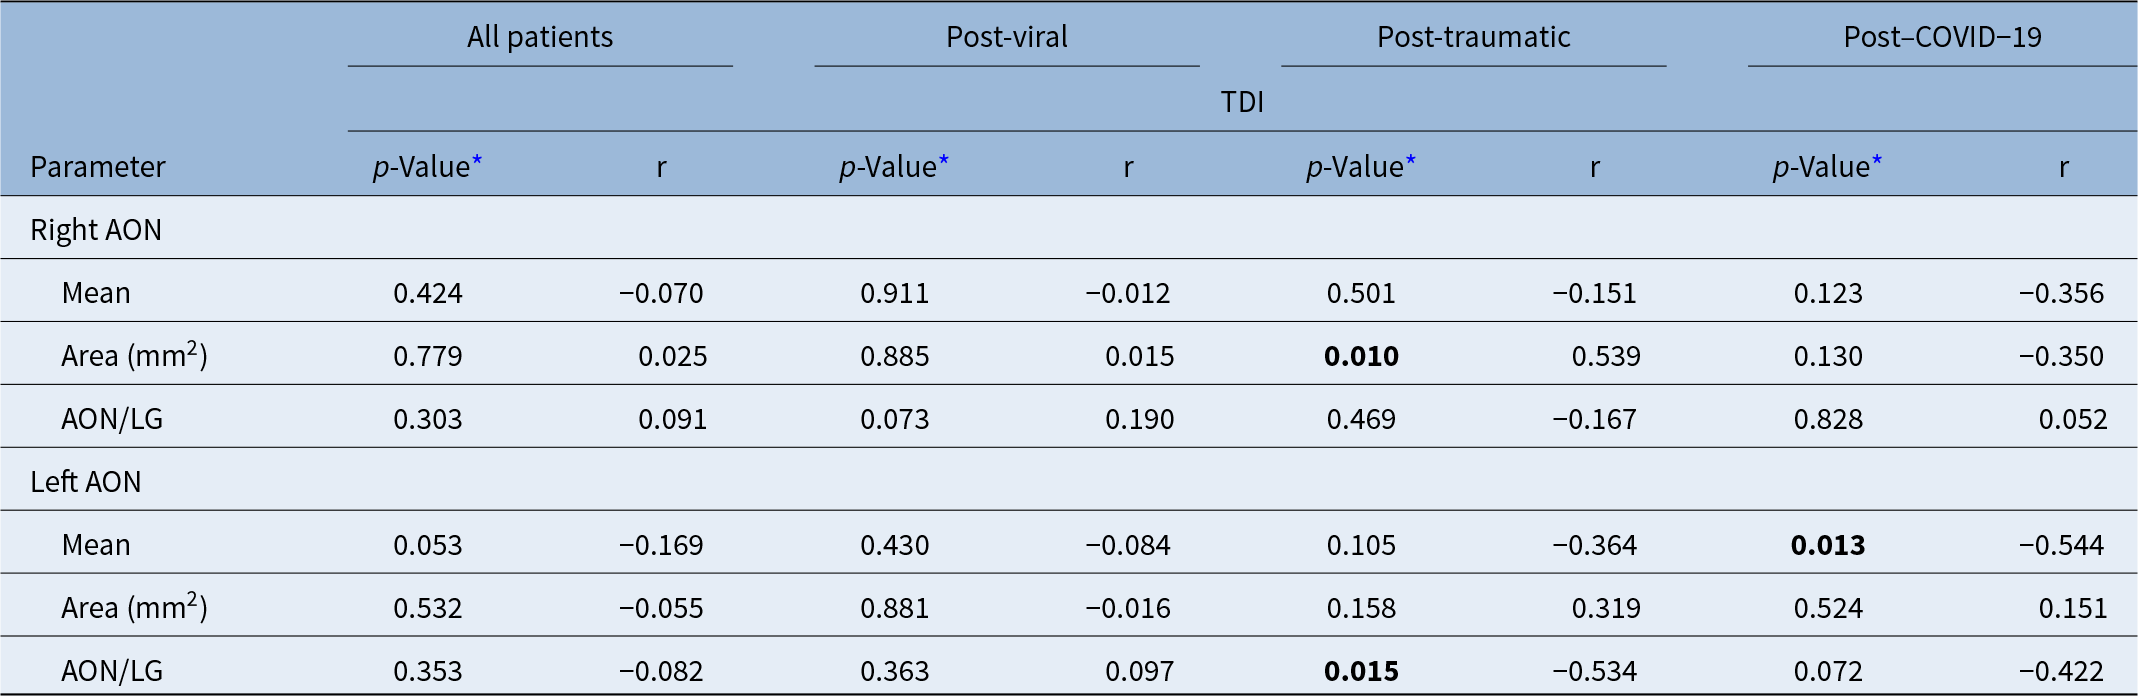
When all patients were included, no significant statistical difference was found between TDI and AON SImean, AON/LG signal ratio, and AON areas. When evaluated according to the groups, a significant correlation was found only between TDI and right AON area (p = 0.010) and left AON/LG ratio (p = 0.015) in TG and only left AON SImean (p = 0.013) in CG. No significant correlation was found between the SImean, AON/LG signal ratio and AON area with TDI in the other groups (p > 0.05) (Table 5).
Evaluation of the relationship between TDI and quantitative anterior olfactory nucleus changes in MRI according to group

Note: The values given in boldface type are statistically significant.
* Spearmans correlation test.
AON = anterior olfactory nucleus; COVID-19 = coronavirus disease 2019; LG = lateral orbitofrontal gyrus; TDI = Threshold, Discrimination and Identification.
Discussion
Animal studies, particularly in mice, and human studies have shown that AON is associated with olfactory functions.Reference Kondoh, Yamada, Shioda and Torii7, Reference Muir, Biju, Cong, Rogers, Torres and Duong8 Except for the olfactory pathways, the connection of the AON with the hypothalamus, the mammillary bodies, the prelimbic and infralimbic regions of the medial prefrontal cortex, the amygdaloid areas, and the lateral habenular nucleus has been revealed, but its mystery is still not solved.Reference Brunert, Medinaceli Quintela and Rothermel9 Concerning these pathways, AON activity is thought to be associated with some functions, such as social behavior and social relationships, spatiotemporal navigation, and perceptual homogeneity.Reference Brunert, Medinaceli Quintela and Rothermel9 However, human studies on AON are very limited, and generally, post-mortem changes in AON have been analysed in humans.Reference Son, Steinbusch, López-Iglesias, Moon and Jahanshahi10, Reference Gardner, Dieriks, Cameron, Mendis, Turner and Faull11 With our experience in COVID-19-associated anosmia/parosmia and our previous studies on post-viral and post-traumatic olfactory loss, we realised that the AON does indeed show some changes in OD associated with these diseases. As part of our observations, we aimed to categorise the changes in the AON into different subgroups, both as signal and morphological changes using MRI, to investigate whether these changes are related to the degree of OD and to determine whether MRI findings will be useful in predicting the aetiology. The results of this study showed that the morphological and signal changes of the AON on MRI are not related to the cause or severity of OD.
Demographic characteristics
Although the demographic results of this study do not show any significant statistical differences between the groups according to gender, it is seen that there are more women in VG and CG, and more men in TG. This may indicate a different gender distribution in the different disease groups. In addition, CG patients were significantly younger than both TG and VG, suggesting that age may be an influential factor in disease involvement, characteristics, or progression in this population. In many studies evaluating these three groups separately or together, the average age and gender distribution differ.Reference Altundag, Saatci, Sanli, Duz, Sanli and Olmuscelik12–Reference Pellegrino, Farruggia, Small and Veldhuizen16 That means, the mean age and sex distribution of the groups in different studies may vary depending on the cohort included.
Anosmia–hyposmia–parosmia
In terms of clinical outcomes, anosmia was predominant in our cohort, reported by approximately 78 % of all participants. Importantly, all individuals in the CG group experienced anosmia. In Gunder and Hummel’s study on OD related to COVID-19, it was shown that 84 % of patients experienced OD, and 49 % of them had parosmia.Reference Gunder and Hummel14 In our previous study, in which we included different patients and compared patients with post-infectious and COVID-19–related OD, similar to this study, it was shown that all COVID–19–related patients were anosmic, while 81.4 % of post-infectious cases were anosmic and 18.6 % were hyposmic.Reference Yildirim, Kandemirli, Tekcan Sanli, Akinci and Altundag17 Although different rates have been reported in different studies depending on the degree of trauma, it has been shown that approximately 48–78 % of patients experience anosmia, 5-27.4 % hyposmia, and 25-33 % parosmia or abnormal sense of smell.Reference Menzel, Haehner, Woosch, Marquardt, Ressel and Draf18–Reference Collet, Grulois, Bertrand and Rombaux20 On the other hand, depending on the underlying aetiology or the degree of damage, ODs may change, regress, or even disappear over time spontaneously or with treatment. Cavazzana et al. reported that 46 % of patients with post-viral anosmia and 35 % of patients with post-viral hyposmia showed improvement in olfactory function over time.Reference Cavazzana, Larsson, Münch, Hähner and Hummel21 Therefore, the interval between the aetiological cause and the study, and also the treatment status, may affect the rates of anosmia, hyposmia, and parosmia.
TDI scores
In this study, it was observed that TDI values were lowest in the CG and similar in VG and TG. Collet et al. found a positive correlation between OB and TDI in cases of post-traumatic OD.Reference Collet, Grulois, Bertrand and Rombaux20 Rombaux et al. showed that the recovery rates of OD in post-infectious and post-traumatic patients are related to the larger OB volumes.Reference Rombaux, Huart, Deggouj, Duprez and Hummel22 However, this positively correlated relationship between OB and TDI was not found between the AON and TDI in our study. This result raises the question that areas other than the AON in the OB may be more related to olfactory function. However, it is possible that TDI values increased spontaneously without treatment over time during the follow-up period in COVID–19–related and post-viral OD patients.Reference Cavazzana, Larsson, Münch, Hähner and Hummel21, Reference Tervo, Jacobson, Vilarello, Saak, Caruana and Gallagher23 Therefore, it is also important to know when the TDI measurement was performed since the disease, and we think that this may affect the results.
MRI findings
The MRI findings provided other interesting insights. The presence of bilateral OB atrophy in some patients and abnormal AON signals in a large number of participants in all groups suggests a possible involvement of both OB and AON in the pathophysiology of these conditions. Punctate signal changes were more common in VG, whereas central signal changes were more common in TG and CG. In addition, a malasic appearance and a siderotic rim were only observed in TG. In light of these results, if malasic OB or a siderotic rim is seen, it may be possible to think about OD secondary to trauma. In particular, the shape of the OB was found to differ between groups. While lobular shape was never observed in CG, total atrophy was only observed in TG.
Quantitative measurements
In this study, no significant statistical difference was found between the groups for mean AON signal, AON/LG SI ratio, and right AON area. Based on these results, it does not seem possible to determine the aetiology using the AON signal or area.
Limitations
To our knowledge, there is no other study of MRI changes in the AON covering these three different diseases affecting the sense of smell in living people. Therefore, this study is pioneering. However, the study has some limitations. Although the number of patients is quite large, the distribution of the number of patients between the groups is unbalanced when they are divided into subgroups. The 3-mm slice thickness may have limited spatial resolution; however, high in-plane resolution and expert manual segmentation minimised this effect. Still, partial volume averaging remains a methodological limitation. In addition, the cross-sectional design of this retrospective study means that we cannot conclude causality or the progression of these conditions over time. Furthermore, a substantial number of patients were referred from outside institutions, as our centre functions as a tertiary referral site for olfactory disorders. Many participants traveled from other cities or even internationally, which limited our access to their follow-up clinical and imaging data. As a result, longitudinal assessment of olfactory recovery and serial MRI evaluations could not be performed. A future follow-up study involving patients who return for reassessment is planned to investigate temporal changes in AON morphology and their potential prognostic value. Since there was no healthy control group in the study, it cannot provide information about how these variables change compared to the normal population. Since the time of the first disease and the interval between the olfactory tests and MRI examinations were not known in the patient groups, spontaneous temporal changes over time may affect the results of the study. The lack of precise data regarding the time interval between symptom onset and MRI acquisition may affect the interpretation of imaging findings due to possible spontaneous recovery or evolving pathology. This limitation has been acknowledged, and ongoing prospective studies in our centre aim to longitudinally investigate AON signal changes in relation to clinical progression and treatment response. A second-phase analysis is planned to explore these dynamic associations in a larger cohort.
Conclusion
Although various pathological signal changes and morphological degenerations in the AON were detected by MRI in the majority of patients with post-viral, post-traumatic, and COVID-19–related OD, no clear relationship between the aetiology and TDI values with AON changes was found. The fact that such a critical station does not appear to be related to aetiopathogenesis and TDI scores in statistical analyses may be due to the exaggeration of the function of this nucleus in the literature or the small number of human studies. Nevertheless, it would be beneficial for the literature to study this issue in more detailed ways, perhaps with higher (>3 Tesla) power MRI units.
• The anterior olfactory nucleus (AON) is related to the limbic, prelimbic, and infralimbic system pathways, especially olfaction.
• AON is localised in approximately the posterior third of the olfactory bulb.
• Since AON can only be evaluated with high-resolution and small-field magnetic resonance imaging, there are very few studies on this subject.
• No relationship was found between quantitative values such as AON signal intensity and area and threshold, discrimination, ıdentification (TDI).
• Changes in AON are not decisive in terms of olfactory dysfunction aetiology.
Compliance with Ethical Standards
Disclosure of potential conflicts of interest
The authors declare that there is no conflict of interest.
Ethical statement
This study was conducted in accordance with the ethical principles outlined in the Declaration of Helsinki. Ethical approval was obtained from the Gaziantep University Clinical Research Ethics Committee on May 26, 2021 (Approval No: 2021-09/24). Due to the retrospective nature of the study and the use of anonymised patient data, the requirement for informed consent was waived.
Research involving human participants and/or animals
All procedures performed in this study were in accordance with the ethical standards of the institutional and/or national research committee and with the 1964 Helsinki Declaration and its later amendments or compareable ethical standards.
Informed consent
Patients were not required to give their informed consent for inclusion in this retrospective study, because we used anonymous clinical data; individuals cannot be identified according to the data presented.