The escalation of antibiotic resistance has emerged as one of the most formidable challenges facing global public health and food security in the twenty-first century (Vivekanandan et al., Reference Vivekanandan, Kumar, Jaysree and Rajeshwari2025). The overuse and misuse of antibiotics in livestock farming have been identified as primary drivers of the dissemination of antibiotic resistance genes (ARGs; Huang et al., Reference Huang, Xing and Wang2025). Horizontal gene transfer (HGT) is the principal mechanism driving the rapid evolution of bacterial resistance, with conjugation mediated by plasmids being the most prevalent pathway (Laroussi et al., Reference Laroussi, Aoudache, Robert, Libante, Thiriet and Mias-Lucquin2022; Maphosa et al., Reference Maphosa, Moleleki and Motaung2023). Conjugation requires direct cell-to-cell contact between a donor and a recipient bacterium. These genetic determinants can be transferred from animal-associated bacteria to human pathogens through the food chain and environmental pathways, posing severe risks to human health (Bento et al., Reference Bento, Gomes-Gon Alves, Cruz, Esteves, Baptista and Aires Pereira2025). Consequently, a global shift towards antibiotic-free breeding is underway, with strict regulations banning the use of antibiotic growth promoters in feed implemented in the European Union, China and other major economies (Jiang et al., Reference Jiang, Yang, Lei, Li, Chen and Jiang2025). This regulatory pressure has catalysed an urgent search for green, safe and efficient alternatives that can maintain animal intestinal health and performance without exacerbating antibiotic resistance.
The potential of clay minerals as feed ingredients has attracted considerable attention (Nadziakiewicza et al., Reference Nadziakiewicza, Kehoe and Micek2019; Pacífico et al., Reference Pacífico, Hartinger, Stauder, Schwartz-Zimmermann, Reisinger, Faas and Zebeli2021). Montmorillonite (MMT), a typical 2:1 phyllosilicate clay mineral, stands out due to its unique layered nanostructure, large specific surface area and high cation-exchange capacity (Parisi et al., Reference Parisi, Lazzara, Merli, Milioto, Princivalle and Sciascia2019; Wang et al., Reference Wang, Li, Ge, Dai, Rao, Ran and Zhang2021). These physicochemical properties endow MMT with exceptional adsorption capabilities. In animal production, MMT is widely used to sequester mycotoxins (e.g. aflatoxins) and immobilize pathogenic bacteria (e.g. Escherichia coli, Salmonella) within the gastrointestinal tract, thereby preventing diarrhoea and improving nutrient digestibility (Moosavi, Reference Moosavi2017; Xu et al., Reference Xu, Hong, Wang, Cong, Dai and Wang2017; Alasmar et al., Reference Alasmar, Ul-Hassan, Zeidan, Al-Thani, Al-Shamary and Alnaimi2020). Experimental evidence in broiler chickens demonstrates that calcined MMT significantly reduces the oral bioavailability of aflatoxin G1 by increasing gastrointestinal adsorption (Rejeb et al., Reference Rejeb, Baere, Devreese, Ducatelle, Croubels and Ayed2020). Furthermore, dietary supplementation with MMT-based clay binders has been shown to mitigate aflatoxin B1 toxicity, effectively improving growth performance while reducing hepatic lesions and alleviating immunosuppression (Zabiulla et al., Reference Zabiulla, Malathi, Swamy, Naik, Pineda and Han2021). Furthermore, studies have confirmed that MMT significantly affects ARG transfer. MMT releases metal ions (e.g. Fe3+, Al3+) at low concentrations (0.005 g L–1), increasing plasmid conjugation by three-fold; conversely, high concentrations (5 g L–1) suppress transfer via DNA adsorption (Sheng et al., Reference Sheng, Qin, Yang, Hu, Liu and Waigi2019; Wu et al., Reference Wu, Wu, Huang and Cai2021). Nanoparticles (<100 nm) exhibit stronger adsorption, further reducing ARG mobility (Sheng et al., Reference Sheng, Qin, Yang, Hu, Liu and Waigi2019).
Although the physical adsorption capacity of MMT is well-documented, its impact on the HGT of ARGs remains poorly understood. Because conjugation requires direct cell-to-cell contact, solid surfaces can significantly influence this process. On the one hand, mineral surfaces might sequester bacteria, physically separating them or inducing stress that inhibits plasmid transfer. On the other hand, porous or layered mineral structures could act as scaffolds that concentrate bacteria, increase local cell density and align cells in orientations that facilitate pili formation and mating pair stabilization (Massoudieh et al., Reference Massoudieh, Mathew, Lambertini, Nelson and Ginn2007; Oppenheimer-Shaanan et al., Reference Oppenheimer-Shaanan, Sibony-Nevo, Bloom-Ackermann, Suissa, Steinberg and Kartvelishvily2016).
Current research primarily focuses on the removal efficiency of bacteria, often overlooking the biological fate of pathogens and the genetic consequences of their accumulation on mineral surfaces. There is a lack of data quantifying the dose-dependent effects of natural MMT on the conjugative transfer frequency of resistance plasmids. Therefore, this study aims to evaluate the removal kinetics of MMT towards multidrug-resistant (MDR) E. coli and its subsequent impact on bacterial growth and plasmid conjugation frequency. We aim to clarify the trade-off between pathogen immobilization and genetic risk and to provide essential data for the safety assessment of clay or clay mineral-based feed ingredients.
Materials
Bacterial strains and MMT
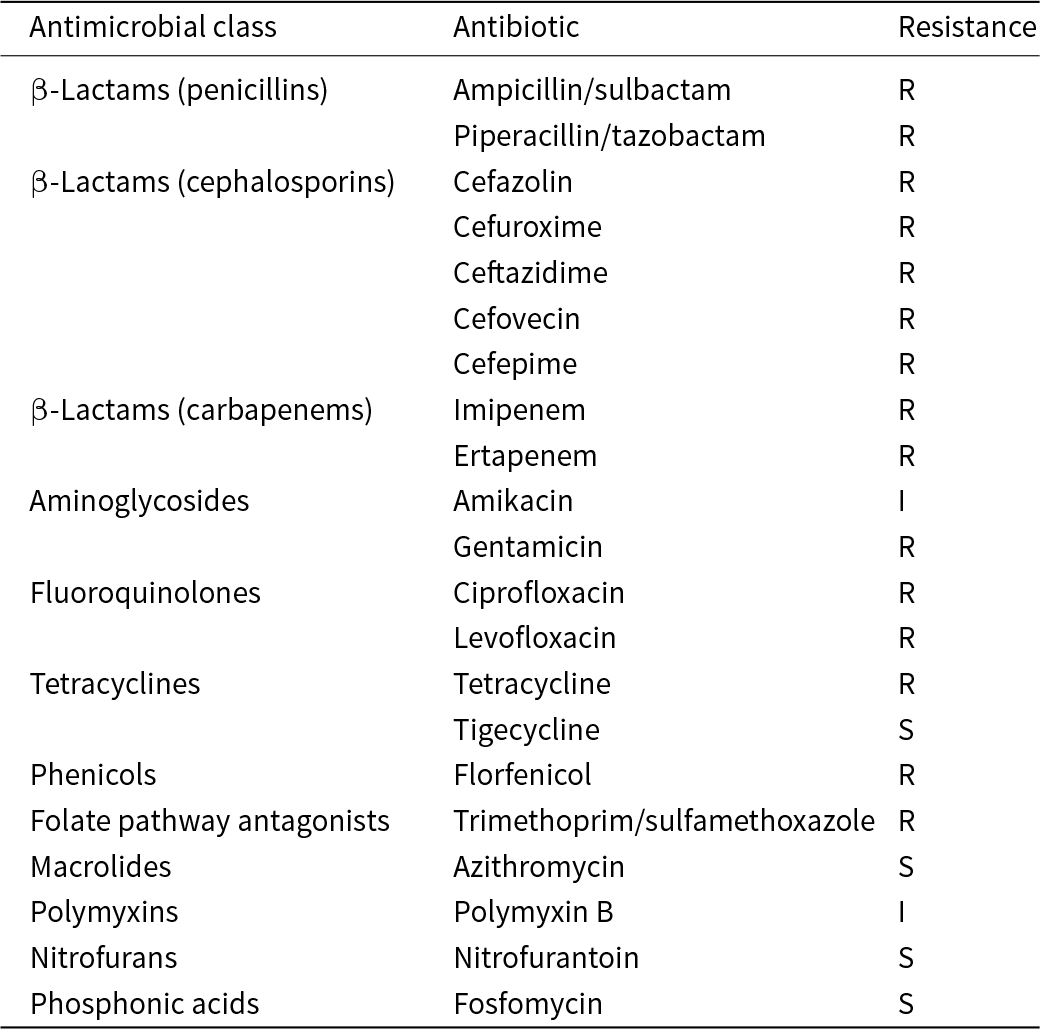
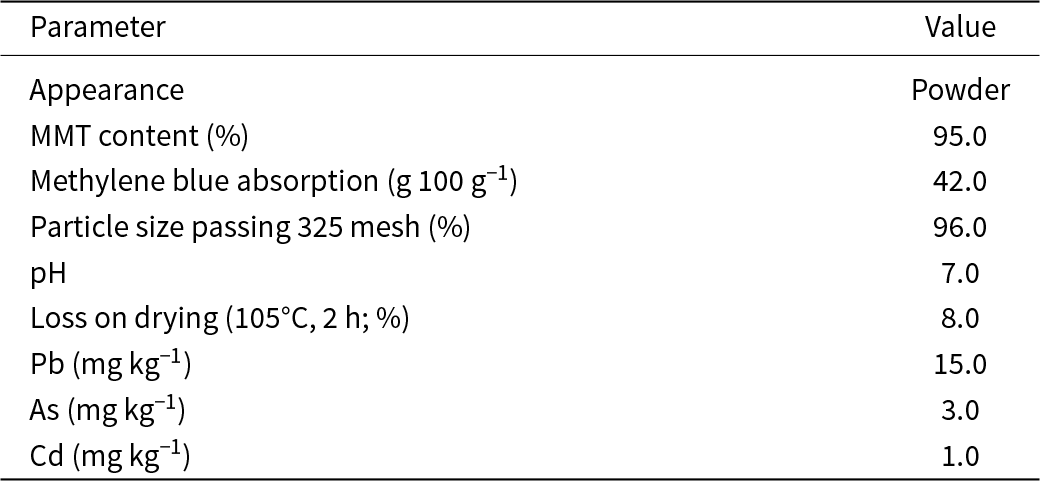
A faecal isolate of MDR E. coli was obtained from a commercial broiler farm in Gaocun, Ningguo, Anhui, China. This isolate was used for the removal assays, and its antibiotic resistance profile is shown in Table 1. E. coli DH5α carrying the conjugative plasmid RP4 (encoding bla TEM-2, aph(3’)-Ib and tetA) served as the donor in the conjugation experiments. This donor exhibited resistance to ampicillin, kanamycin and tetracycline. E. coli HB101, which is resistant to streptomycin, served as the recipient in the conjugation assays. The premium feed-grade natural calcium-based MMT (Ca-MMT) used in this study was sourced from Chifeng, Inner Mongolia, China. The detailed physicochemical properties and heavy metal contents of the Ca-MMT, as provided by the manufacturer, are summarized in Table 2.
Antibiotic resistance profile of MDR E. coli.

Table 1 Long description
The table reports antimicrobial susceptibility results for an MDR E. coli isolate, listing each antibiotic by drug class and its interpretation as susceptible, intermediate, or resistant. The isolate is resistant to all tested penicillins with inhibitors and to multiple cephalosporins, including cefazolin, cefuroxime, ceftazidime, cefovecin, and cefepime. It is also resistant to the carbapenems imipenem and ertapenem. Outside beta-lactams, it is resistant to gentamicin, ciprofloxacin, levofloxacin, tetracycline, florfenicol, and trimethoprim with sulfamethoxazole. Limited activity is seen as intermediate for amikacin and polymyxin B. Susceptibility is retained for tigecycline, azithromycin, nitrofurantoin, and fosfomycin. Results are based on microbroth dilution testing and should be interpreted using the study’s stated breakpoint criteria.
Note: Antimicrobial susceptibility testing was performed using the microbroth dilution method in accordance with Clinical and Laboratory Standards Institute (CLSI) M100 (34th edition).
I = intermediate; R = resistant; S = susceptible.
Physicochemical properties and heavy metal contents of the Ca-MMT.

Table 2 Long description
The table lists physicochemical properties and heavy metal contents for a Ca-MMT material. It is described as a powder with an MMT content of 95 percent. Methylene blue absorption is 42 grams per 100 grams, and 96 percent of particles pass a 325 mesh size. The pH is 7, indicating a neutral material. Loss on drying after heating at 105 degrees Celsius for 2 hours is 8 percent, suggesting moderate moisture or volatile content. Heavy metals are reported at 15 milligrams per kilogram for lead, 3 milligrams per kilogram for arsenic, and 1 milligram per kilogram for cadmium. No regulatory limits or uncertainty information are provided, so the values cannot be judged for compliance or variability from this table alone.
Experimental
Removal assays
The removal of MDR E. coli by MMT was evaluated in Luria–Bertani (LB) broth with a total reaction volume of 5 mL in sterile centrifuge tubes. MMT was sterilized by autoclaving prior to use. Overnight bacterial cultures were adjusted to an optical density at 600 nm (OD600) of 0.5, which corresponds to an initial bacterial concentration of ∼108 colony-forming units per millilitre (CFU mL–1). The bacterial suspensions were diluted 100-fold to ∼106 CFU mL–1 and then subjected to three different experimental conditions at 37°C with shaking at 120 rpm. First, the bacterial suspension was mixed with MMT at final concentrations of 0, 2.5, 5, 10 and 20 mg mL–1 and incubated for 1 h. Second, the bacterial suspension was mixed with 0 or 5 mg mL–1 MMT and incubated for 7.5, 15, 30, 60, 120 and 240 min. Third, the bacterial suspension was mixed with 0 or 5 mg mL–1 MMT and incubated for 2, 4, 6, 8, 10, 12, 14, 16 and 24 h.
Following incubation, the mixtures were centrifuged at 50 × g for 5 min. Validated by supernatant plating, this low-speed centrifugation pelleted the MMT–bacteria complexes while leaving free planktonic cells largely unsedimented. The supernatant containing unremoved bacteria was collected, serially diluted and spread onto LB agar plates. The limit of detection for the plate counting method was 10 CFU mL–1. After incubation at 37°C for 24 h, CFUs were counted.
The bacterial removal performance was evaluated by the removal amount per unit mass of MMT (qt, CFU g–1) and the removal efficiency, which were calculated using Equations 1 & 2:
 \begin{equation}{q_t} = \left( {{C_{{\text{con}}}}-{C_{{\text{exp}}}}} \right) \times V/m\end{equation}
 \begin{equation}{\text{Removal efficiency}}\left( \% \right) = \left( {{C_{{\text{con}}}}-{C_{{\text{exp}}}}} \right)/{C_{{\text{con}}}} \times {\text{ }}100\% \end{equation}
where C con and C exp are the bacterial concentrations (CFU mL–1) in the control group (0 mg mL–1 MMT) and the experimental group, respectively, V is the total volume of the reaction system (5 mL) and m is the mass of MMT added to the system (g).
Conjugation assays
Overnight cultures of the donor strain and the recipient strain were harvested by centrifugation (3000 × g, 10 min, 4°C). The cell pellets were washed twice with 0.01 M phosphate-buffered saline (PBS; pH 7.2) and resuspended in antibiotic-free LB broth to an OD600 of 0.5. To initiate conjugation, the donor and recipient suspensions were mixed in a 1:1 ratio to a final reaction volume of 10 mL. MMT was added to the mating mixtures to achieve final concentrations of 0, 1.25, 2.5, 5.0 and 10 mg mL–1. The mixtures were incubated statically at 37°C for 4 h.
Following incubation, samples were centrifuged at 50 × g for 5 min. The supernatant was serially diluted and spread onto LB agar plates supplemented with specific antibiotics to enumerate different bacterial populations: donors (ampicillin 50 μg mL–1 final, kanamycin 50 μg mL–1 final, tetracycline 10 μg mL–1 final), recipients (streptomycin 50 μg mL–1 final) and transconjugants (donor plus recipient antibiotics). Donor-only and recipient-only suspensions were plated on the transconjugant-selective agar as negative controls, yielding no growth. Plates were incubated at 37°C for 24 h, after which colony counts were recorded.
The conjugation frequency and conjugation efficiency were calculated using Equations 3 & 4:
 \begin{equation}{\text{Conjugation frequency}} = {C_{{\text{tc}}}}/{C_{\text{d}}}\end{equation}
 \begin{equation}{\text{Conjugation efficiency}} = {C_{{\text{tc}}}}/{C_{\text{r}}}\end{equation}
where C d is the donor concentration, C r is the recipient concentration and C tc is the transconjugant concentration.
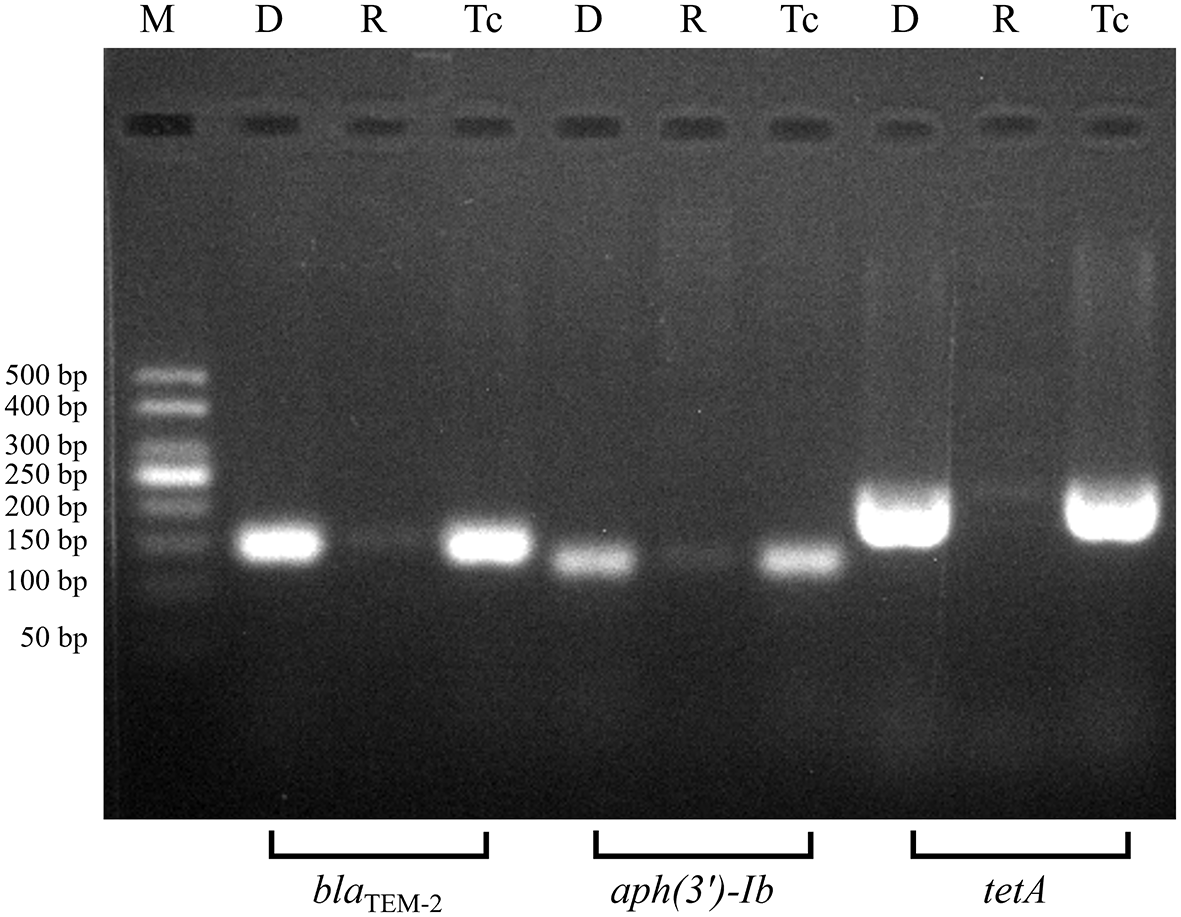
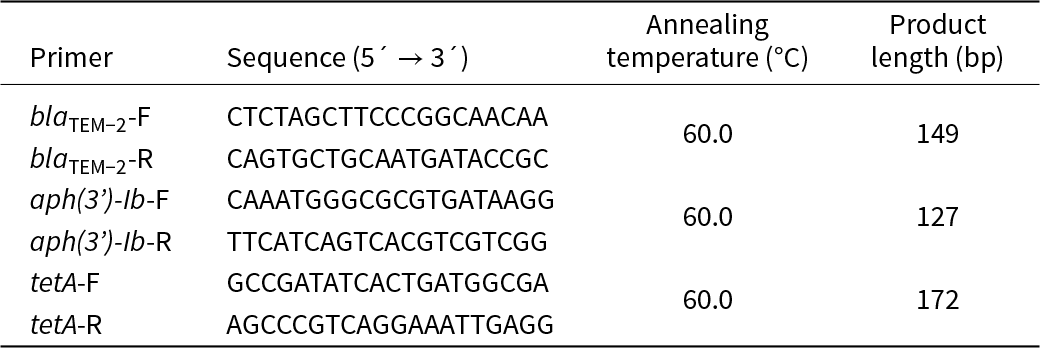
Transconjugants were identified via agarose gel electrophoresis of polymerase chain reaction (PCR)-amplified ARGs. Crude genomic DNA was extracted via boiling lysis (100°C, 10 min), followed by amplification of target genes with 2 × Rapid Taq Master Mix (Vazyme, Nanjing, China; primers are given in Table 3). Amplicons were electrophoresed on 2.5% agarose gels and visualized under ultraviolet light (Tanon-3500, Tanon, Shanghai, China; Fig. 1).
Agarose gel electrophoresis verification of ARGs. D = donor as positive control; M = marker; R = recipient as negative control; Tc = transconjugant.

Primers for PCR.

Table 3 Long description
The table lists PCR primer names with their nucleotide sequences, a shared annealing temperature, and expected amplicon length. There are three targets, each with a forward and reverse primer: blaTEM-2, aph(3’)-Ib, and tetA. All primer pairs use the same annealing temperature of 60.0 degrees Celsius. Expected product lengths differ by target: aph(3’)-Ib is 127 base pairs, blaTEM-2 is 149 base pairs, and tetA is 172 base pairs, making tetA the longest and aph(3’)-Ib the shortest. Sequences are provided in the five-prime to three-prime direction for each primer. The reverse-primer rows do not repeat the annealing temperature or product length, implying those values apply to the primer pair rather than the individual primer.
F = forward primer; R = reverse primer.
Statistical analysis
All experiments were performed in three independent biological replicates. The experimental data were analysed with SPSS 26.0 (IBM Corp., Armonk, NY, USA) and are presented as mean ± standard error of the mean (SEM). The Shapiro–Wilk test and Levene’s test were used to assess normality and homogeneity of variance, respectively. Normally distributed data were analysed by one-way analysis of variance (ANOVA). For non-normally distributed data, Kruskal–Wallis tests were employed. Post-hoc comparisons were conducted using Tukey’s test for homogeneous variance or Tamhane’s T2 test with Welch’s correction for heteroscedasticity. Growth curves of MDR E. coli were analysed using a two-way ANOVA followed by Bonferroni multiple comparisons tests. All figures were generated using GraphPad Prism 8.0 (GraphPad Software, San Diego, CA, USA).
Results and discussion
Optimization of removal conditions
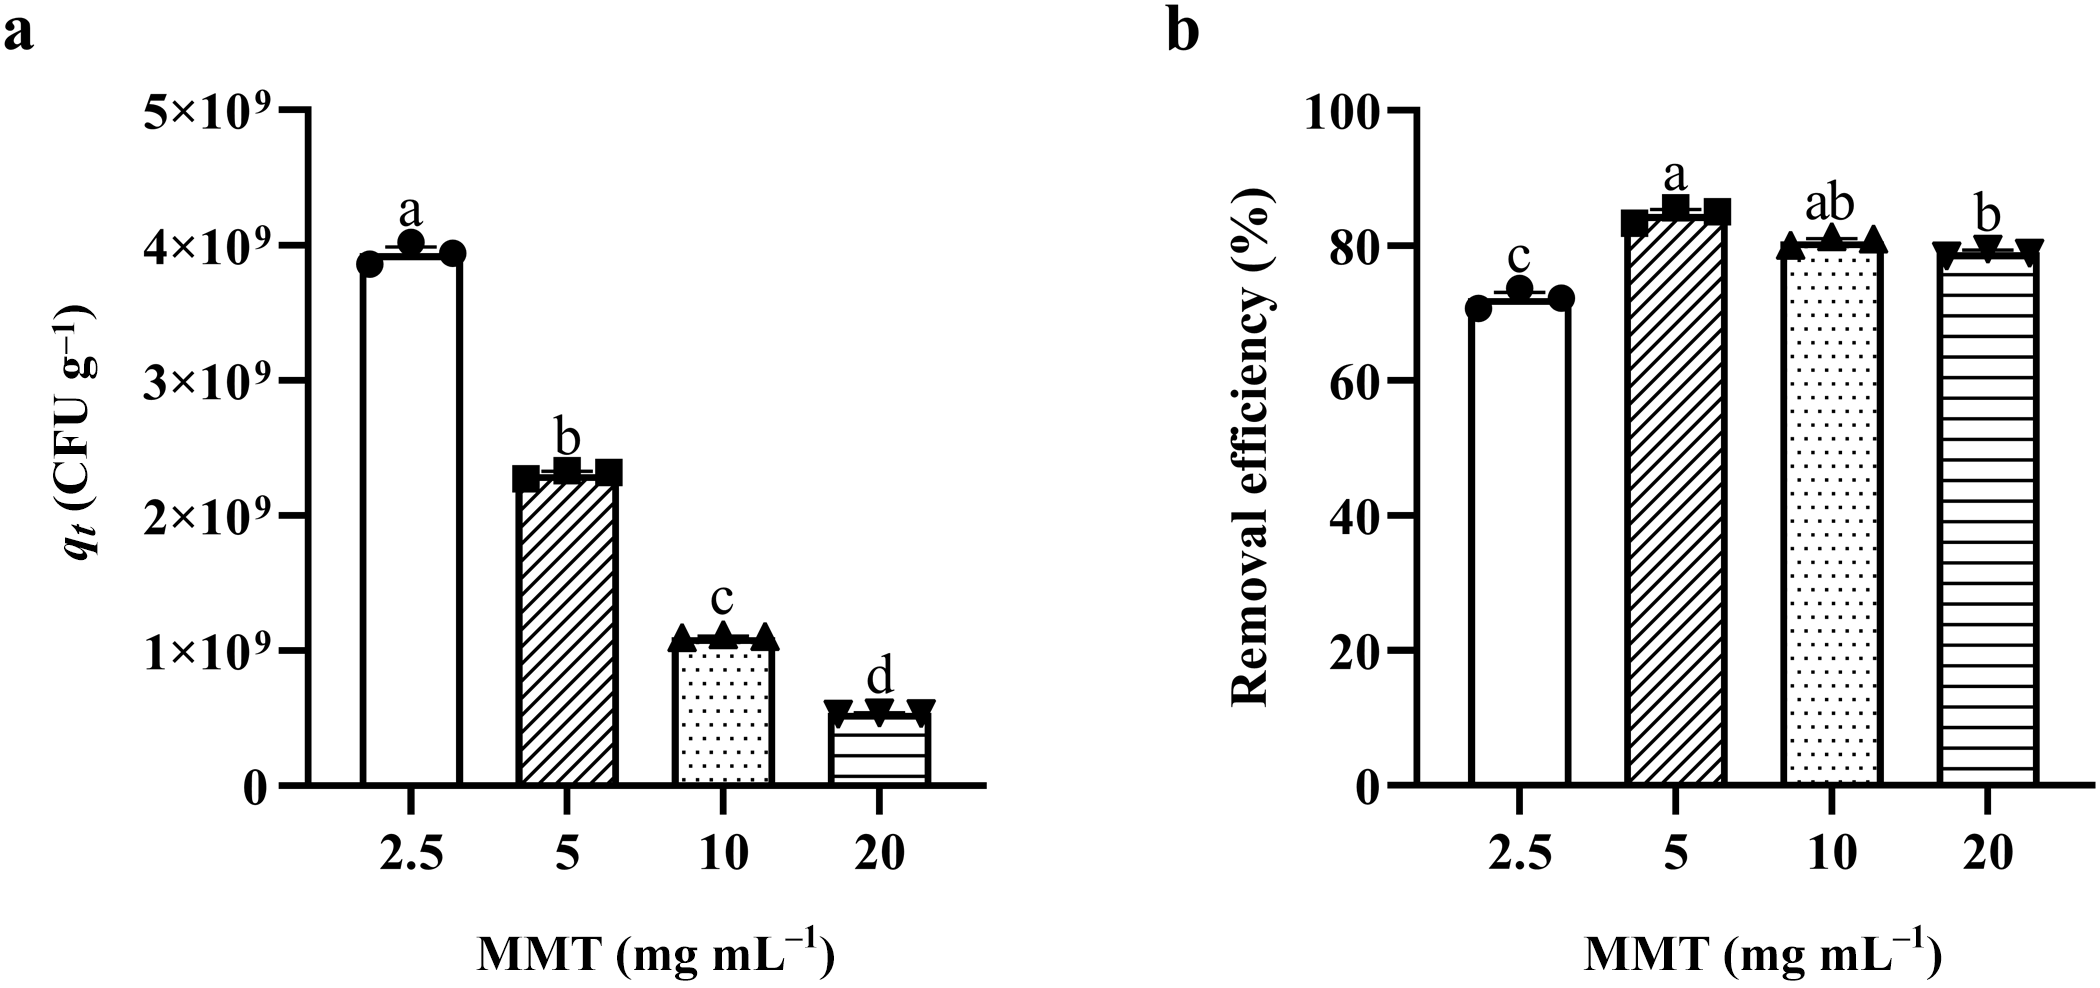
The dose-dependent removal of MDR E. coli by MMT revealed a distinct non-linear pattern. When evaluated by the removal amount per unit mass of MMT (qt), the 2.5 mg mL–1 group exhibited the greatest capacity, which decreased significantly as the MMT dosage increased (p < 0.05; Fig. 2a). Conversely, at 1 h, the removal efficiency in the suspension did not increase monotonically with MMT concentration. The 5 mg mL–1 treatment group exhibited the highest removal efficiency, removing 84.60% of the bacterial load (p < 0.05). In contrast, the 2.5 mg mL–1 group showed the lowest efficiency, at 72.15% (p < 0.05; Fig. 2b). The maximum qt and the minimum removal efficiency at 2.5 mg mL–1 highlight the saturation dynamics of the system. The limited MMT particles were highly saturated by the bacterial population, which maximized per-unit utilization, but the absolute number of available binding sites was insufficient to clear the entire suspension.
The 1 h removal capacity and efficiency of 2.5, 5, 10, and 20 mg mL–1 MMT on MDR E. coli. (a) Removal amount of bacteria per unit mass of MMT (qt). (b) Removal efficiency of bacteria in the suspension. Data are mean ± SEM (n = 3). Statistical significance was determined by one-way ANOVA with Tukey’s post-hoc test for homogeneous variance, and significant differences are indicated by letters above the bars (p < 0.05).

Interestingly, increasing the MMT dosage to 10 and 20 mg mL–1 did not yield a higher removal efficiency (p > 0.05); instead, removal efficiencies slightly decreased to ∼80%, accompanied by a decline in qt (p < 0.05). This phenomenon can probably be attributed to two primary factors. First is the aggregation of clay particles. At higher suspension concentrations, the probability of particle–particle collision increases, leading to the formation of larger agglomerates driven by van der Waals forces and electrostatic interactions (Zhang et al., Reference Zhang, Wei, Liu, Cai, Zeng and Yu2023; Li et al., Reference Li, Wei, Liu, Guan, Jiang and Sun2025). This aggregation effectively reduces the accessible specific surface area and covers potential active sites, rendering a significant portion of the added MMT mass inaccessible and directly causing the decrease in qt. Second, an increase in the added amount of MMT concomitantly increases the viscosity of the LB broth system (Viseras et al., Reference Viseras, Meeten and Galindo1999). This elevated viscosity works against the uniform dispersion of MMT in the liquid phase (Wei et al., Reference Wei, Mo, Fu, Liu and Xu2023), thereby impeding effective contact between the MDR E. coli cells and the available binding sites on the MMT particles. Thus, 5 mg mL–1 was identified as the optimal dosage for this specific bacterial concentration, representing the best balance between particle dispersion, binding site availability, per-unit mass utilization and overall removal efficiency.
Removal kinetics and apparent stability
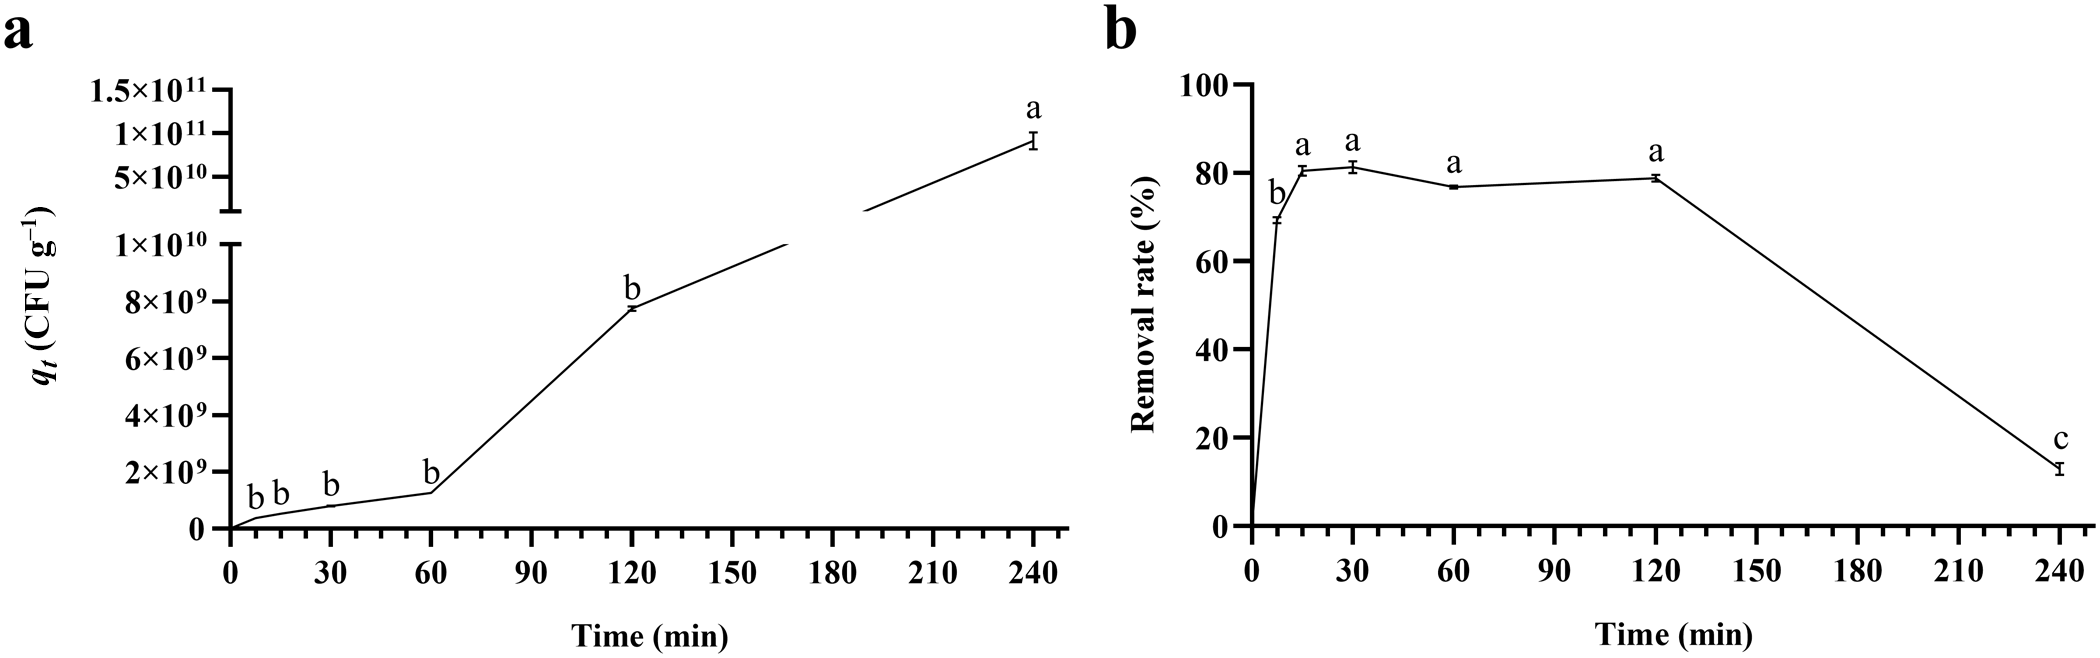
The temporal dynamics of the MMT–bacteria interaction provided further insight into the mechanism of removal. Analysis of the removal amount per unit mass of MMT (qt) revealed a stable plateau between 7.5 and 120 min without significant difference (p > 0.05), followed by a significant increase at 240 min (p < 0.05; Fig. 3a). Concurrently, the process evaluated by the removal efficiency was characterized by a rapid initial uptake, where the removal efficiency increased to 69.33% within the first 7.5 min. This suggests that the initial phase is driven by a complex interaction of physicochemical forces. In addition to electrostatic attraction between the surface charges of MMT and negatively charged domains on the bacterial surface, and cation bridging mediated by ions such as Ca2+ and Mg2+ in the solution (Fomina & Skorochod, Reference Fomina and Skorochod2020; Sun & Lei, Reference Sun and Lei2023), the interaction is probably further facilitated by surface coordination and hydrophobic effects. Specifically, the exposed hydroxyl groups (e.g. Al-OH, Si-OH) at the broken edge sites of MMT might form coordination bonds with functional groups (e.g. carboxyl and phosphate) on the bacterial cell wall (Inchaurrondo & Font, Reference Inchaurrondo and Font2022; Wang et al., Reference Wang, Xiao, Yu, Han and Guo2025). Furthermore, localized hydrophobic interactions between the less polar regions of the bacterial outer membrane and the neutral siloxane surfaces of MMT may also contribute to the stabilization of the bacteria-mineral complex (Bousemat et al., Reference Bousemat, Ziane-Hezil, Benatmane, Bessaha, Bessaha and Coruh2025). By 15 min, the system reached an apparent equilibrium, with a peak removal efficiency of 80.45%. A relatively stable removal plateau between 15 and 120 min was observed (p > 0.05; Fig. 3b). During this period, the concurrent stability of both qt and the removal efficiency indicates that the available binding sites on MMT were saturated, while the total bacterial population had not yet entered the exponential growth phase. This demonstrates the apparent stability of the bacteria–clay complex over a duration relevant to gastric transit times in monogastric animals.
Time-dependent removal capacity and efficiency of 5 mg mL–1 MMT on MDR E. coli. (a) Removal amount of bacteria per unit mass of MMT (qt). (b) Removal efficiency of bacteria in the suspension. Data are mean ± SEM (n = 3). Statistical significance was determined by one-way ANOVA with Tukey’s post-hoc test for homogeneous variance, and significant differences are indicated by letters above the data points (p < 0.05).

However, the removal efficiency declined to 12.98% at 240 min (p < 0.05; Fig. 3b). While this decline could indicate partial desorption due to weak reversible binding, the significant elevation of qt at 240 min (p < 0.05; Fig. 3a) demonstrates that it is more likely to have been driven by rapid bacterial growth in the nutrient-rich LB broth. The divergence between the increasing qt and the decreasing removal efficiency reflects an apparent dynamic balance between continuous cell division and physical removal by MMT. The fixed concentration of MMT (5 mg mL–1) offers a finite number of binding sites. Once these sites are saturated, newly divided bacteria remain in the planktonic phase. As the total bacterial population grows exponentially, the absolute number of adsorbed bacteria (qt) concurrently increases. This rise is potentially driven by cell-to-cell accumulation on the mineral surface, yet it remains ultimately constrained by the available surface area. Because this limited increase in absolute adsorption cannot offset the exponential proliferation of planktonic cells, the calculated removal efficiency decreases. This observation has critical practical implications: it suggests that MMT acts as a temporary buffer that sequesters pathogens, but that its capacity can be easily overwhelmed if bacterial proliferation outpaces removal or if the pathogen load exceeds the saturation threshold.
Effects of MMT on bacterial growth
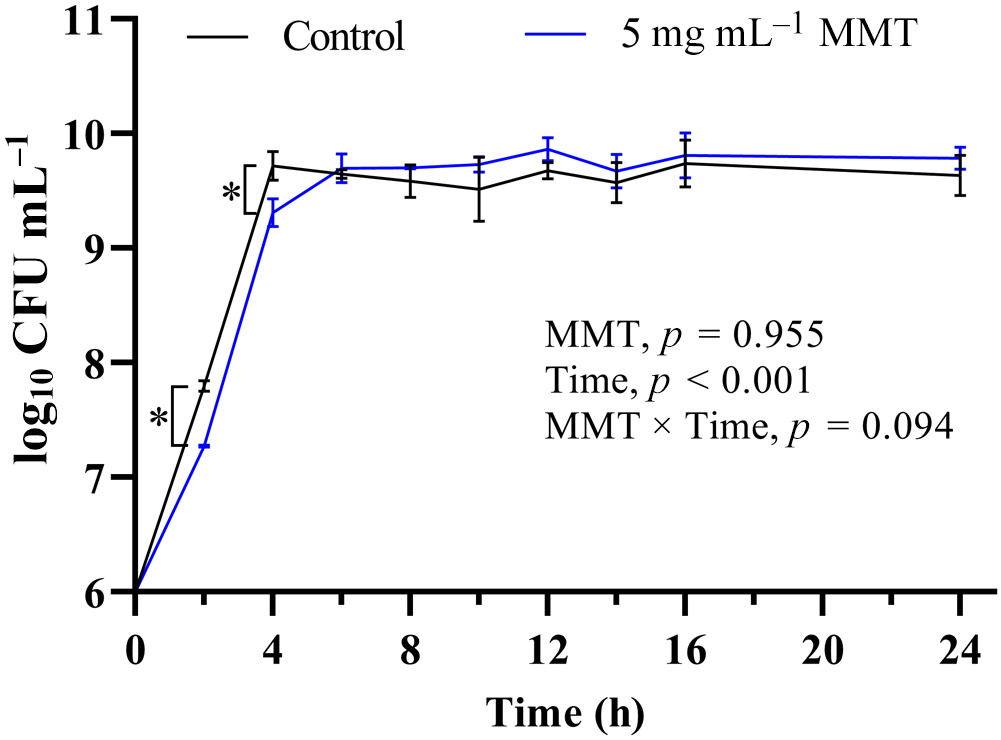
To evaluate the effects of MMT on bacterial growth, the growth curves of E. coli in the presence of 5 mg mL–1 MMT were monitored. The results revealed a significant main effect of time (p < 0.05), while the main effect of MMT and the interaction were not significant (p > 0.05; Fig. 4). A significant reduction in the planktonic bacterial concentration compared to the control was only observed at the 2 and 4 h time points (p < 0.05), which corresponds to the active removal phase identified in the kinetics study. Crucially, from 6 to 24 h, the growth curves of the MMT-treated group and the control group overlapped, showing no significant difference in the planktonic bacterial load (p > 0.05).
Growth curves of planktonic MDR E. coli in the presence of 5 mg mL–1 MMT. Data are mean ± SEM (n = 3). Statistical significance was determined by two-way ANOVA followed by Bonferroni multiple comparisons tests, and significance is shown with asterisk (*) symbols (p < 0.05).

This transient decrease in planktonic population followed by recovery suggests that MMT acts primarily as a physical removal agent rather than a bactericidal agent. Natural MMT does not exert a strong, long-term bactericidal effect on the culture system, unlike modified clays loaded with antibacterial metals (e.g. Cu, Zn, Ag) or acid-activated clays that disrupt cell membranes (Khan et al., Reference Khan, Bhatti, Akhlaq, Ishaq, Ali and Jalil2022; Hwang, Reference Hwang2023). The absence of overall growth inhibition, combined with subsequent plasmid conjugation, suggests that a portion of the interacting bacteria remains physiologically active. However, direct evidence of this is needed in future studies to confirm their survival on the clay surface. Based on these observations, the bacteria appear to be physically immobilized rather than inactivated. While this reduces the free planktonic population capable of translocation across the intestinal epithelium, the survival of these bacteria on the clay surface is a prerequisite for the subsequent risk of HGT.
Effects of MMT on plasmid conjugation
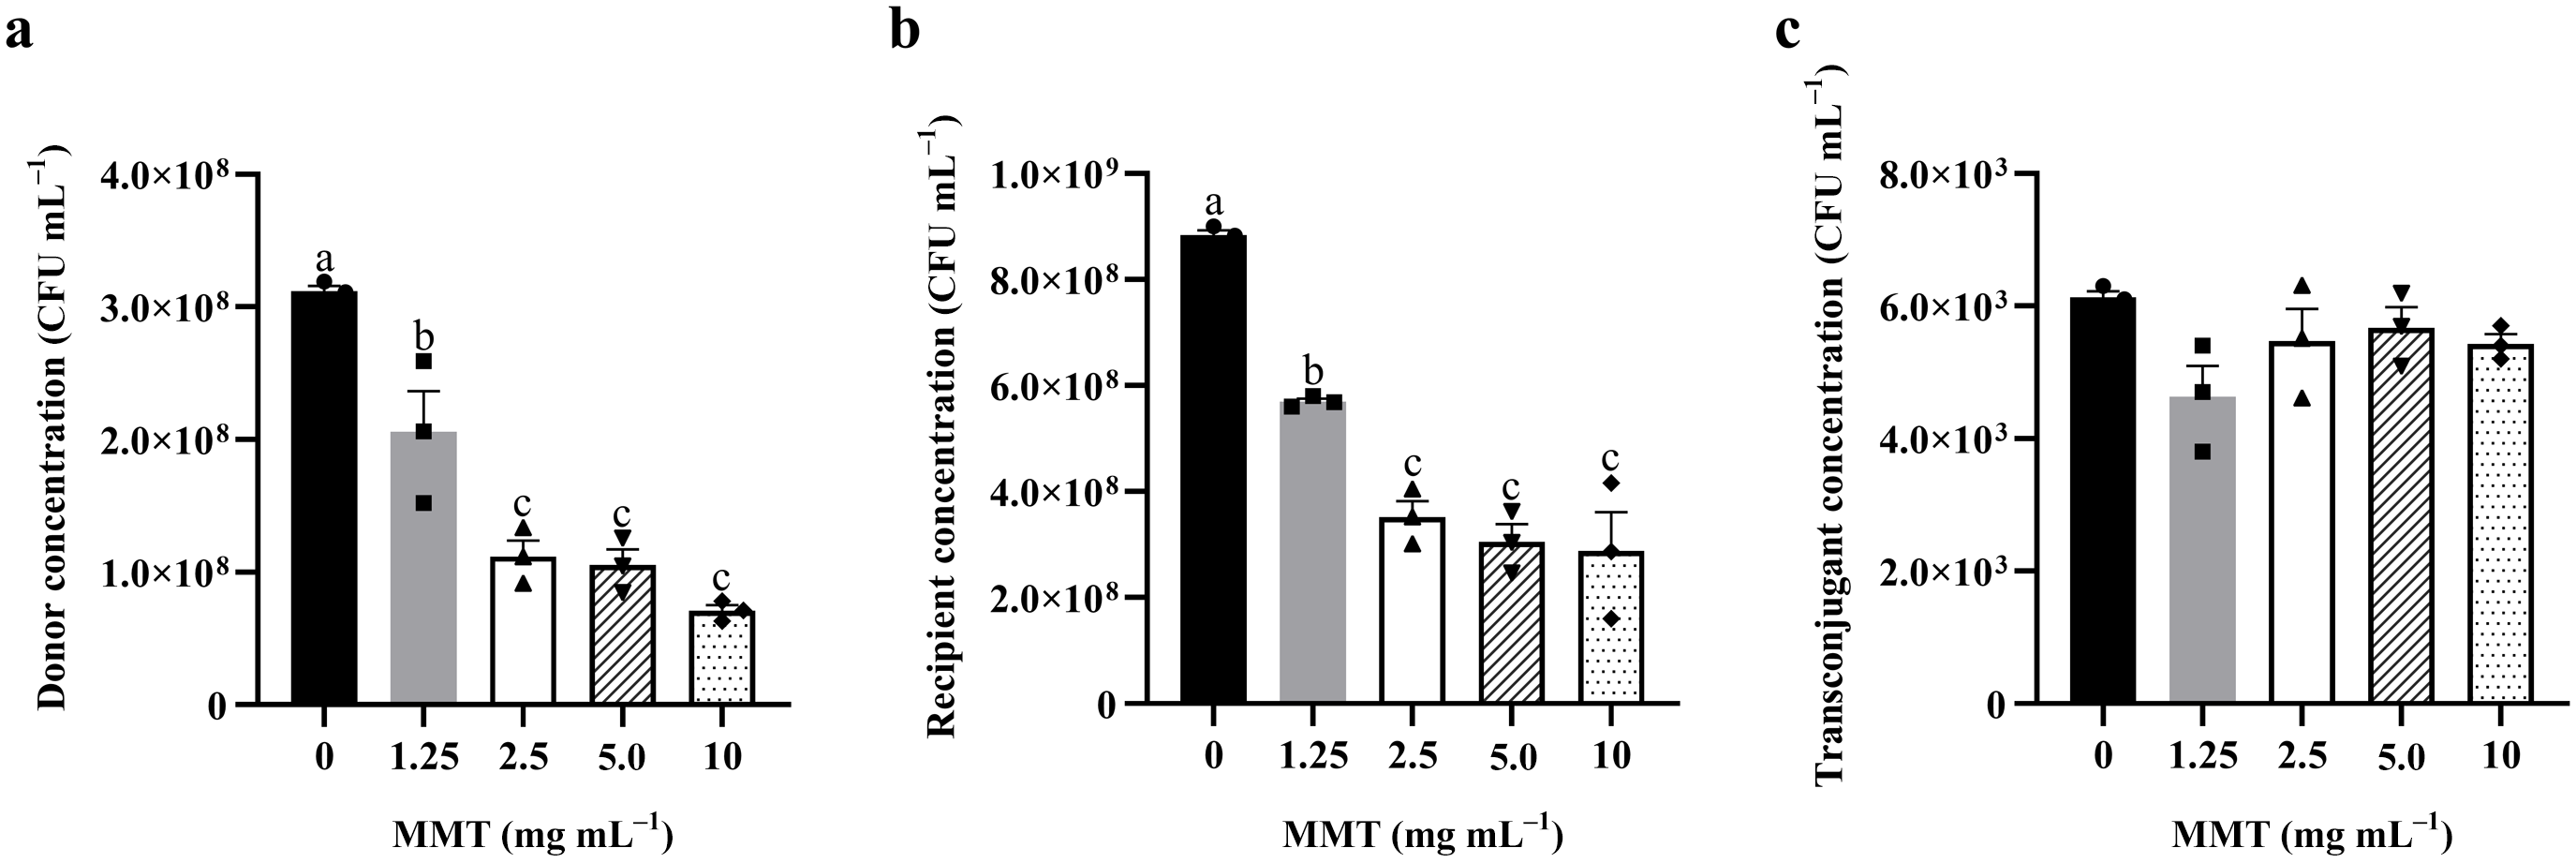
The most pivotal finding of this study concerns the modulation of plasmid conjugative transfer by MMT. In our conjugation system, the addition of MMT (1.25, 2.5, 5.0 and 10 mg mL–1) resulted in a dose-dependent decrease in the planktonic concentrations of both donor and recipient strains (p < 0.05; Fig. 5a,b). This reduction is probably due to the sedimentation effect, whereby bacteria co-precipitate with clay particles and are removed from the suspension. However, despite the significant reduction in the planktonic donor and recipient populations, the absolute number of planktonic transconjugants (recipient cells that successfully acquired the resistance plasmid) did not decrease significantly compared to the control group (p > 0.05; Fig. 5c).
Effects of MMT on planktonic donor, recipient and transconjugant concentrations in the conjugation mixture: (a) donor concentration; (b) recipient concentration; (c) transconjugant concentration. Data are mean ± SEM (n = 3). Statistical significance was determined by one-way ANOVA with Tukey’s post-hoc test for homogeneous variance, and significant differences are indicated by letters above the bars (p < 0.05).

Figure 5 Long description
The image A showing a bar graph with the y-axis label Donor concentration (CFU mL superscript minus 1) and the x-axis label MMT (mg mL superscript minus 1). The x-axis categories are 0, 1.25, 2.5, 5.0 and 10. The y-axis range is 0 to 4.0 times 10 superscript 8. Each bar has an error bar and overlaid point markers. Each bar is annotated with a significance letter: a at 0, b at 1.25, c at 2.5, c at 5.0 and c at 10. The bar heights decrease from 0 to 10, with the highest bar at 0 and the lowest bar at 10. The image B showing a bar graph with the y-axis label Recipient concentration (CFU mL superscript minus 1) and the x-axis label MMT (mg mL superscript minus 1). The x-axis categories are 0, 1.25, 2.5, 5.0 and 10. The y-axis range is 0 to 1.0 times 10 superscript 9. Each bar has an error bar and overlaid point markers. Each bar is annotated with a significance letter: a at 0, b at 1.25, c at 2.5, c at 5.0 and c at 10. The bar heights decrease from 0 to 10, with the highest bar at 0 and the lowest bars at 2.5, 5.0 and 10. The image C showing a bar graph with the y-axis label Transconjugant concentration (CFU mL superscript minus 1) and the x-axis label MMT (mg mL superscript minus 1). The x-axis categories are 0, 1.25, 2.5, 5.0 and 10. The y-axis range is 0 to 8.0 times 10 superscript 3. Each bar has an error bar and overlaid point markers. The bar heights are clustered in a similar range across all MMT categories, with the highest bar at 0 and the lowest bar at 1.25. Across the three bar graphs, the same x-axis variable MMT (mg mL superscript minus 1) is used to compare donor concentration, recipient concentration and transconjugant concentration. The significance letters a, b and c appear as annotations on bars in the donor and recipient graphs and the same letter appears on multiple bars at 2.5, 5.0 and 10 in both graphs.
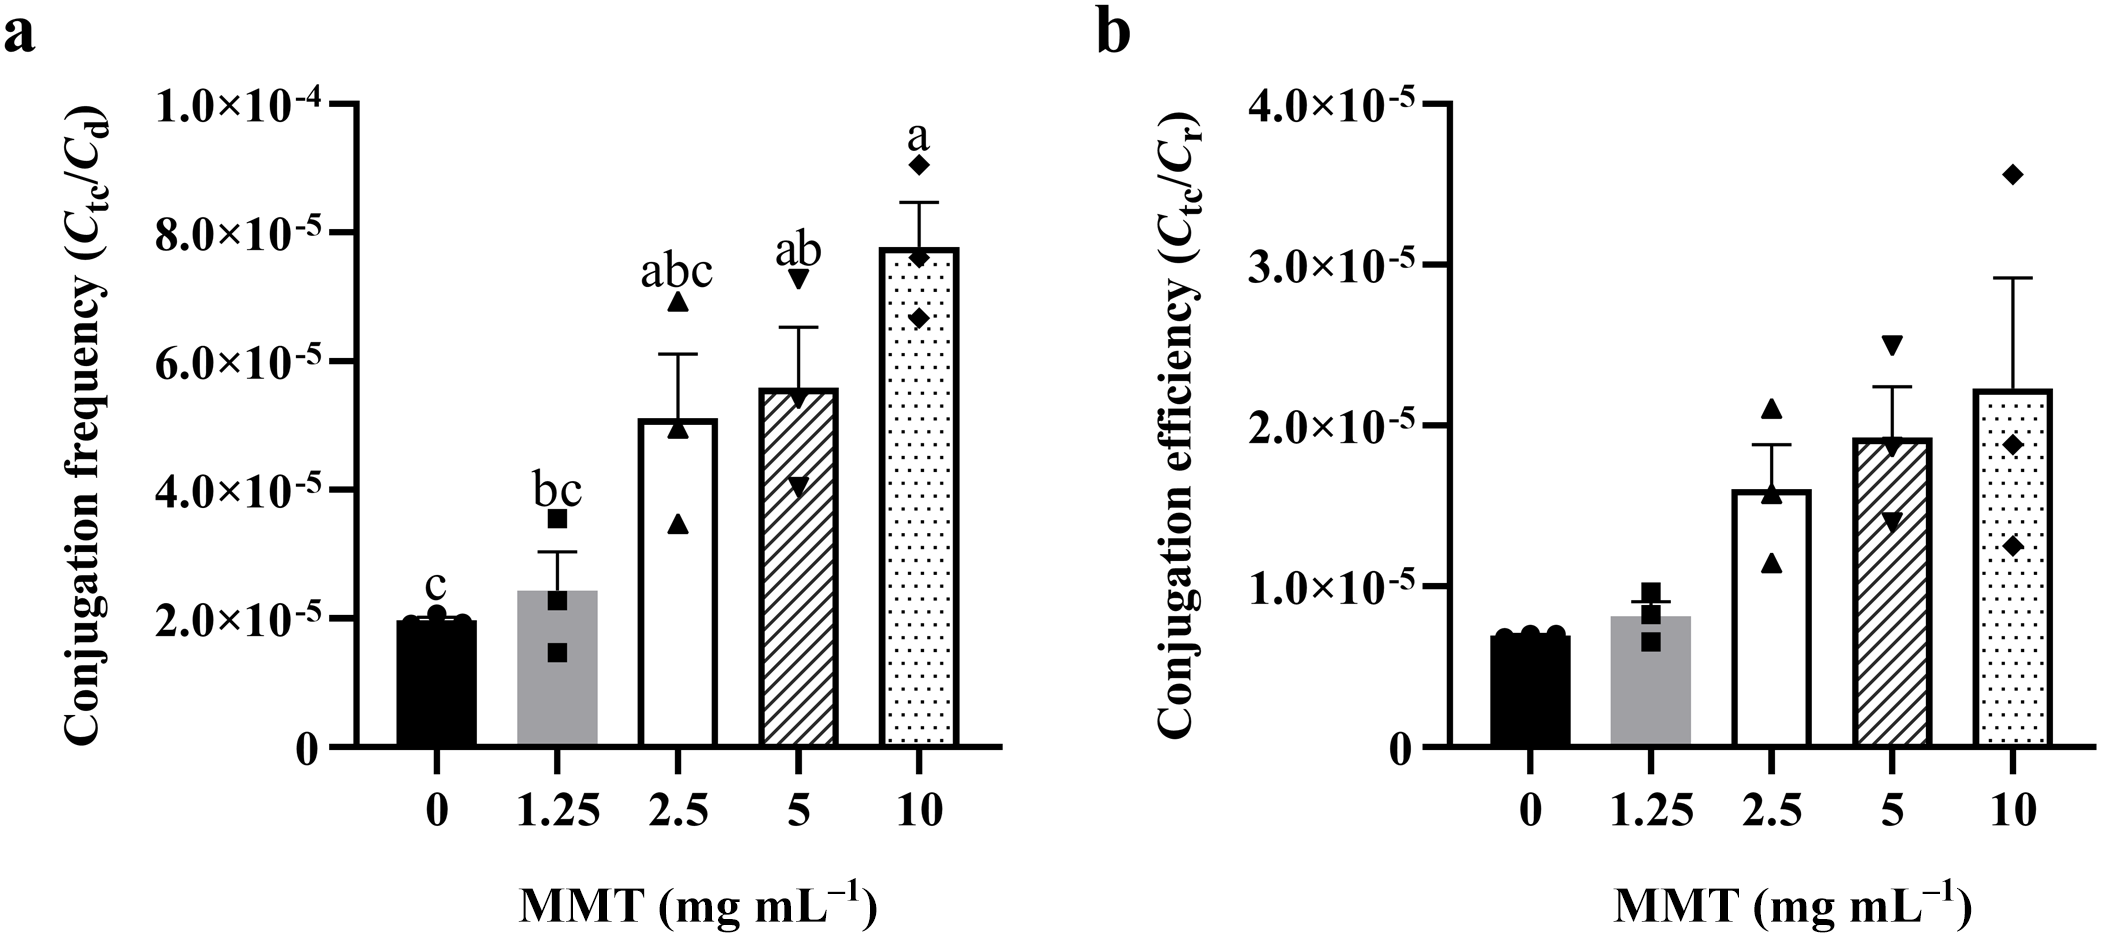
Consequently, the apparent conjugation frequency in the supernatant exhibited a significant upward trend. While low concentrations (1.25 and 2.5 mg mL–1) showed no significant effect (p > 0.05), MMT concentrations ≥5 mg mL–1 significantly increased the conjugation frequency, with the 10 mg mL–1 group reaching the highest level (p < 0.05; Fig. 6a). Although this increase is partially a mathematical consequence of the decreased donor counts in the suspension, the fact that the absolute number of transconjugants did not decrease supports the hypothesis of surface-mediated HGT (Sand & Jelavi, Reference Sand and Jelavi2018; Hu et al., Reference Hu, Sheng, Zhang, Lin and Gao2020; Shi et al., Reference Shi, Hu, Xu, Hu, Ma and Lou2023).
Effects of MMT on the apparent conjugation frequency and conjugation efficiency of E. coli: (a) conjugation frequency (C tc/C d); (b) conjugation efficiency (C tc/C r). Data are mean ± SEM (n = 3). Statistical significance was determined by one-way ANOVA with Tukey’s post-hoc test for homogeneous variance, and significant differences are indicated by letters above the bars (p < 0.05).

Figure 6 Long description
The image A showing a bar graph with the y-axis label Conjugation frequency (Ct over Cd) and tick labels 0, 2.0 times 10 superscript negative 5, 4.0 times 10 superscript negative 5, 6.0 times 10 superscript negative 5, 8.0 times 10 superscript negative 5, 1.0 times 10 superscript negative 4. The x-axis label is MMT (mg mL superscript negative 1) with category labels 0, 1.25, 2.5, 5, 10. Five vertical bars are shown at 0, 1.25, 2.5, 5 and 10, each with an error bar. Letters above the bars read c, bc, abc, ab, a from left to right. The bar heights increase across the categories from 0 to 10, with the lowest bar at 0 and the highest bar at 10. The image B showing a bar graph with the y-axis label Conjugation efficiency (Ct over Cc) and tick labels 0, 1.0 times 10 superscript negative 5, 2.0 times 10 superscript negative 5, 3.0 times 10 superscript negative 5, 4.0 times 10 superscript negative 5. The x-axis label is MMT (mg mL superscript negative 1) with category labels 0, 1.25, 2.5, 5, 10. Five vertical bars are shown at 0, 1.25, 2.5, 5 and 10, each with an error bar. The bar heights increase across the categories from 0 to 10, with the lowest bar at 0 and the highest bar at 10. Both graphs use the same x-axis categories (0, 1.25, 2.5, 5, 10) and show increasing bar heights as MMT increases, with separate y-axis measures for Conjugation frequency (Ct over Cd) and Conjugation efficiency (Ct over Cc).
Several mechanisms may explain why the absolute number of transconjugants was maintained. First, the large specific surface area of MMT concentrates widely dispersed bacteria into a micro-volume on the clay surface. This proximity potentially increases the collision probability between donors and recipients, which is the rate-limiting step in conjugation (Virolle et al., Reference Virolle, Goldlust, Djermoun, Bigot and Lesterlin2020; Neil et al., Reference Neil, Allard and Rodrigue2021). Second, the hydration shell and nutritional enrichment on the clay surface may mimic a biofilm interface or actively promote biofilm formation, and biofilms are known to be hotspots for HGT (Virolle et al., Reference Virolle, Goldlust, Djermoun, Bigot and Lesterlin2020; Sutton & Sposito, Reference Sutton and Sposito2001). Third, the rigid surface of the clay tactoids may provide physical support that stabilizes the pilus and potentially flagellar connection between cells, protecting the fragile mating bridge from shear forces in the fluid environment (Ehrlich et al., Reference Ehrlich, Ahmed, Earl, Hiller, Costerton and Stoodley2010; Worthington et al., Reference Worthington, Wiley, Kaalberg, Collins, Mullins, Stone and Tucker2017; Li & Bourg, Reference Li and Bourg2024). However, without direct observational evidence, these surface-mediated mechanisms remain speculative and require further verification.
This finding highlights a critical trade-off in the application of MMT. The concentration of 5 mg mL–1, identified as optimal for physical removal, is also the threshold at which the risk of ARG dissemination significantly increases. While MMT effectively removes bacteria from the fluid phase, it potentially functions as a solid-phase reactor that favours the spread of resistance. This implies that, in agricultural settings, simply sequestering bacteria is insufficient; the fate of the adsorbed biomass must be controlled. Future strategies for clay mineral modification should focus on imparting bactericidal properties to the material surface (using methods such as surfactant modification or metal ion exchange) to inactivate adsorbed bacteria before they can engage in gene transfer, thereby achieving the dual goal of pathogen control and resistance mitigation.
However, the observed removal of E. coli from the suspension does not definitively distinguish true surface adsorption from mechanisms such as flocculation or co-sedimentation, necessitating future microscopic verification (e.g. scanning electron microscopy/transmission electron microscopy) to clarify the precise interaction. Furthermore, because the current study only quantified conjugation in the supernatant, the total conjugative transfer within the whole system, including the MMT-associated pellet, remains to be determined through specialized desorption protocols in future investigations.
Conclusions
This study highlights the complex role of MMT in modulating MDR E. coli. While 5 mg mL–1 MMT effectively removes bacteria from the fluid phase within 15 min, the material exhibits limited long-term growth inhibition. Crucially, effective removal concentrations (≥5 mg mL–1) inadvertently promote the apparent conjugative transfer frequency of resistance plasmids in the suspension, probably by facilitating cell-to-cell contact on mineral surfaces. These findings suggest that while MMT may be valuable for pathogen control in animal nutrition, its potential to increase HGT requires careful consideration. Future modification strategies (e.g. surfactant modification or metal ion loading) should aim to improve bactericidal activity so as to mitigate the risk of ARG dissemination.
Financial support
None.
Competing interests
The authors declare none.