In the four short decades between 1990 and 2030, the global tally of persons age 60+ will burgeon from 500 million to almost 1.5 billion individuals. As much of this demographic aging will take place in Asia, it follows that retirement systems in Asia will come under substantial pressure. This paper focuses on one of Asia's most famous retirement programs, Singapore's national defined contribution program known as the Central Provident Fund (CPF). Our goal is to review how workers are allocating their retirement savings across the various investment options made available under the CPF, and to assess whether alternative investment choices might enhance retirement saving. In particular, we address four questions:
• What fund choices are currently available for workers covered by the CPF, and how do people allocate their retirement saving?
• How do these investment patterns vary according to participant characteristics, and how do they compare to those in other countries?
• How do investment options outside the government default investment pool compare, in terms of fees and charges?
• What policy conclusions may be derived regarding the current investment mix provided for retirement saving?
In what follows, we first outline the structure of Singapore's retirement system, focusing on the links between the national mandatory provident fund structure and other types of asset accumulation in the nation. Next, we show how government policy has influenced asset accumulation and investment patterns.Footnote 1 Subsequently, we explore several questions about asset allocation patterns by demographic attributes. Last, we assess how the fees and charges associated with investing in a CPF unit trust can impact on the investment return over various time horizons.Footnote 2 Since workers who default their money to the CPF fund receive a guaranteed 2.5% return on the Ordinary Account and 4% on the Special Account, this means that hurdle rates for money market and equity funds are rather substantial. These high hurdle rates help explain why few CPF account holders invest outside the default government investment pool. On the other hand, inertia probably explains why many employees let their funds sit in bank accounts earning low interest rates, rather than opting for either the CPF fund or other permitted investments.
Investment patterns in Singapore's Central Provident Fund (CPF)
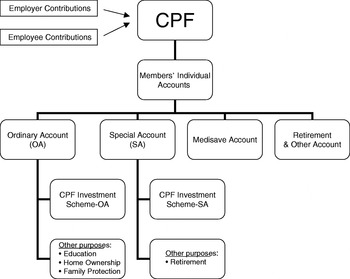
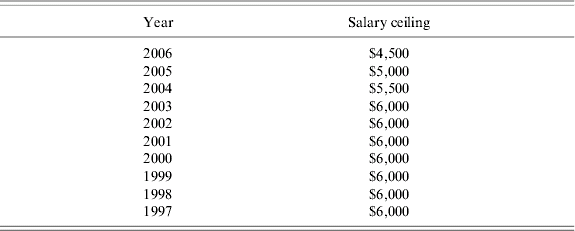
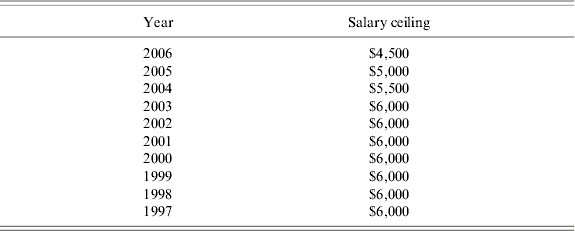
The CPF in Singapore was first established in 1955 as a forced savings program; half a century later, it has evolved into a wide-ranging social security system covering 3.1 million CPF members, of whom 1.46 million are active (as of December 2006).Footnote 3, Footnote 4 Since its inception, the CPF has been a defined contribution plan financed by mandatory levies on employees' regular monthly earnings up to an earnings cap. Contribution rates and caps have varied over time, with current rates amounting to between 8.5% and 33% of salary depending on the employee's age, and the ceiling is set at $4,500 per monthFootnote 5 (in 2006; see Table 1). Initially all contributions were held in a single account, but over time, additional accounts were created. Of most interest for our purposes, the Ordinary Account (OA) and Special Account (SA) concepts were introduced in the late 1970s; the former is intended for financing of home purchases, insurance premiums, education expenses, and other saving, while the Special Account, created in 1977, is mainly targeted toward old-age saving. The Medisave account, introduced in 1984, is designed to be spent on medical care expenses and catastrophic illness insurance (see Figure 1).
Central Provident Fund (CPF) overview
Source: Adapted from Low and Aw (2004).

Annual earnings ceiling for Central Provident Fund (CPF) contributions
Source: CPF Annual reports, various years.
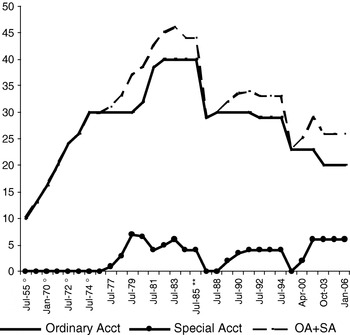
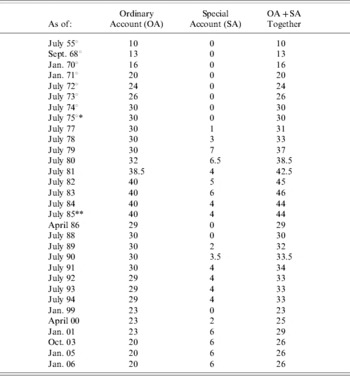
Total CPF contributions vary with age, and so too does the breakdown of the allocations across accounts. Currently young workers (⩽35 years old) have 6% of their total contributions dedicated to the Medisave account, 22% of their totals to the Ordinary Account, and 5% to the Special Account. By contrast, older workers (age>55–60) contribute 18.5% of covered pay split 8%, 10.5%, and 0%, respectively, across the three accounts. Figure 2 and Table 2 depict the time pattern of OA and SA contribution rates for a ‘prime-age worker’ in the 35–45 age range. Such an individual would have had to contribute 10% of covered earnings in the 1950s to the single pooled account, with the rate rising steadily to 37% by 1979 when the Special Account was created. Thereafter, the non-medical savings portion of the CPF for this prime-age group of workers – that is, just the OA and SA combined elements – rose to 46% of covered pay by 1983, and then fell to the mid-to-low 30s over the 1990s. By the end of the 1990s, in response to the Asian financial crisis, the CPF savings contribution for OA and SA combined was slashed to 23%, and it now stands at 26% of covered pay.
Contribution Shares to CPF OA and SA accounts over time: % of covered earnings (workers age 35–45)

Contribution rates to CPF Ordinary and Special Accounts over time: % of covered earnings (workers age 35–45)

Notes:
° Single pooled account.
* Maximum contribution increased from $450 to $600 per month.
** Maximum contribution increased from $2,500 to $3,000 per month.
Source: CPF Annual Report 2005 Annex A (http://mycpf.cpf.gov.sg/cpf/about-us/ann-rpt/ann_report.htm) and http://mycpf.cpf.gov.sg/Members/Gen-Info/Con-Rates/ContriRa.htm
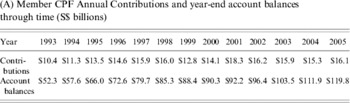
The flow of funds into the CPF over time has resulted in substantial asset accumulation by scheme participants. Contributions to the OA, SA, and Medisave accounts total S$16.1B, and CPF balances stand at S$119.8B (December 2005), or about three-fifths of Singapore's GDP that year.Footnote 6 As shown in Table 3, the growth rate of the CPF asset pool has averaged over 7% per annum since 2003.
Contributions and balances in the CPF

Source: CPF Annual Report 2005 (http://mycpf.cpf.gov.sg/cpf/about-us/ann-rpt/ann_report.htm).
Source: CPF Quarterly Statistics 2005Q4 (http://mycpf.cpf.gov.sg/CPF/About-Us/CPF-Stats/CPF_Stats2005q4.htm).
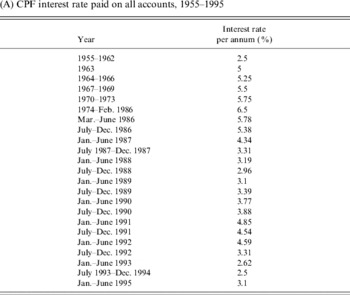
When the CPF was first established, the Provident Fund Board centrally directed all investible funds and a government-set rate of return was paid on the assets. This annual percentage return was set in 1955 at 2.5%, a figure that rose to 5% in 1963, and peaked at 6.5% in the mid-1980s (see Table 4). Thereafter, the return was gradually reduced to around 2.5–3% through the mid-1990s. The SA rate was set at 1.25 percentage points above the OA/Medisave rate in mid 1995, and raised to 1.5 percentage points in July 1998. There has been no change in the OA and SA rates since mid-1999; the annual OA rate is 2.5% and the SA return is 4%. As explained by the CPF Board, the actual return paid for the Ordinary Account is the higher of this floor, or the ‘market-related interest rate (based on the 12-month fixed deposit and month-end savings rates of the major local banks)’.Footnote 7 For the Special and Retirement Accounts, members earn additional interest of 1.5 percentage points above the normal CPF interest rate.Footnote 8 In other words, the Board guarantees a relatively safe minimum nominal return, and it also offers participants the possibility of upside potential should the bank rate rise. As shown in Table 4 (Panel B), the Medisave account return was raised in October 2001 to the SA rate, to help members build up the Medisave balance faster.
CPF interest rates over time


Notes:
1. The Special Account, Medisave Account and Retirement Account were introduced in July 1977, April 1984, and January 1987 respectively.
2. From 1955 to 1976, CPF interests were credited and compounded annually.
3. From 1977 to 1985, CPF interests were credited quarterly and compounded annually.
4. From 1986 to present, CPF interests are computed monthly and compounded and credited annually.
5. From 1 July 1999, CPF interests are reviewed quarterly.
Since the system's inception 50 years ago, the ‘default’ investment under the Provident Scheme has always been the CPF fund, so that workers would earn whatever rate of return was set by the CPF Board as explained above. Nevertheless, over time, participants have been permitted to use some of their OA and SA assets for other purposes. In 1968, then Prime Minister Lee Kuan Yew introduced the Home Ownership Scheme (HOS), which permitted workers to borrow against CPF accumulations for the purchase of public housing built under the auspices of the Housing Development Board (the government authority controlling most of the island's housing stock).Footnote 9 In 1978, CPF savers were permitted to purchase shares in the Singapore Bus Service Scheme, and in 1981, private home purchase was permitted with CPF funds. As of 1986, members were allowed to purchase commercial properties with their CPF savings and also to move into the Approved Investment Scheme arrangement (CPF Board, 2005e). Subsequently, in 1993, the Board instituted an Investment Schemes (IS) approach, which further widened the range of permissible assets in which CPF savers could invest. At first members were permitted to invest only a portion of their OA and SA savings in approved assets, but the portion was raised to 100% for the SA as of 2001.Footnote 10
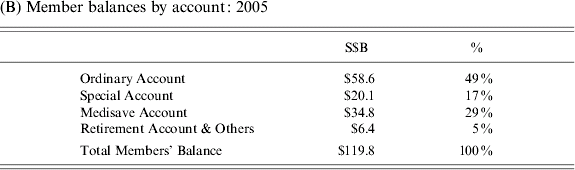
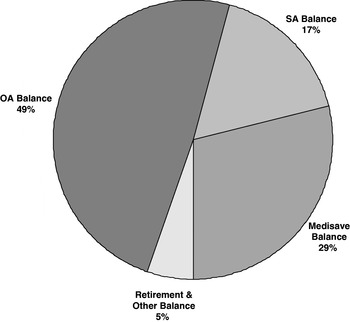
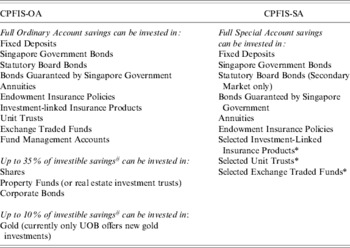
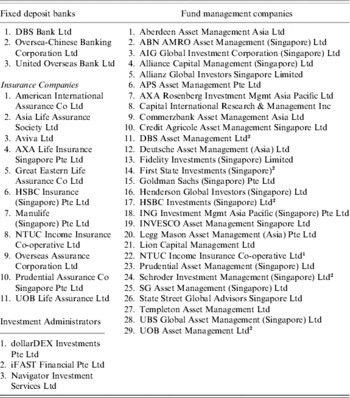
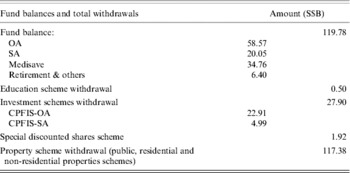
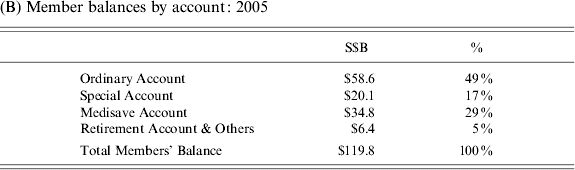
The range of products in which CPF members can invest is quite diverse. In 2006, for instance, OA funds could be invested in fixed deposits, corporate bonds, property funds and equities traded on the Singapore stock exchange, bonds guaranteed by the Singapore government, Statutory Board bonds, annuities and endowments, investment-linked insurance products, unit trusts, exchange traded funds, fund management accounts, and gold. Portfolio limits apply to specific asset families; for instance, as noted in Table 5, a participant can invest only up to 10% of his investible saving in gold, and only up to 35% of his investible saving in shares, property funds/REITs, and corporate bonds. A slightly narrower set of investment products has been allowed for Special Account monies; the list most notably excludes fund management accounts, shares, property funds/REITS, corporate bonds, gold, investment-linked insurance products, unit trusts, and exchange-traded funds in the Higher Risk category of the CPFIS Risk Classification System. The list of financial service providers currently allowed under the CPF Investment Scheme appears in Table 6. Mandatory savings are made to three accounts, namely the Ordinary, Special, and Medisave funds. At year-end 2005, CPF members held some S$120B (or about US$74B) allocated roughly half to the Ordinary Account, 17% in the Special Account, 29% in a medical care savings account, and the rest in ‘Retirement and Other’ (see Figure 3). Total cumulative contributions to the CPF scheme since inception stood at S$268.8B (as of 2005 Financial Year End).
Balances in specified CPF accounts (%)

Financial instruments available for investment in the CPF Ordinary and Special Accounts

Notes:
# Investible savings refer to the net Ordinary Account balance after withdrawals for education and investment.
* Those found in the lowest three tiers of the CPFIS Risk Classification System Table unless otherwise stated. The risk classification tables for unit trusts, investment-linked insurance products, and exchange traded funds can be found at www.cpf.gov.sg/cpf_info/Benefits/Asset/Assetenh.asp.
1. Annuities, endowment insurance policies, investment-linked insurance products must be offered by insurance companies included under CPFIS. For endowment policies, maturity date must not be later than the member's 62nd birthday.
2. Unit trusts and investment-linked insurance products must be managed by Fund Management Companies included under CPFIS. Fund managers are required to invest according to the Investment Guidelines set by CPF Board.
3. Exchange traded funds must meet guidelines set by CPF Board and be listed on the Singapore Exchange-Securities Trading (SGX-ST).
4. Fund managers of fund management accounts are required to invest according to the Investment Guidelines set by CPF Board.
5. Shares of Companies, Units of Property Funds or Property Trusts and Corporate Bonds (CPFIS-OA only) must be offered by companies incorporated in Singapore. Also, they must be fully paid ordinary or preference shares or corporate bonds listed on the Singapore Exchange-Securities Trading (SGX-ST).
Service/product providers included under the CPFIS

Notes:
1 Can only manage investment-linked insurance sub-funds under CPFIS unlike the rest of the FMCs, which can manage unit trusts, ILP funds/sub-funds, exchange traded funds, and fund management accounts under CPFIS.
2 FMCs, which offer Fund Management Account services.
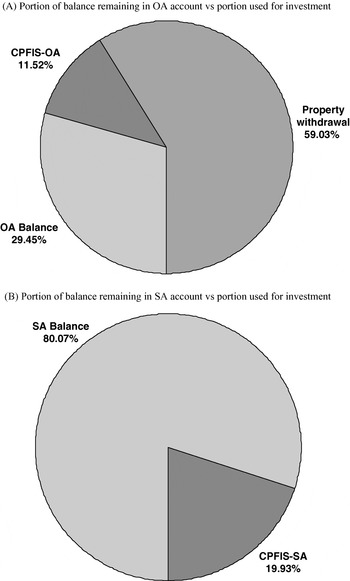
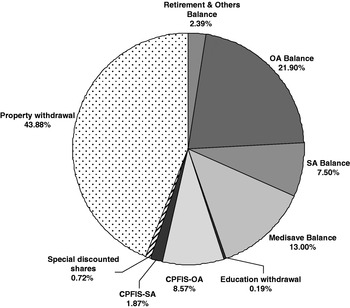
Table 7 and Figure 4 show, on a cumulative basis, that some 59% of OA savings have been utilized for housing and 12% for investment. This implies that about 29% of cumulative contributions have remained in the OA fund, where they currently earn 2.5% annual (nominal) interest. The reverse is true for the funds in the SA, where account holders have left the bulk of their saving (80%) deposited with the CPF. A possible explanation for the strong tendency of investors to leave their SA money with the CPF is that the SA has traditionally paid a higher return compared to the OA. In addition, account holders may be less willing to assume higher risk for their retirement accounts. Further detail on how CPF members deployed their funds over the years is provided in Figure 5. It shows that the bulk of the CPF saving (44%) has gone to the purchase of residential and investment properties. A sizeable portion (29% of cumulative CPF funds) remains in the OA and SA earning guaranteed interest.
Portion invested and balance remaining in CPF ordinary and special accounts

Cumulative use of CPF funds (OA and SA combined)

Cumulative use of CPF funds as of end 2005

Note: Net amount withdrawn under Medishield, Medisave, Home Protection, Dependent Protection, Minimum Sum, Section 15 & 25 withdrawals not included.
Source: Data provided by the CPF Board.
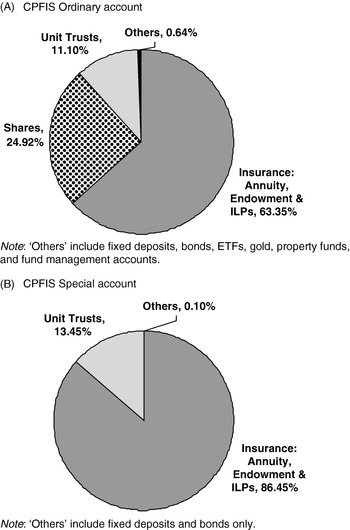
Currently, about 55% of active members invest in the CPFIS scheme in their OA accounts, though only about 10% of total accumulated saving has thus far been devoted to investment instruments and insurance-linked products. Panel A in Figure 6 shows that, of funds in the CPFIS-OA investment scheme, 63% is held in insurance products, 25% is invested in shares, and 11% is in unit trusts. Interestingly, the negligible 0.64% held in other instruments such as fixed deposits, bonds, Exchange Traded Funds (ETFs), gold, property funds, and fund management accounts, suggests that most investors do not fully utilize the menu of investment options they have been offered. Panel B in Figure 6 shows that in the CPFIS-SA investment scheme, on the other hand, most participants held insurance products to the tune of 86% of their saving. Remaining funds (14%) were invested primarily in unit trusts. In other words, the asset allocation patterns of OA and SA monies have been starkly different to date: participants seem prepared to take more risk with their OA funds compared to their SA saving. It would appear that the SA funds are put in a separate ‘mental account’ targeted to retirement and are not generally actively managed.Footnote 11
Allocation of investments across CPFIS accounts

Asset allocation patterns in Singapore's CPF Investment Scheme (CPFIS)
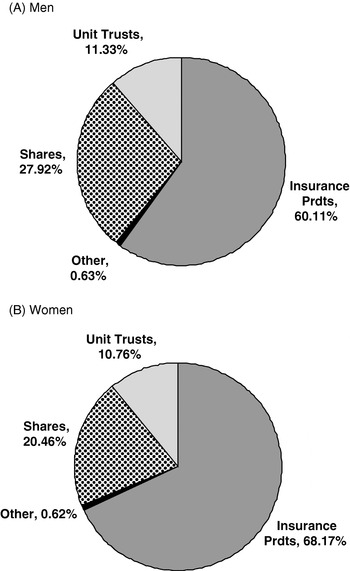
Next we develop a more detailed view of CPFIS asset allocation patterns, focusing on age, sex, and income patterns; the analysis is based on aggregate data as individual account records are not available for research.Footnote 12Figure 7 shows that participants who elected to invest outside the CPF default fund committed most of their funds to three investment instruments, namely insurance products, shares, and unit trusts. Both men and women devoted similar percentages of their money to unit trusts, and both invested less in instruments such as gold, bonds, fixed deposits, ETFs, and property funds. Yet men tended to be slightly more proactive in their investments: they invested 28% of their funds in shares, compared to 21% for women. Conversely, women were more likely to opt for insurance products (68%), compared to men (60%). This is similar to US research on retirement account holders, which finds that higher income men tend to seek riskier investments and trade more in their accounts (Mitchell et al., Reference Mitchell, Gary, Steve and Takeshi2005).
Investment patterns in CPF ordinary accounts by sex

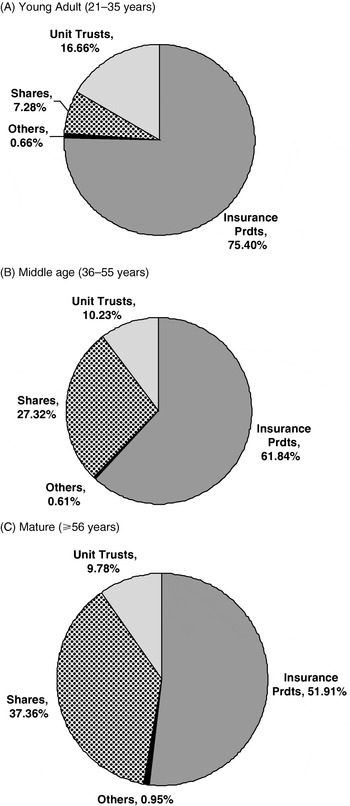
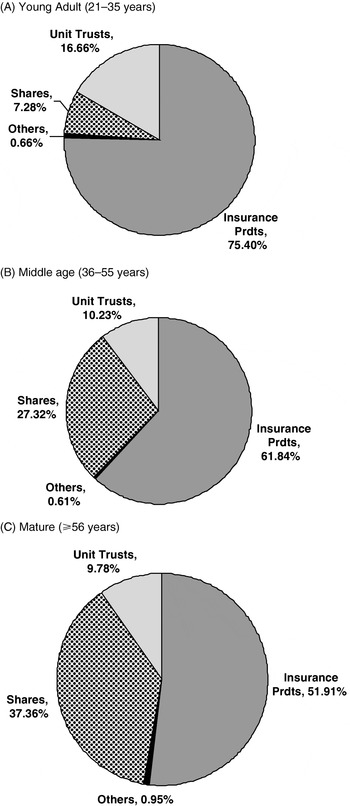
It is also of interest to ask whether investment behavior becomes less risky as workers age. Only a partial picture is available as we have information only on the CPFIS-OA accounts but not participants' entire portfolios. Nevertheless, Figure 8 shows that CPF investors appear more rather than less devoted to risky investments as they age. Thus, the mature (56+) age group commits a higher proportion to stock investments and less to insurance products, compared to younger age-groups. We also find that the youngest workers are more likely to delegate portions of their saving accounts to investments managed by professionals, as seen from their higher holdings of unit trusts (14%); by contrast, the mature group tends to invest more heavily in shares on their own. In data not shown, older women prove slightly more conservative, investing more in insurance products than men. These general patterns again conform to US findings, where higher income, older men are more likely to hold riskier portfolios as compared their female and younger counterparts – and trade more, as well, often to their detriment (Mitchell et al., Reference Mitchell, Gary, Steve and Takeshi2006).
Investment patterns in CPF ordinary accounts by age
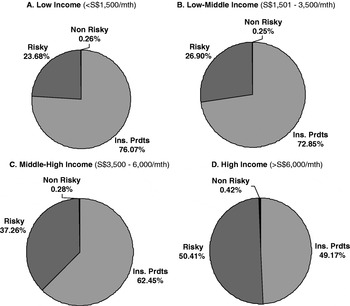
Another perspective is offered in Figure 9, which displays investment scheme asset allocation patterns by risk category and participant salary levels. We group the CPFIS products into three, namely insurance products, relatively less risky products (bond and fixed deposits), and relatively more risky products (which include shares, unit trusts, exchange traded funds, gold, and property funds).Footnote 13 The income categories we tabulate focus on low earners (earning less than S$1,500/mo.), low-middle (S$1,500–3,500/mo.), high-middle (S$3,500–6,000/mo.), and high (S$6,000+/mo).Footnote 14 Here we see that low and lower-middle earners are less likely to hold risky investments, with at least 70% of their CPFIS portfolios held in insurance products. As salary levels rise, the fraction in insurance products falls, first to 63%, and then to under 50% for the highest earners. Conversely, higher-earners hold between one-third and half of their investment accounts in risky forms, a finding consistent with international research (Mitchell et al., Reference Mitchell, Gary, Steve and Takeshi2005).
Investment patterns in CPF ordinary accounts by risk type and income

Overall, the observed regularity is that people who move their funds to the CPFIS system tend to buy insurance products, and this holds across age, sex, and income groups. This is not due to preferential tax treatment on income received from insurance products, since investment profits and interest earned from investments, most dividends, and income received from CPFIS annuities paid directly as cash, are currently not taxable.Footnote 15 Rather, it may be that in Singapore as elsewhere, insurance agents are successfully able to emphasize the joint appeal of protection and investment (especially for investment-linked insurance products), which seems particularly attractive for CPF money that cannot be accessed until the age of 55.
Analyzing the impact of fees and charges for CPFIS options
As noted above, additional investment choices have been added over the years, to the menu of funds into which CPF participants may invest their mandatory savings. As of 2006, there were some 400 investment portfolios on offer to CPF participants. Naturally, this additional diversity of fund choices imposes on participants the responsibility to devote more attention to the risks and benefits of diversifying outside the traditional CPF fund managed by the government. Diversification into other assets outside the traditional CPF portfolio also brings with it the potential for high management fees and commissions associated with having many small funds.
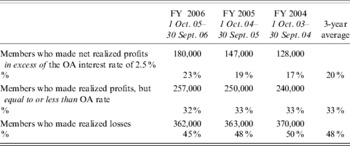
With such a rich offering of investment options, it is of interest to inquire whether CPFIS participants have been successful in increasing their retirement savings. Recently the story has not been an encouraging one, as shown in Table 8 (for Fiscal Years 2004–2006). Here almost half of CPFIS-OA investors (48%) incurred losses from investing on average, while one-third realized profits equal to or less than the default OA rate of 2.5%. Only one-fifth of the investors made net realized profits in excess of the OA interest rate. This poor investment performance has not gone unnoticed by policymakers. Indeed Prime Minister Lee Hsien Long expressed concern in 2005 regarding the CPFIS scheme, pointing to high investment fees and expenses as an explanation for low returns:Footnote 16
[W]e must help CPF members to earn better long-term returns on their savings. Over the years, we have opened up the CPF Investment Scheme (CPFIS) and given members considerable latitude to invest their CPF savings as they judge best. However, this has not always worked out as well as we hoped, because the options available to the members are not well tailored to their needs, and it is difficult to educate members adequately on how to plan for their long-term needs. Almost three-quarters of the members who invested under CPFIS from 1993 to 2004 would have been better off leaving their savings with the Board. In particular, those who invested in unit trusts and investment-linked products (ILPs) have generally received mediocre returns. One important reason why CPFIS returns have been mediocre is the high cost of investing. For example, the annual cost to investors in a retail unit trust in Singapore is typically double that of the US. This is because the market is fragmented, many of the unit trusts and ILPs are small, and the overheads and fees are high.
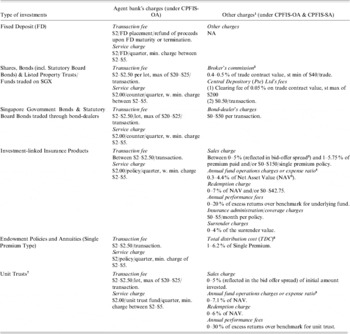
To explore the range of charges levied under the CPF investment schemes, we have assembled Table 9 from the CPF Board's website, which presents a rather bewildering array of fees for different investments and a wide diversity of front-end commissions, back-end loads, and annual service charges. For instance, the holder of a unit trust may pay sales charges, transaction fees, service charges, annual fund operations fees, performance fees, and sometimes redemption charges. Purchasers of investment-linked insurance products also pay transaction and service fees as well as sales charges, expense ratios, performance fees, and redemption charges. Compared to the US institutional market, there would appear to be far more diversity and complexity in the Singapore case (Mitchell, Reference Mitchell, Gary, Steve and Takeshi1998).
Realized profits/losses for investments held under the CPF investment scheme ordinary account (CPFIS-OA): FY04-06

Source: Constructed from CPFIS Profits/Losses for the Financial Year ended 31 September 2005 and 2006. www.cpf.gov.sg/cpf_info/ie/IE_reportpl.pdf
Charges incurred for investments under the CPF investment scheme

Notes:
1 These charges are estimates only and may not be exhaustive. CPF members are advised to check with the product providers on the full range of charges payable. Charges also exclude GST, unless otherwise stated.
2 Broking fees are fully liberalized now and the charges depend on the broking houses. The broker's commission mentioned is the range that the majority of the broking houses are charging.
3 Bid–offer spread is the difference between the price at which the product is offered for sale (‘offer’) and the price at which the product provider will redeem the product (‘bid’.).
4 Includes annual management fees which range from 0.10% to 1.85% of NAV.
5 Net asset value (NAV) is the total market value of the securities in a funds portfolio divided by the number of units currently outstanding.
6 Total distribution cost (TDC) refers to the total costs that an insurance company is expected to incur and includes commissions and cost of benefits and services paid to the distribution channel.
7 Generally, online fund distributors charge lower front-end fees than brick-and-mortar distributors like banks and brokerages.
8 Includes annual management fees which may range from 0% to 3% of NAV.
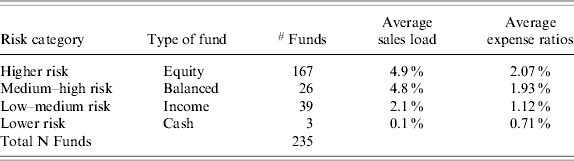
As these may be perplexing to many participants, we next turn to an evaluation of how such costs can impact the return of retirement saving for a typical CPF-IS unit trust investor over different time horizons. Our strategy is to isolate the impact of costs from returns, allowing us to compute the rate of return that an investor requires so as to ‘cost-recover’ the expenses over different time horizons. Accordingly, in what follows, we develop a hurdle rate notion which asks what the investor's net return would have to be, after costs, so the investor would do better than simply defaulting his money into the government-run fund. Specifically, we simulate the effect of transaction costs on an investment of $1 held for one year (short term), five years (medium term), and 10–20 years (long-term), after subtracting the cost components of the unit trust investments. In the simulation, we assume that the prices of unit trusts remain unchanged so the change in the fund position reflects solely cost impacts; we also assume that management fee and other annual operating costs are fixed at the current average rates relevant to the four fund types appearing in Table 10: equity, balanced, income, and money market funds (based on Mercer's risk classification system).Footnote 17 Average costs by fund types are presented in Table 10 from a sample of 235 unit trusts representing 97% of the CPFIS unit trust universe (as of 30 June 2006).
Sales loads and expense ratios for CPF investment scheme unit trusts
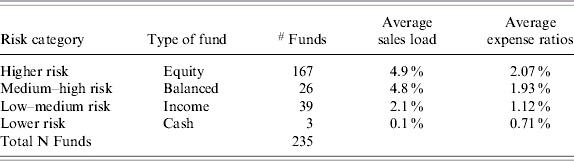
Note: The sales load comprises both front-end and back-end sales charges. Annual operating costs comprise fees for management, custodian, trustee, administration, and other major fees paid by the unit trust out of the fund's net asset value, and is estimated using the total expense ratio publicly reported by Investment Management Association of Singapore (IMAS) under its Fund Information Service website (http://www.fundsingapore.com).
Source: Authors' computations using fund prospectuses and IMAS-reported expense ratios as at 30 June 2006.
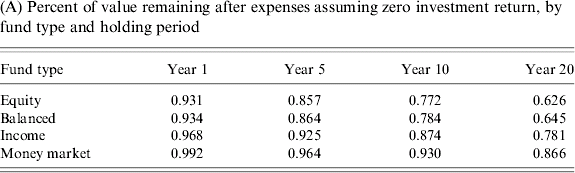
These average transaction costs by fund type are applied to a $1 investment held for various time periods assuming the fund earns a zero rate of return.Footnote 18 For year 1, we apply both the one-off sales load and annual operating costs, where the sales load comprises both front-end and back-end sales charges, operating costs include fees for management, custodian, trustee, administration, and other major fees paid by the unit trust out of the fund's net asset value; the performance fee is excluded.Footnote 19 Thereafter annual charges are subtracted as relevant. Table 11 (Panel A) summarizes the results, where we see that the $1 investment was steadily eroded by annual operating costs assuming zero returns. For the ten-year holding period, the $1 invested in the average equity fund would be predicted to shrink to $0.772, sliding further to $0.626 by year 20. Expenses are lower for income funds: the same $1 invested there would be worth $0.874 in year 10 and $0.781 by year 20. Using these results, we next compute the annual rate of return required for the investor to ‘cost-recover’ for each fund type which appear in Table 11 (Panel B). Not surprisingly, a longer holding period is beneficial in that a lower rate of return is needed to ‘cost-recover’. This is mainly because the one-off sales loads are spread over a longer period.
Simulation study of impact of fund expenses by fund type for alternative holding periods
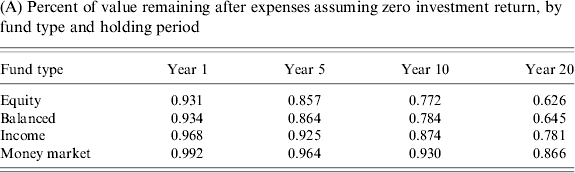
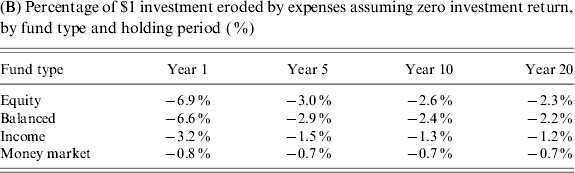

Notes: This simulation study assumes that the prices of unit trusts remain unchanged so the change in the fund position solely reflects cost impacts on a $1 investment over 1 year, 5 years, 10 years, and 20 years. Costs include the one-off sales load and the annual operating costs for each of the four fund types as presented in Table 10. The sales load comprises both front-end and back-end sales charges. Annual operating costs comprise fees for management, custodian, trustee, administration, and other major fees paid by the unit trust out of the fund's net asset value, and are estimated using the total expense ratio publicly reported by Investment Management Association of Singapore (IMAS) under its Fund Information Service website (www.fundsingapore.com). The performance fee is excluded from the total expense ratio.
Source: Authors' computations using fund prospectuses and CPF (2006).
To complete the picture, we then compute the minimum hurdle rate of return that a fund must generate if it is to beat the guaranteed returns attainable by leaving one's money in the government-managed account, currently, 2.5% and 4% for OA and SA monies, respectively. Results for CPFIS unit trusts are provided in Table 11 (Panel C), where over a 1-year period, the OA hurdle rate ranges from 3.3% for money market funds to 9.4% for equity funds. Over a 20-year period they range from 3.2% for the money market funds to 4.8% for equity funds. For SA account holders over the same one-year period, the hurdle rate is 4.8% for money market funds and 10.9% for equity funds. Over a 20-year time frame, it is 4.7% for the money market and 6.3% for equity funds. Such high threshold returns may rationalize why so many CPF accountholders leave their investible funds in the default OA and SA accounts.
Lowering costs for CPFIS investors
In recent years, steps have been taken to better inform members about investment options and expense ratios. For instance, the Investment Management Association of Singapore (IMAS) recently published standardized cost formulae across funds (www.fundsingapore.com). Nevertheless CPF members must still factor in additional investment costs not commonly wrapped into expense ratios, including back- and/or front-end loads, annual asset-based and fixed charges, and wrap fees; these have yet to be collated into an easy-to-understand format.
In late 2005, the CPF Board announced several requirements for funds seeking to be newly included in the CPFIS menu; one change was such funds would be required to meet a higher relative performance standard than previously required, such that the fund had to have a minimum of a three-year performance record that could not fall below the top 25 percentile of funds in a global peer group.Footnote 20 As this standard exceeds the older benchmark of the top 50 percentile, it is likely to represent an improvement over past practice. Nevertheless, some degree of subjectivity remains as the evaluators take into account the fund managers' capabilities, the fund's investment philosophy, the quality of the fund's research and analysis, and the way the fund constructs and implements its portfolio. Furthermore, funds already on the CPFIS permitted list are not held to these new standards. A second change adopted by the Board in late 2005 was the explicit introduction of expense ratio targets for the first time. The expectation is that: ‘[t]he CPF Board will therefore … (induce) lower cost ratios, enhance transparency to help members make informed choices, and encourage consolidation among the funds to achieve greater economies of scale.’Footnote 21 Specifically, any new fund must have an expense ratio below the median of existing CPFIS funds in its risk category. In practice this implies that so-called ‘higher risk’ funds investing mainly in equities will be held to a cap of 1.95% of assets per year; ‘medium to high’ risk funds holding both equities and bonds must charge less than 1.75% of assets; ‘low to medium’ risk funds investing in bonds or fixed income must charge less than 1.15% pa; and ‘lower risk’ funds (money market funds) cannot exceed an annual expense ratio of 0.65%.Footnote 22 While a full-scale comparison of these expense ratios with international charges is beyond the purview of this paper, it is clear that the CPF costs are still not on the low side. For instance, a recent review of US fund expenses found that the asset-weighted average expense ratio for stock funds was 1.13%, and for bond funds at 0.9% in 2005 (ICI, 2006) – and these figures include a pro-rata share of front-end loads. Furthermore, most US investors held their money in lower-cost funds. Consequently, adopting an expense target as in Singapore is a positive step, though focusing on the median fund charge in Singapore, exclusive of front-end loads, may still produce costs that are high by developed-country standards.
The issue of fees and charges remains one of national concern, as evidenced by a recent CPF Board statement that, in the future, front load charges will be capped at 3% (as of 7/1/07) in addition to the already announced expense ratio caps (from 1/1/08).Footnote 23 This is a significant reduction from the 5% front load often charged by CPFIS funds in the past, and these changes represent positive steps to bring the cost of the CPF Investment Scheme nearer to developed country standards.
Discussion and conclusions
Singapore has one of the world's lowest fertility rates (at around 1.2 per 1,000),Footnote 24 and longest life expectancies (over age 80 at birth),Footnote 25 so this nation is aging quickly. Indeed, in the next two decades, it will overtake all but Japan in its fraction of population elderly. Accordingly, it is valuable to assess how the Singaporean Central Provident Fund (CPF) might become more effective in building retiree wealth. Thus far, it appears that the bulk of workers' saving (44%) has gone to purchase homes, leading to an asset-rich, cash-poor phenomenon (McCarthy et al., Reference Mitchell and Feldstein2002). We have also shown that contributors tend to default their remaining saving to the CPF government-managed investment pool. The few participants who elect outside investment products tend to be high-income males rather than lower-paid workers and women. High expenses and fees, as well as inertia, explain why few CPF account holders invest outside the default government investment pool.
More attention could be devoted to lowering fund expenses and commissions in the CPFIS system. It would be useful to aggregate the myriad of data on fees, expenses, loads, wrap fees, and other charges as they are dispersed across numerous websites and expressed in different terms, depending on the specific product in question. It could be helpful for the CPF to develop a single easy-to-use web calculator making these comparisons simpler. For instance, a drop list could illustrate for each fund the component costs over a range of holding periods. It would be useful to show itemized costs as well as an all-in annualized cost, for the various products projected over various periods (e.g. 1, 5, 10, 20 years).
It might also be beneficial to streamline and rationalize the investment menu offered to participants. Currently more than 400 funds are offered to CPF investors, but this list includes few index-linked funds, ETFs, or life-cycle funds, and no inflation protected instruments are currently on offer.Footnote 26 Furthermore, while new funds are screened for cost efficiency, more stringent criteria might be adopted to screen out under-performing existing funds at regular intervals.
It might be useful to consider consolidating participants' investments to bring about more competition to drive down costs. One interesting development in this context is the advent of low-cost Life Cycle funds which might be adopted as the ‘default’ investment mix for otherwise naïve or underconfident investors. Employees could then be automatically defaulted into a balanced fund based on their age, unless they actively select some other investment portfolio. In Chile, for instance, pension managers offer up to five funds, ranging from ‘Fund A’, which holds 80% of the portfolio in equities, to ‘Fund E’, which holds 100% fixed income; ‘Funds B-D’ hold intermediate percentages in equities. Active workers may elect up to two funds at a time, offered by a single money manager, and they will be automatically transitioned to more conservative portfolios as they age, unless they elect otherwise (Arenas de Mesa et al. Reference Arenas de Mesa, Bravo, Behrman, Mitchell, Todd, Stephen and Tapenforthcoming). A low-cost Life Cycle approach might be useful in the Singaporean case, in view of many affiliates' inertia regarding investment choices.
It could also be useful and important to educate CPF investors regarding capital market risk and return, as the government seeks to streamline the range of investment choices and bring down expenses. The US experience with investment education suggests that even relatively well-educated subjects can have a hard time understanding and acting on information regarding mutual fund charges (Choi et al., Reference Clark2005; Lusardi and Mitchell, Reference McCarthy, Mitchell and Piggott2006). To the extent that individual investors are poorly equipped to make investment choices in their retirement accounts, this places more burden on policymakers' shoulders to fashion the best possible environment for strengthening retirement security.
Finally, policymakers may seek to restrain the amount of retirement saving going into property purchases so that CPF participants have sufficient funds to finance their retirement years. An alternative may be for the financial sector to spur the growth of reverse mortgages permitting homes to be pledged to financial institutions, in return for a retirement annuity; this is made complex by the fact that most (85%) homeowners purchase housing development flats (public housing) on leasehold from the government. Another option might be to allow homeowners to freely rent out their apartments for income; while steps are being taken in this direction, numerous restrictions remain on the use of these apartments, including rental. Removing these restrictions may alleviate the asset-rich, cash-poor syndrome.