1. Introduction
When a liquid evaporates it loses energy, this is why sweating cools us down. Evaporation is an effective cooling mechanism widely employed by nature, for example, as a body-temperature control for mammals (Sherwood Reference Sherwood2005), and in engineering applications, such as spray drying, spray cooling and microelectronics cooling (Dhavaleswarapu, Murthy & Garimella Reference Dhavaleswarapu, Murthy and Garimella2012; Ling et al. Reference Ling, Zhang, Shi, Fang, Wang, Gao, Fang, Xu, Wang and Liu2014; Plawsky et al. Reference Plawsky, Fedorov, Garimella, Ma, Maroo, Chen and Nam2014). The use of pot-in-pot coolers by mankind can be tracked back to Bronze Age civilisation (Evans Reference Evans2000); a device that relies on the principle of evaporative cooling.
The description of phase-transition processes at microscale and nanoscale is intriguing, mainly owing to the inability of classical continuum theories to accurately capture the rarefied vapour-flow characteristic. Specifically, as the representative physical length scale ( $\ell$) of the flow becomes comparable to the mean free path (
 $\lambda$) in the vapour, i.e. the Knudsen number
 $({Kn}=\lambda /\ell )\approx 1$ (Bird Reference Bird1994; Cercignani Reference Cercignani2000; Struchtrup Reference Struchtrup2005; Sone Reference Sone2007; Torrilhon Reference Torrilhon2016). The classical continuum description based on the Euler or Navier–Stokes–Fourier (NSF) equations is valid only in regimes for which
 ${Kn}\lesssim 0.001$, this is referred to as the hydrodynamic regime. There are, of course, computational atomistic techniques, such as molecular dynamics (MD) simulations, which are capable of modelling phase transition at nanoscales. However, owing to computational time and memory limitations, it is impractical to use them for multiscale processes, which span a wide range of time and length scales.
The behaviour of a dilute vapour phase can readily be described by the Boltzmann equation, which is an evolution equation for the (velocity) distribution function of vapour molecules (Bird Reference Bird1994; Cercignani Reference Cercignani2000). The Boltzmann equation offers the complete mesoscopic description of the vapour for all ranges of  ${Kn}$, however, the exact analytical solution of the Boltzmann equation is intractable in a general case, whereas its numerical solutions are computationally very expensive. Grad, in his seminal work (Grad Reference Grad1949a,Reference Gradb), proposed an asymptotic solution procedure for the Boltzmann equation through the method of moments. A variety of other extended fluid-dynamics equations, aiming to describe processes under rarefied conditions, have been developed, see e.g. Eu (Reference Eu1992), Müller & Ruggeri (Reference Müller and Ruggeri1998), Kremer (Reference Kremer2010), Struchtrup (Reference Struchtrup2005), Chakraborty & Durst (Reference Chakraborty and Durst2007), Dongari, Chakraborty & Durst (Reference Dongari, Chakraborty and Durst2010), Myong (Reference Myong2014) and Torrilhon (Reference Torrilhon2016). These models close the gap between classical fluid dynamics and kinetic theory; that is, they aim at a good description in the transition regime (
 $0.001\lesssim Kn\lesssim 1$).
The classical phase-transition models, found in the literature, assume that the temperature and the velocity tangential to the interface are continuous across it. However, it is now well established, both experimentally and theoretically (McGaughey & Ward Reference McGaughey and Ward2002; Bond & Struchtrup Reference Bond and Struchtrup2004; Rana, Lockerby & Sprittles Reference Rana, Lockerby and Sprittles2019), that such assumptions are invalid at a nano-confined liquid–vapour interface. For such small length scales, the Knudsen number lies in the transition regime (or beyond) and a difference in velocity and temperature jump are observed across the interface, thus, it is important to employ models capable of describing strong non-equilibrium effects that occur at high Knudsen numbers. In Rana et al. (Reference Rana, Lockerby and Sprittles2019), the lifetime of an evaporating nanodroplet was studied. The study revealed that, when the drop size is large (larger than a micrometre), the square of its diameter decreases in proportion to time, this is known as the  ${d}^2$-law. However, as the diameter approaches sub-micrometre and nanoscales, a crossover to a new behaviour is observed, with the diameter now reducing in proportion to time (following a ‘
 $d$-law’). By taking into account the temperature discontinuity at the liquid–vapour interface, the drop's lifetime was predicted correctly.
Notably, a full theory on boundary conditions is still missing for these nonlinear extended fluid-dynamics equations, for which the notion of solvability and stability is more intricate. The approach suggested by Grad (Reference Grad1958) and recently explored by researchers (Gu & Emerson Reference Gu and Emerson2007; Torrilhon & Struchtrup Reference Torrilhon and Struchtrup2008; Gu & Emerson Reference Gu and Emerson2009; Struchtrup et al. Reference Struchtrup, Beckmann, Rana and Frezzotti2017; Rana, Lockerby & Sprittles Reference Rana, Lockerby and Sprittles2018b), violates Onsager symmetry conditions (Rana & Struchtrup Reference Rana and Struchtrup2016; Beckmann et al. Reference Allen and RaabeReference MillikanReference Beckmann, Rana, Torrilhon and Struchtrup2018; Sarna & Torrilhon Reference Sarna and Torrilhon2018), leading to instabilities which influence the convergence of numerical schemes and prevent the convergence of moments (Torrilhon & Sarna Reference Torrilhon and Sarna2017; Zinner & Öttinger Reference Zinner and Öttinger2019).
The second law of thermodynamics (entropy inequality) plays an important role in finding constitutive relations in the bulk (de Groot & Mazur Reference de Groot and Mazur1962; Gyarmati Reference Gyarmati1970; Harten Reference Harten1983; Lebon, Jou & Casas-Vázquez Reference Lebon, Jou and Casas-Vázquez2008), in designing numerical schemes (Tadmor & Zhong Reference Tadmor and Zhong2006; Kumar & Mishra Reference Kumar and Mishra2012; Chandrashekar Reference Chandrashekar2013), as well as in developing physically admissible boundary conditions (Bond & Struchtrup Reference Bond and Struchtrup2004; Struchtrup & Torrilhon Reference Struchtrup and Torrilhon2007; Kjelstrup & Bedeaux Reference Kjelstrup and Bedeaux2008; Rana & Struchtrup Reference Rana and Struchtrup2016; Schweizer, Öttinger & Savin Reference Schweizer, Öttinger and Savin2016; Rana, Gupta & Struchtrup Reference Rana, Gupta and Struchtrup2018a; Beckmann et al. Reference Beckmann, Rana, Torrilhon and Struchtrup2018; Sarna & Torrilhon Reference Sarna and Torrilhon2018). For the latter, one determines the entropy generation at the boundary and finds the boundary conditions as phenomenological laws that guarantee positivity of the entropy generation at the boundary. For example, in Struchtrup & Torrilhon (Reference Struchtrup and Torrilhon2007), Rana & Struchtrup (Reference Rana and Struchtrup2016), Sarna & Torrilhon (Reference Sarna and Torrilhon2018) and Beckmann et al. (Reference Beckmann, Rana, Torrilhon and Struchtrup2018) the linearised second law (taking a quadratic entropy) was employed to determine boundary conditions for the linearised version of the moment equations. The resulting phenomenological boundary conditions were thermodynamically consistent for all processes and complied with the Onsager reciprocity relations (Onsager Reference Onsager1931).
Over the last few years, an impressive body of research work has been devoted to the development of constitutive theories whose closed conservation laws guarantee the second law (Öttinger Reference Öttinger2010; Struchtrup & Torrilhon Reference Struchtrup and Torrilhon2010; Torrilhon Reference Torrilhon2012; Liu et al. Reference Liu, Gomez, Evans, Hughes and Landis2013; Paolucci & Paolucci Reference Paolucci and Paolucci2018). The Burnett equations, which are obtained perturbatively from the kinetic theory, are unstable (Bobylev Reference Bobylev2006) and owing to the lack of any coherent second law these equations lead to physically inadmissible solutions (Struchtrup & Nadler Reference Struchtrup and Nadler2020). The Burnett equations are unstable owing to the lack of a proper entropy inequality. On the other hand, the moment equations (Grad 13-moment equations, regularised 13-moment equations, etc.) are accompanied by proper entropy inequalities, and are stable, but only in the linear cases (Struchtrup & Torrilhon Reference Struchtrup and Torrilhon2007; Rana & Struchtrup Reference Rana and Struchtrup2016; Torrilhon & Sarna Reference Torrilhon and Sarna2017). In Rana et al. (Reference Rana, Gupta and Struchtrup2018a), the coupled constitutive relations (CCRs) were obtained, as an enhancement to the NSF equations, by considering a correction term to the non-convective entropy flux (in addition to the classic entropy flux, i.e. heat-flux and thermodynamic temperature). As a result, the CCRs add several second-order terms to the NSF equations, in the bulk and in the boundary conditions, capturing important rarefaction effects in moderately rarefied conditions, such as the Knudsen minimum, and non-Fourier heat transfer, which cannot be described by classical hydrodynamics (Rana et al. Reference Rana, Gupta and Struchtrup2018a).
Throughout this paper, we are going to utilise the CCR theory, thereby some comments about these equations are in order. The CCR theory originates from the arguments of irreversible thermodynamics. In CCR theory, additional terms appear in the constitutive relations of the NSF equations, where the coupling between constitutive relations for the heat-flux vector and stress tensor is introduced via a coupling coefficient ( $\alpha _0$). For
 $\alpha _0 = 0$, the coupling vanishes and one obtains the classical NSF equations. In addition, for the flow conditions considered in the paper (steady-state and linearised equations), the CCR system (conservation laws plus CCR) reduces to the linearised Grad 13-moment equations (Grad-13) for
 $\alpha _0 = 2/5$; a value obtained for Maxwell molecule (MM) gases (Struchtrup Reference Struchtrup2005). Thus, under suitable assumptions, this paper provides a unified framework for the NSF equations, Grad-13 and the CCR system. More precisely, we explore the method of fundamental solutions (MFS) for the CCR system (hence, NSF, Grad-13) that can be useful for constructing solutions over a wide range of free-stream profiles and complex geometries.
The MFS (Kupradze & Aleksidze Reference Kupradze and Aleksidze1964) is a mesh-free numerical technique for solving partial differential equations based on using the fundamental solutions (Green's functions). The main advantage that the MFS has over the more classical numerical methods, such as the finite-difference method and the finite-element method, is that its solution procedure does not require discretisation of the interior of the computational domain, thus a significant amount of computational effort and time is saved. Furthermore, the MFS does not require (the very computationally expensive) three-dimensional mesh generation. As a result, the MFS is ideally suited for the problems involving moving interfaces and phase-change processes. The first steps towards utilising MFS for rarefied gas flows were taken by Lockerby & Collyer (Reference Lockerby and Collyer2016), who derived Green's functions for the Grad-13 system and utilised them to solve some canonical problems. The present study further develops the MFS-based framework (MFS–CCR) for phase-transition boundary-value problems, which, as we show later, involves the derivation of new Green's functions, generated by a singular mass source/sink term. In this paper, a set of temperature-jump and velocity-slip boundary conditions for a liquid–vapour interface will be derived for the linearised CCR system and implemented within the framework of MFS. However, it should be noted that the developed MFS methodology in this paper can also be applied to other type of liquid–vapour interface boundary conditions, such as the classical Schrage law (Schrage Reference Schrage1953), statistical rate theory (Ward & Fang Reference Ward and Fang1999) and phenomenological approach based on Hertz–Knudsen–Schrage relation (Liang, Biben & Keblinski Reference Liang, Biben and Keblinski2017). We do not address these boundary conditions in this paper, instead we leave this for a future investigation.
The remainder of this paper is organised as follows. In § 2, we introduce the linearised and dimensionless CCR model. In § 3, the derivation of Green's functions for the CCR model is presented, followed by the derivation of thermodynamically consistent boundary conditions at the phase interface in § 4. A brief summary of the MFS and implementation is given in § 5. In § 6.1 the numerical scheme is applied to evaporation from a spherical droplet and low-speed gas flow around a sphere (for which the analytical solutions exist) in order to validate our numerical scheme. To illustrate the utility of fundamental solutions for complex geometries, in §§ 6.2, 6.3 and 6.4 we solve the motion of two spherical non-evaporating droplets with different orientations, evaporation of two interacting droplets and evaporation of a deformed droplet, respectively. Concluding remarks are made in § 8.
2. The linearised NSF, Grad-13 and CCR systems
In this paper we only consider flow conditions where the deviations from a constant equilibrium state, given by a constant reference density  $\hat {\rho }_{0}$, a constant reference temperature
 $\hat {T}_{0}$ and all other fields zero, are small. Thereby, the governing equations can be linearised with respect to the reference state. The governing equations are put into dimensionless form by introducing
 \begin{equation} \boldsymbol{r}=\frac{\boldsymbol{\hat{r}}}{\hat{\ell} }, \quad \rho =\frac{\hat{\rho}- \hat{\rho}_{0}}{\hat{\rho}_{0}} \quad \textrm{and}\quad T=\frac{\hat{T}-\hat{T}_{0}}{\hat{T} _{0}}{,} \end{equation}
where  $\boldsymbol {r}$ is the position vector in Cartesian coordinates,
 $\hat {\ell }$ is the reference length scale and
 $\rho$ and
 $T$ are the dimensionless perturbations in the density and temperature from their reference values, respectively; hats denote dimensional quantities. The dimensionless velocity vector
 $\boldsymbol {v}$, the stress tensor
 $\boldsymbol {\varPi }$ and the heat-flux vector
 $\boldsymbol {q}$ are
 \begin{equation} \boldsymbol{v}=\frac{\boldsymbol{\hat{v}}}{\sqrt{{\hat{R}}\hat{T}_{0}}}{, }\quad \boldsymbol{\varPi}=\frac{\boldsymbol{\hat{\varPi}}}{\hat{\rho}_{0}{\hat{R}}\hat{T}_{0}} \quad \text{and}\quad \boldsymbol{q}=\frac{\boldsymbol{\hat{q}}}{\hat{\rho}_{0}\left( {\hat{R}}\hat{T}_{0}\right) ^{3/2}}{,} \end{equation}
where  ${\hat {R}}$ is the gas constant. The perturbation in pressure
 $p$ is given by a linearised equation of state
 \begin{equation} p = \frac{\hat{\rho}\hat{R}\hat{T}}{\hat{\rho}_{0}\hat{R}\hat{T}_{0}}-1 = \left( 1+\rho \right) \left( 1+\theta \right)-1 \approx \rho +\theta, \end{equation}
where the last equation assumes small perturbations  $\rho$ and
 $\theta$, hence
 $\rho \theta$ is assumed to be negligible in comparison to
 $\rho +\theta$.
Accordingly, dimensionless and steady-state (linearised) conservation laws for mass, momentum and energy read
 \begin{equation} \boldsymbol{\nabla} \boldsymbol{\cdot} \boldsymbol{v}=0{,\quad } \boldsymbol{\nabla} p+\boldsymbol{\nabla} \boldsymbol{\cdot} \boldsymbol{\varPi}=0 \quad \text{and} \quad \boldsymbol{\nabla} \boldsymbol{\cdot} \boldsymbol{q}=0{.} \end{equation}
It should be noted that conservation laws (2.4a–c) contain the stress tensor and heat-flux vector as unknowns, hence constitutive equations are required for these quantities. If the CCR closure is adopted, the (linearised) constitutive relations for  $\boldsymbol {\varPi }$ and
 $\boldsymbol {q}$ read (Rana et al. Reference Rana, Gupta and Struchtrup2018a)
 \begin{equation} \boldsymbol{\varPi }={-}2{Kn}\langle \boldsymbol{\nabla} \boldsymbol{v}\rangle -2\alpha _{0} {Kn}\langle \boldsymbol{\nabla} \boldsymbol{q}\rangle \quad \text{and}\quad \boldsymbol{q}={-}\frac{ c_{p}{Kn}}{Pr }\left( \boldsymbol{\nabla} T+\alpha _{0}\boldsymbol{\nabla} \boldsymbol{\cdot} \boldsymbol{\varPi } \right), \end{equation}
where  $c_{p}=5/2\ ({=}\hat {c}_{p}/\hat {R})$ is the specific heat for mono-atomic gases,
 $Pr$ is the Prandtl number and the Knudsen number
 ${Kn}=\hat {\mu }_{0}/( \hat { \rho }_{0}\sqrt {R\hat {T}_{0}}\hat {\ell } )$, where
 $\hat {\mu }_{0}$ is the viscosity of the gas at the reference state. Furthermore, the chevrons in (2.5a,b) denote the traceless and symmetrical component of the tensor, i.e.
 \begin{equation} \langle \boldsymbol{\nabla} \boldsymbol{v}\rangle =\tfrac{1}{2}\left( \boldsymbol{\nabla} \boldsymbol{v}+ \boldsymbol{\nabla}\boldsymbol{v}^{\textrm{T}}\right) -\tfrac{1}{3}\left( \boldsymbol{\nabla} \boldsymbol{\cdot} \boldsymbol{v}\right) \boldsymbol{I}{,} \end{equation}
where  $\boldsymbol {I}$ is the identity matrix.
It is because the constitutive relations (2.5a,b) for the fluxes  $\boldsymbol {\varPi }$ and
 $\boldsymbol {q}$ are coupled (in contrast to NSF) that they are given the initialism CCRs. The benefit of the CCR model compared with extended moment equations (Grad-13 equations, for instance) is that it retains full thermodynamic structure without any restriction (Rana et al. Reference Rana, Gupta and Struchtrup2018a).
In the above equations the phenomenological coefficient  $\alpha _{0}$ appears, which is chosen such that the CCR model agrees with the Burnett coefficients (in the sense of the Chapman–Enskog expansion of the Boltzmann equation). The NSF equations are obtained when
 $\alpha _{0}=0$. The value of
 $\alpha _{0}$ for the MM gases is 2/5, for other power potentials it can be computed from the relation
 $\alpha _{0}= {Pr \varpi _{3}}/{5}$, where
 $\varpi _{3}$ is the Burnett coefficient (Struchtrup Reference Struchtrup2005; Rana et al. Reference Rana, Gupta and Struchtrup2018a).
It is important to note here that, in steady state, the linearised CCR model reduces to the linearised Grad-13 moment equations for  $\alpha _{0}=2/5$ (i.e. for MM gases). Hence, using the naming convention of Lockerby & Collyer (Reference Lockerby and Collyer2016), Claydon et al. (Reference Claydon, Shrestha, Rana, Sprittles and Lockerby2017), the solution of the CCR equations (2.4a–c) and (2.5a,b) will still be referred to as the generalised Gradlet.
3. Green's functions: the Gradlet, thermal Gradlet and sourcelet
In this section, we write the fundamental solutions (Green's functions) for the CCR system (2.4a–c) and (2.5a,b) that will be used further in constructing the new solutions for complex geometries and phase-change problems.
3.1. The Gradlet and thermal Gradlet
The fundamental solutions sought here correspond to the steady-state response of the vapour with regard to a point body force  $\boldsymbol {f}$ and a heat source of strength
 $g$, acting at the singularity point at the origin (
 $\boldsymbol {r}^{s}=0$), i.e. the Green's functions associated with the following equations:
 \begin{equation} \boldsymbol{\nabla} \boldsymbol{\cdot} \boldsymbol{v} =0 ,\quad \boldsymbol{\nabla} p+\boldsymbol{\nabla} \boldsymbol{\cdot} \boldsymbol{\varPi } = {Kn}\,\boldsymbol{f}\delta \left(\boldsymbol{r}\right) \quad \text{and}\quad \boldsymbol{\nabla} \boldsymbol{\cdot} \boldsymbol{q} ={Kn} g\delta \left( \boldsymbol{r}\right){,} \end{equation}
where  $\delta (\boldsymbol {r})$ is the three-dimensional Dirac delta function. The solutions to (3.1a–c) along with (2.5a,b) are obtained via a Fourier transformation. The velocity
 $\boldsymbol {v}^{(Gr)}$, pressure
 $p^{(Gr)}$ and stress tensor
 $\boldsymbol {\varPi }^{(Gr)}$, at any point
 $\boldsymbol {r}$, are found as
 \begin{gather} \boldsymbol{v}^{(Gr)}{\left (\boldsymbol{r}\right)} = \frac{1}{8{\rm \pi} }\boldsymbol{J}{\left (\boldsymbol{r}\right)} \boldsymbol{\cdot} \boldsymbol{f}+\frac{3\alpha _{0}^{2}c_{p}Kn^{2}}{4{\rm \pi} Pr}\boldsymbol{K}{\left (\boldsymbol{r}\right)} \boldsymbol{\cdot} \boldsymbol{f}{,} \end{gather}
 \begin{gather}p^{(Gr)}{\left (\boldsymbol{r}\right)} =\frac{{Kn}}{4{\rm \pi} }\,\frac{\boldsymbol{f}\boldsymbol{\cdot}\boldsymbol{r}} {|\boldsymbol{r}|^{3}}{, } \end{gather}
 \begin{gather}\boldsymbol{\varPi }^{(Gr)}{\left (\boldsymbol{r}\right)} = \frac{3{Kn}}{4{\rm \pi} }\left( \boldsymbol{f}\boldsymbol{\cdot}\boldsymbol{r} +2\alpha _{0}{Kn}g\right) \boldsymbol{K}{\left (\boldsymbol{r}\right)}{.} \end{gather}
Here, we have introduced the abbreviations
 \begin{equation} \boldsymbol{J}{\left (\boldsymbol{r}\right)}=\frac{\boldsymbol{r}\boldsymbol{r}}{|\boldsymbol{r}|^{3}}+\frac{\boldsymbol{I}}{| \boldsymbol{r}|}\quad \text{and}\quad \boldsymbol{K}{\left (\boldsymbol{r}\right)}=\frac{\boldsymbol{r}\boldsymbol{r}}{|\boldsymbol{r}|^{5}}-\frac{1}{3}\frac{\boldsymbol{I}}{|\boldsymbol{r}|^{3}} \end{equation}
to denote the Oseen–Burger tensor and the third decaying harmonic tensor (Lamb Reference Lamb1945), respectively. The temperature  $T^{(Gr)}$ and heat flux
 $\boldsymbol {q}^{(Gr)}$ are obtained as
 \begin{gather} T^{(Gr)}{\left (\boldsymbol{r}\right)} =\frac{Pr }{4{\rm \pi} c_{p}}\frac{g}{|\boldsymbol{r}|}\text{,} \end{gather}
 \begin{gather}\boldsymbol{q}^{(Gr)}{\left (\boldsymbol{r}\right)} =\frac{{Kn}}{4{\rm \pi} }\frac{g}{|\boldsymbol{r}|^{3}}\boldsymbol{r}- \frac{3\alpha _{0}c_{p}{Kn}^{2}}{4{\rm \pi} Pr } \boldsymbol{K}{\left (\boldsymbol{r}\right)} \boldsymbol{\cdot} \boldsymbol{f}{. } \end{gather}
Here, it is assumed that all the field variables are measured relative to their equilibrium values at infinity, hence all field variables vanish as  $|\boldsymbol {r}|\rightarrow \infty$.
One can easily verify that, for  $\alpha _{0}=0$, the fundamental solutions (3.2) and (3.4) reduce to the solution of Stokes (Stokeslet) and the heat equation (thermal Stokeslet), which is available in the works of Oseen and Burger (Lamb Reference Lamb1945) and the recent work of Lockerby & Collyer (Reference Lockerby and Collyer2016). Moreover, for
 $\alpha _{0}=2/5$, (3.2)–(3.4) reduce to the Grad-13 moment equations, the Gradlet and the thermal Gradlet, obtained by Lockerby & Collyer (Reference Lockerby and Collyer2016). Thus, one can also think of (3.2)–(3.4) as the solution of 13-moment equations (steady-state and linearised) with general power potentials in the collision operator for the Boltzmann equation.
3.2. The sourcelet
The linearity of (2.4a–c) and (2.5a,b) allows one to obtain a class of singularity solutions that are readily applicable to various type of boundary-value problems. Note that the fundamental solutions (Gradlet and thermal Gradlet) obtained in the previous section create no mass flux. Owing to Gauss’ theorem, one may draw any boundary enclosing the Stokeslet/Gradlet, and find that there can be no mass flux across it ( $\boldsymbol {\nabla } \boldsymbol {\cdot } \boldsymbol {v} =0$ everywhere). Therefore, it follows that, to capture phase-change events (and here we are particularly interested in the liquid–vapour interface) an additional fundamental solution is required, one that produces a source of mass. Hence, we consider the solution of the following equations:
 \begin{equation} \boldsymbol{\nabla} \boldsymbol{\cdot} \boldsymbol{v}=h\delta (\boldsymbol{r}){, }\quad \boldsymbol{\nabla} p+ \boldsymbol{\nabla} \boldsymbol{\cdot} \boldsymbol{\varPi }=0,\quad \text{and}\quad \boldsymbol{\nabla} \boldsymbol{\cdot} \boldsymbol{q}=0{,} \end{equation}
where  $h$ is the strength of the mass source. Again, the fundamental solutions of (3.5a–c) and (2.5a,b) are derived via Fourier transform (see Appendix A for detailed derivation), yielding
 \begin{gather} \boldsymbol{v}^{(S)}{\left (\boldsymbol{r}\right)} =\frac{h}{4{\rm \pi} }\frac{\boldsymbol{r}}{|r|^{3}}{,} \end{gather}
 \begin{gather}\boldsymbol{\varPi }^{(S)}{\left (\boldsymbol{r}\right)} = \frac{3{Kn} h}{2{\rm \pi} }\boldsymbol{K}{\left (\boldsymbol{r}\right)}{,} \end{gather}
 \begin{gather}p^{(S)}{\left (\boldsymbol{r}\right)} =T^{(S)}{\left (\boldsymbol{r}\right)}=0\quad \text{and} \quad \boldsymbol{q}^{(S)}{\left (\boldsymbol{r}\right)}=0{.} \end{gather}
As such, the pressure, temperature and heat flux vanish for this case.
3.3. Equations collected
Combining the Gradlet, thermal Gradlet (3.2)–(3.4) and sourcelet (3.6), the flow fields induced by the generalised Gradlet (a point mass source, point force and point heat source) are
 \begin{gather} \boldsymbol{v}{\left (\boldsymbol{r}\right)} =\frac{1}{8{\rm \pi} }\boldsymbol{J}{\left (\boldsymbol{r}\right)}\boldsymbol{\cdot} \boldsymbol{f}+\frac{3\alpha _{0}^{2}c_{p}{ Kn}^{2}}{4{\rm \pi} Pr}\boldsymbol{K}{\left (\boldsymbol{r}\right)}\boldsymbol{\cdot} \boldsymbol{f}+\frac{h}{4{\rm \pi} }\frac{\boldsymbol{r}}{|r|^{3}}{,} \end{gather}
 \begin{gather}p{\left (\boldsymbol{r}\right)} =\frac{{Kn}}{4{\rm \pi} }\frac{\boldsymbol{f}\boldsymbol{\cdot}\boldsymbol{r}}{|r|^{3}}{,} \end{gather}
 \begin{gather}\boldsymbol{\varPi }{\left (\boldsymbol{r}\right)} =\frac{3{Kn}}{4{\rm \pi} }\left( \boldsymbol{f}\boldsymbol{\cdot}\boldsymbol{r}+2\alpha _{0}{Kn}g+2h\right)\boldsymbol{K}{\left (\boldsymbol{r}\right)} \end{gather}
and
 \begin{gather} T{\left (\boldsymbol{r}\right)} =\frac{Pr }{4{\rm \pi} c_{p}}\frac{g}{|r|}{,} \end{gather}
 \begin{gather}\boldsymbol{q}{\left (\boldsymbol{r}\right)} =\frac{{Kn}}{4{\rm \pi} }\frac{g}{|r|^{3}}\boldsymbol{r}-\frac{ 3\alpha _{0}c_{p}{Kn}^{2}}{4{\rm \pi} Pr }\boldsymbol{K}{\left (\boldsymbol{r}\right)}\boldsymbol{\cdot} \boldsymbol{f}{.} \end{gather}
These solutions need to be supplemented with appropriate boundary conditions, which are formulated in the next section.
4. Liquid–vapour interface boundary conditions
In this section, we derive the phase-interface boundary conditions for the CCR system within the framework of irreversible thermodynamics (Kjelstrup & Bedeaux Reference Kjelstrup and Bedeaux2008). In order to establish (thermodynamically consistent) boundary conditions at the phase interface, one determines the entropy generation at the interface, and finds the boundary conditions as phenomenological laws that guarantee positivity of the entropy generation rate. For the linearised CCR equations, the entropy generation rate at the interface is (Beckmann et al. Reference Beckmann, Rana, Torrilhon and Struchtrup2018; Rana et al. Reference Rana, Gupta and Struchtrup2018a)
 \begin{align} \varSigma _{{surface}}&={-}\left(\boldsymbol{v}-\boldsymbol{v}^{I}\right)\boldsymbol{\cdot} \boldsymbol{n}\left[ p-p_{sat}+\left( \boldsymbol{n}\boldsymbol{\cdot} \boldsymbol{\varPi}\boldsymbol{\cdot} \boldsymbol{n}\right) \right] -\boldsymbol{q}\boldsymbol{\cdot} \boldsymbol{n}\left[T-T^{l}+\alpha _{0}\left( \boldsymbol{n}\boldsymbol{\cdot} \boldsymbol{\varPi}\boldsymbol{\cdot} \boldsymbol{n}\right) \right]\nonumber\\ &\quad -\sum_{i=1}^{2}\left( \boldsymbol{t}^{(i)}\boldsymbol{\cdot} \boldsymbol{\varPi }\boldsymbol{\cdot} \boldsymbol{n} \right) \left[ \boldsymbol{t}^{(i)}\boldsymbol{\cdot} \left( \boldsymbol{v-v}^{l}\right) +\alpha _{0}\boldsymbol{t}^{(i)}\boldsymbol{\cdot} \boldsymbol{q}\right] \geqslant 0{,} \end{align}
where  $\boldsymbol {n}$ is a unit normal pointing from a boundary point into the gas and
 $\{ \boldsymbol {t}^{(i)}\} _{i=1,2}$ are orthonormal tangent vectors to the boundary. Here,
 $\boldsymbol {v}^{I}$ denotes the velocity of the interface,
 $T^{I}$ denotes the temperature of the liquid at the interface and
 $p_{sat}{( T^{I}) }$ is the saturation pressure.
The positivity of entropy generation rate  $\varSigma _{surface}$ is ensured by adopting the following boundary equations
 \begin{gather} \left(\boldsymbol{v}-\boldsymbol{v}^I\right)\boldsymbol{\cdot} \boldsymbol{n} ={-}\eta _{11}\left(p-p_{sat}+\boldsymbol{n}\boldsymbol{\cdot} \boldsymbol{\varPi } \boldsymbol{\cdot} \boldsymbol{n} \right)+\eta _{12}\left(T-T^{I}+\alpha _{0} \boldsymbol{n}\boldsymbol{\cdot} \boldsymbol{\varPi }\boldsymbol{\cdot} \boldsymbol{n}\right), \end{gather}
 \begin{gather}\boldsymbol{q}\boldsymbol{\cdot} \boldsymbol{n} =\eta _{12}\left(p-p_{sat}+\boldsymbol{n}\boldsymbol{\cdot} \boldsymbol{\varPi }\boldsymbol{\cdot} \boldsymbol{n} \right)-(\eta _{22}+2\tau_0)\left(T-T^{I}+\alpha _{0}\boldsymbol{n}\boldsymbol{\cdot} \boldsymbol{\varPi }\boldsymbol{\cdot} \boldsymbol{n}\right) \end{gather}
and
 \begin{gather} \boldsymbol{t}^{(1)}\boldsymbol{\cdot} \boldsymbol{\varPi }\boldsymbol{\cdot} \boldsymbol{n} ={-}\varsigma\left(\boldsymbol{v-v}^{I} +\alpha _{0} \boldsymbol{q}\right)\boldsymbol{\cdot}\boldsymbol{t}^{(1)} {,} \end{gather}
 \begin{gather}\boldsymbol{t}^{(2)}\boldsymbol{\cdot} \boldsymbol{\varPi }\boldsymbol{\cdot} \boldsymbol{n} ={-}\varsigma \left(\boldsymbol{v-v}^{I} +\alpha _{0}\boldsymbol{q}\right)\boldsymbol{\cdot}\boldsymbol{t}^{(2)}{.} \end{gather}
Through boundary conditions (4.2), the evaporative mass and heat flux are governed by the difference between pressure and saturation pressure and temperature difference across the interface. Furthermore, the boundary conditions (4.3a) and (4.3b) relate the shear stress to the tangential velocity slip and thermal transpiration, a flow induced by a tangential heat flux, which is a second-order effect (Hadjiconstantinou Reference Hadjiconstantinou2003; Sone Reference Sone2007; Cercignani & Lorenzani Reference Cercignani and Lorenzani2010). The boundary conditions (4.2) and (4.3) are an extension to the classical Hertz–Knudsen–Schrage law for evaporation (Schrage Reference Schrage1953), taking into account the temperature jump, velocity slip and some second-order effects.
In boundary conditions (4.2),  $\eta _{ij}$'s are Onsager resistivity coefficients, which are obtained from the asymptotic (
 ${Kn}\rightarrow 0$) kinetic theory (Sone Reference Sone2007), as (see Appendix B for details)
 \begin{equation} \eta_{11}=0.9134\sqrt{\frac{2}{\rm \pi}}\frac{\vartheta}{2-\vartheta}{, }\quad \eta_{12}=0.3915\sqrt{\frac{2}{\rm \pi}}\frac{\vartheta}{2-\vartheta},\quad \text{and}\quad \eta_{22}=0.1678\sqrt{\frac{2}{\rm \pi}}\frac{\vartheta}{2-\vartheta}{.} \end{equation}
These coefficients were obtained assuming that the evaporation/condensation coefficient  $\vartheta$ is independent of the impact energy of molecules and that all vapour molecules that are not condensing are thermalised, i.e. the accommodation coefficient,
 $\chi =1$. The temperature-jump coefficient
 $\tau _0 = 0.8503\sqrt {2/{\rm \pi} }$ and velocity-slip coefficient
 $\varsigma = 0.8798\sqrt {2/{\rm \pi} }$. Throughout this paper, we shall take
 $\vartheta =0$ for the canonical boundaries and
 $\vartheta =1$ (a value largely accepted in literature) for the phase-change boundaries.
Although in the development of our MFS approach, we use (4.2) and (4.3) as the boundary conditions, this methodology is in principle capable of accommodating other type of phase-interface boundary conditions, such as statistical-rate theory (Ward & Fang Reference Ward and Fang1999) and phenomenological approach based on Hertz–Knudsen–Schrage relation (Liang et al. Reference Liang, Biben and Keblinski2017). We do not address these boundary conditions in this paper, but should be worthy of future investigation.
In the following sections, we introduce, and use, the MFS for CCR, i.e. CCR–MFS, which is computationally economic, and shows that it provides reliable solutions of the CCR and NSF equations in good agreement to the known closed-form analytical results.
5. MFS for the CCR equations (CCR–MFS)
Let us consider  $N_{c}$ collocation points on the boundary at
 $\{ \boldsymbol {r}^{c(\,j)}\} _{j=1}^{N_{c}}$, whereas
 $N_{s}$ singularity points are located outside the computational domain (i.e. inside the solid/liquid body) with position vectors
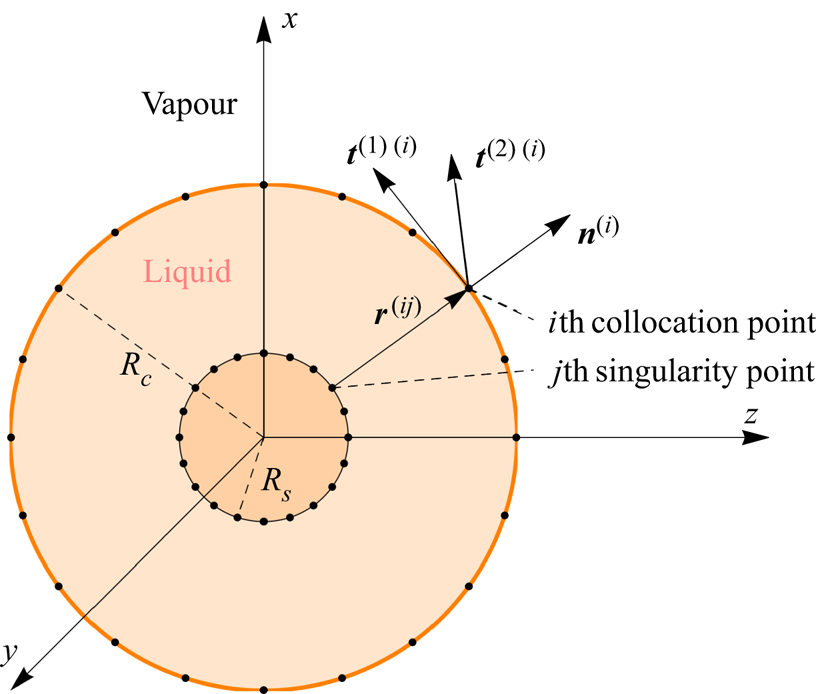
 $\{ \boldsymbol {r}^{s(\,j)}\} _{j=1}^{N_{s}}$, see figure 1. The flow-field variables are given by a superposition of the Gradlets, thermal Gradlets and sourcelets, formulated in (3.7) and (3.8), as
 \begin{gather} \boldsymbol{v}^{(i)(Gr)} =\sum_{j=1}^{N^{s}}\frac{1}{8{\rm \pi} }\boldsymbol{J}{\left (\boldsymbol{r}^{(ij)}\right)} \boldsymbol{\cdot} \boldsymbol{f}^{(\,j)}+\frac{3\alpha _{0}^{2}c_{p}{Kn}^{2}}{ 4{\rm \pi} Pr} \boldsymbol{K}{\left (\boldsymbol{r}^{(ij)}\right)}\boldsymbol{\cdot} \boldsymbol{f}^{(\,j)}, \end{gather}
 \begin{gather}\boldsymbol{v}^{(i)(S)} =\sum_{j=1}^{N^{s}}\frac{h^{(\,j)}}{4{\rm \pi} }\frac{ \boldsymbol{r}^{\left( ij\right) }}{|\boldsymbol{r}^{\left( ij\right) }|^{3}}{,} \end{gather}
 \begin{gather}\boldsymbol{v}^{(i)} = \boldsymbol{v}^{(i)(Gr)}+\boldsymbol{v}^{(i)(S)}{,} \end{gather}
 \begin{gather}p^{(i)} =\sum_{j=1}^{N^{s}}\frac{{Kn}}{4{\rm \pi} }\frac{\boldsymbol{f}^{(\,j)} \boldsymbol{\cdot} \boldsymbol{r}^{\left( ij\right) }}{|\boldsymbol{r}^{\left( ij\right) }|^{3}}{,} \end{gather}
 \begin{gather}\boldsymbol{\varPi}^{(i)} =\sum_{j=1}^{N^{s}}\frac{3{Kn}}{4{\rm \pi} }\left( \boldsymbol{f }^{(\,j)}\boldsymbol{\cdot} \boldsymbol{r}^{\left( ij\right) }+2\alpha _{0}{Kn} g^{(\,j)}+2h^{(\,j)}\right)\boldsymbol{K}{\left (\boldsymbol{r}^{(ij)}\right)}{,} \end{gather}
and
 \begin{gather} T^{(i)} =\sum_{j=1}^{N^{s}}\frac{Pr }{4{\rm \pi} c_{p}}\frac{g^{(\,j)}}{|\boldsymbol{r} ^{\left( ij\right) }|}{,} \end{gather}
 \begin{gather}\boldsymbol{q}^{(i)} =\sum_{j=1}^{N^{s}}\frac{{Kn}}{4{\rm \pi} }\frac{g^{(\,j)} \boldsymbol{r}^{\left( ij\right) }}{| \boldsymbol{r}^{\left( ij\right) }|^{3}}-\frac{ 3\alpha _{0}c_{p}{Kn}^{2}}{4{\rm \pi} Pr } \boldsymbol{K}{\left (\boldsymbol{r}^{(ij)}\right)}\boldsymbol{\cdot} \boldsymbol{f}^{(\,j)} \end{gather}
are fundamental solutions for the CCR equations. Here,  $\boldsymbol {r}^{( ij) }=\boldsymbol {r}^{c( i) }-\boldsymbol {r}^{s( j) }$ are the displacement vectors from the
 $j$th singularity site to the
 $i$th collocation point.
Schematic representation of the collocation and singularity points layout:  $\boldsymbol {n}^{(i)}$,
 $\boldsymbol {t}^{(1)(i)}$ and
 $\boldsymbol {t}^{(2)(i)}$ represent the unit normal and both the tangential vectors, respectively, at the
 $i$th collocation point.

There are a total of  $5\times N^{s}$ unknowns in (5.1) and (5.2), five at each singularity site, which need to be specified via suitable boundary conditions. The four boundary conditions in (4.2) and (4.3) need to be satisfied at every collocation point. Hence, one additional boundary condition is required (at each collocation point). We use the following boundary conditions:
 \begin{align} \boldsymbol{v}^{(i)(S)}\boldsymbol{\cdot} \boldsymbol{n}^{(i)} &={-}\eta _{11}\left(p^{(i)}-p_{sat}^{(i)}+\boldsymbol{n}^{(i)}\boldsymbol{\cdot} \boldsymbol{\varPi }^{(i)}\boldsymbol{\cdot} \boldsymbol{n} ^{(i)}\right)\nonumber\\ &\quad+\eta _{12}\left(T^{(i)}-T^{(i)I}+\alpha _{0}\boldsymbol{n^{(i)}} \boldsymbol{\cdot} \boldsymbol{\varPi}^{(i)}\boldsymbol{\cdot} \boldsymbol{n}^{(i)}\right){,} \end{align}
 \begin{equation} \left(\boldsymbol{v}^{(i)(Gr)}-\boldsymbol{v}^{\left( i\right)I}\right) \boldsymbol{\cdot} \boldsymbol{n}^{\left( i\right) } = 0 {.} \end{equation}
Notably, we have split the boundary condition (4.2a) into two components, (5.3a) and (5.3b). Clearly, these two boundary conditions are sufficient for condition (4.2a) to hold. The boundary conditions for the normal heat flux (4.2b) and shear stress (4.3) read
 \begin{align} \boldsymbol{q}^{(i)}\boldsymbol{\cdot} \boldsymbol{n}^{(i)} &= \eta _{12}\left(p^{(i)}-p_{sat}^{(i)}+\boldsymbol{n}^{(i)}\boldsymbol{\cdot} \boldsymbol{\varPi }^{(i)} \boldsymbol{\cdot} \boldsymbol{n} ^{(i)}\right)\nonumber\\ &\quad-\left(\eta _{22}+2\tau_0\right)\left(T^{(i)}-T^{(i)I}+\alpha _{0}\boldsymbol{n^{(i)}} \boldsymbol{\cdot} \boldsymbol{\varPi}^{(i)}\boldsymbol{\cdot} \boldsymbol{n}^{(i)}\right){,} \end{align}
 $$\begin{gather} \boldsymbol{t}^{(1)\left( i\right) }\boldsymbol{\cdot} \boldsymbol{\varPi }^{\left( i\right) }\boldsymbol{\cdot} \boldsymbol{n}^{\left( i\right) } ={-}\varsigma\left(\boldsymbol{v}^{\left( i\right) } \boldsymbol{-v}^{\left( i\right) I}+\alpha _{0}\boldsymbol{ q}^{\left( i\right) }\right) \boldsymbol{\cdot} \boldsymbol{t}^{(1)\left( i\right) }{,} \end{gather}$$
 $$\begin{gather}\boldsymbol{t}^{(2)\left( i\right) }\boldsymbol{\cdot} \boldsymbol{\varPi }^{\left( i\right) }\boldsymbol{\cdot} \boldsymbol{n}^{\left( i\right) } ={-}\varsigma\left(\boldsymbol{v}^{\left( i\right) } \boldsymbol{-v}^{\left( i\right) I}+\alpha _{0} \boldsymbol{ q}^{\left( i\right) }\right) \boldsymbol{\cdot} \boldsymbol{t}^{(2)\left( i\right) }{.} \end{gather}$$
For convenience, we write the set of equations (5.3) and (5.4) in matrix form
 \begin{equation} \sum_{j=1}^{N^{s}}\boldsymbol{\mathscr{L} }^{ij}\boldsymbol{u}^{\left(\,j\right) }= \boldsymbol{b}^{\left( i\right) }{,} \end{equation}
where  $\boldsymbol {u}^{( j) }$ is the vector containing the five degrees of freedom at each singularity point, i.e.
 \begin{equation} \boldsymbol{u}^{\left(\,j\right) }=\left\{ g^{\left(\,j\right) }{, } f_{1}^{\left(\,j\right) }{, }f_{2}^{\left(\,j\right) }{, } f_{3}^{\left(\,j\right) }{, }h^{\left(\,j\right) }\right\}{,} \end{equation}
where  $\mathscr {L} ^{ij}$ is a
 $5\times 5$ coefficient matrix, and
 $\boldsymbol {b}^{( i) }$ is a
 $5\times 1$ vector, which can be readily extracted using symbolic software, we used Mathematica® for this. The inhomogeneous part
 $\{ \boldsymbol {b}^{( i) }\} _{i=1}^{N^{c}}$ contains the properties of the interface, namely,
 $T^{(i)I}$,
 $p^{(i)}_{sat}$ and
 $\boldsymbol {v}^{( i)I}$. The
 $5N^{c}\times 5N^{s}$ linear system (5.5) is solved for
 $\{ \boldsymbol {u}^{( i) }\} _{i=1}^{N^{s}}$ using an iterative quasi-minimal residual method (Freund & Nachtigal Reference Freund and Nachtigal1991). Moreover, the normal and the tangent vectors
 $\{ \boldsymbol {n}^{(\,j)}{, }\boldsymbol {t}^{(1)( j) } {, }\boldsymbol {t}^{(1)( j) }\} _{j=1}^{N^{c}}$ are obtained using Householder reflection formula for vector orthogonalisation (Lopes, Silva & Ambrósio Reference Lopes, Silva and Ambrósio2013).
6. Results and discussion
The CCR–MFS method described in the previous section requires some numerical parameters to be specified, namely, the number of collocation ( $N^c$) and singularity (
 $N^s$) points to take and the location of singularity points outside the computational domain. These parameters govern the overall efficiency of the numerical scheme, by striking a balance between numerical error and computational time. Throughout this study, we consider an equal number of collocation and singularity points, i.e.
 $N^c=N^s$ and take
 $\gamma \in (0,1)$ as a geometry-dependent parameter, which governs how far the singularity points are from the boundary. For instance, for the spherical geometry shown in figure 1, we choose
 $\gamma =R_s/R_c$.
In order to validate our code and to establish the numerical accuracy of the CCR–MFS scheme, we validate our results for a case of an evaporating spherical droplet, the analytic solutions to this problems are readily available in Rana et al. (Reference Rana, Lockerby and Sprittles2018b) for the case of Grad-13 equations. In addition, in order to establish the accuracy of our models, we consider a slow flow around a sphere (evaporative and non-evaporative) for various values of Knudsen number and compare our solutions with results from kinetic theory.
6.1. Validation and verification of CCR–MFS
6.1.1. Validation case: evaporation from a spherical droplet
First, we consider a liquid droplet of fixed radius with a given interface temperature  $T^{I}$ and the corresponding saturation pressure
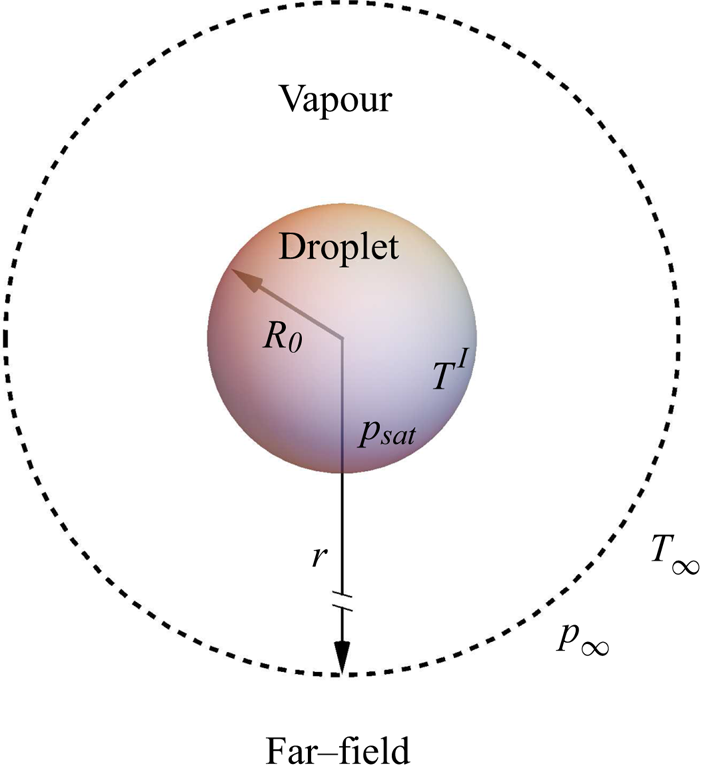
 $p_{sat}$, immersed in its own vapour, see figure 2. The far-field conditions are given by
 $T_{\infty }=0$,
 $p_{\infty }=0$, that is, we consider the far-field conditions and the droplet radius (
 $R_0$) for non-dimensionalisation. Throughout this paper we do not consider dynamics within the droplets, surface tension, etc., see Rana et al. (Reference Rana, Lockerby and Sprittles2019).
Schematic representation of a liquid droplet surrounded by its own vapour. The equations are made dimensionless with respect to the far-field conditions ( $T_{\infty }$,
 $p_{\infty }$). The temperature and the pressure deviations vanish as
 $r\rightarrow \infty$.

Assuming the spherical symmetry of this problem, the analytic solutions for the radial velocity  $v_{r}$, heat flux
 $q_{r}$, normal stress
 $\varPi _{rr}$ and the temperature
 $T$ are obtained from (2.4a–c) and (2.5a,b) as (Rana et al. Reference Rana, Lockerby and Sprittles2018b)
 \begin{equation} v_{r}=\frac{c_{1}}{r^{2}}{,\quad }q_{r}=\frac{c_{2}}{r^{2}},\quad \varPi _{rr}=\frac{4{Kn}\left( c_{1}+\alpha _{0}c_{2}\right) }{r^{3}}{,}\quad T=\frac{Pr }{c_{p}{Kn}}\frac{c_{2}}{r},\quad \text{and}\quad p=0{.} \end{equation}
Here,  $r$ is the radial direction and
 $c_{1}$ and
 $c_{2}$ are constants of integration. Solutions (6.1a–e) can also be derived from the fundamental solutions (3.7a)–(3.7c), which are given in Appendix C.
The flow is driven by (i) a unit pressure difference while the temperature of the liquid is equal to the far-field temperature (i.e.  $p_{sat}=1$ and
 $T^{I}=T_{\infty }=0$) or (ii) a unit temperature difference while the saturation pressure in the liquid is the same as the far-field pressure (i.e.
 $p_{sat}=p_{\infty }=0$ and
 $T^{I}=1$). In both cases, the constants of integration, namely, the mass flux (
 $c_{1}$) and heat flux (
 $c_{2}$), per unit area, are obtained from boundary conditions (4.2) at
 $r=1$. For Grad-13 (i.e.
 $\alpha _0=2/5$) these are obtained as
 \begin{gather} c_{1}^{p}=0.220562+\frac{0.0613424+0.0960246{Kn}}{0.138548+{Kn}(0.716085+{Kn})}{,} \end{gather}
 \begin{gather}c_{2}^{p}=c_{1}^{\tau}={-}\frac{{Kn}(0.108868+0.551404{Kn})}{ 0.138548+{Kn}(0.716085+{Kn})}{,} \end{gather}
 \begin{gather}c_{2}^{\tau}=\frac{0.152568{Kn}+{Kn}^{2}(0.924355+1.37851 {Kn}))}{0.0406847+{Kn}(0.348827+{Kn}(1.00974+{Kn}))}{.} \end{gather}
Here, superscripts ‘ $p$’ and ‘
 $\tau$’ denote the pressure-driven case (
 $p_{sat}=1$ and
 $T^{l}=T_{\infty }=0$) and temperature-driven case (
 $p_{sat}=p_{\infty }=0$ and
 $T^{I}=1$), respectively. The results of these two problems can be combined to evaluate the total evaporative mass and heat flux from the droplet (Rana et al. Reference Rana, Lockerby and Sprittles2019). Owing to the microscopic reversibility of the evaporation and condensation processes the Onsager reciprocity relations hold, which give
 $( c_{2}^{p}=c_{1}^{\tau })$ (Chernyak & Margilevskiy Reference Chernyak and Margilevskiy1989; Rana et al. Reference Rana, Lockerby and Sprittles2018b).
The mass and the heat flux predicted by the CCR–MFS method are obtained by integrating  $\boldsymbol {v}^{(Gr)}$ (5.1a), (5.1b) and
 $\boldsymbol {q}^{(Gr)}$ (5.2b) over the droplet surface, i.e.
 \begin{gather} c_{1}^{(MFS)} =\frac{1}{4{\rm \pi} }\int_{0}^{{\rm \pi} }\int_{0}^{2{\rm \pi} }\boldsymbol{v} ^{(Gr)}\boldsymbol{\cdot} \boldsymbol{n}\,\textrm{d}\varphi \,\textrm{d}\theta =\frac{1}{4{\rm \pi} } \sum_{i=1}^{N^{s}}h^{(i)}{,} \end{gather}
 \begin{gather}c_{2}^{(MFS)} =\frac{1}{4{\rm \pi} }\int_{0}^{{\rm \pi} }\int_{0}^{2{\rm \pi} }\boldsymbol{q} ^{(Gr)}\boldsymbol{\cdot} \boldsymbol{n}\,\textrm{d}\varphi \,\textrm{d}\theta =\frac{{Kn}}{4{\rm \pi} } \sum_{i=1}^{N^{s}}g^{(i)}{.} \end{gather}
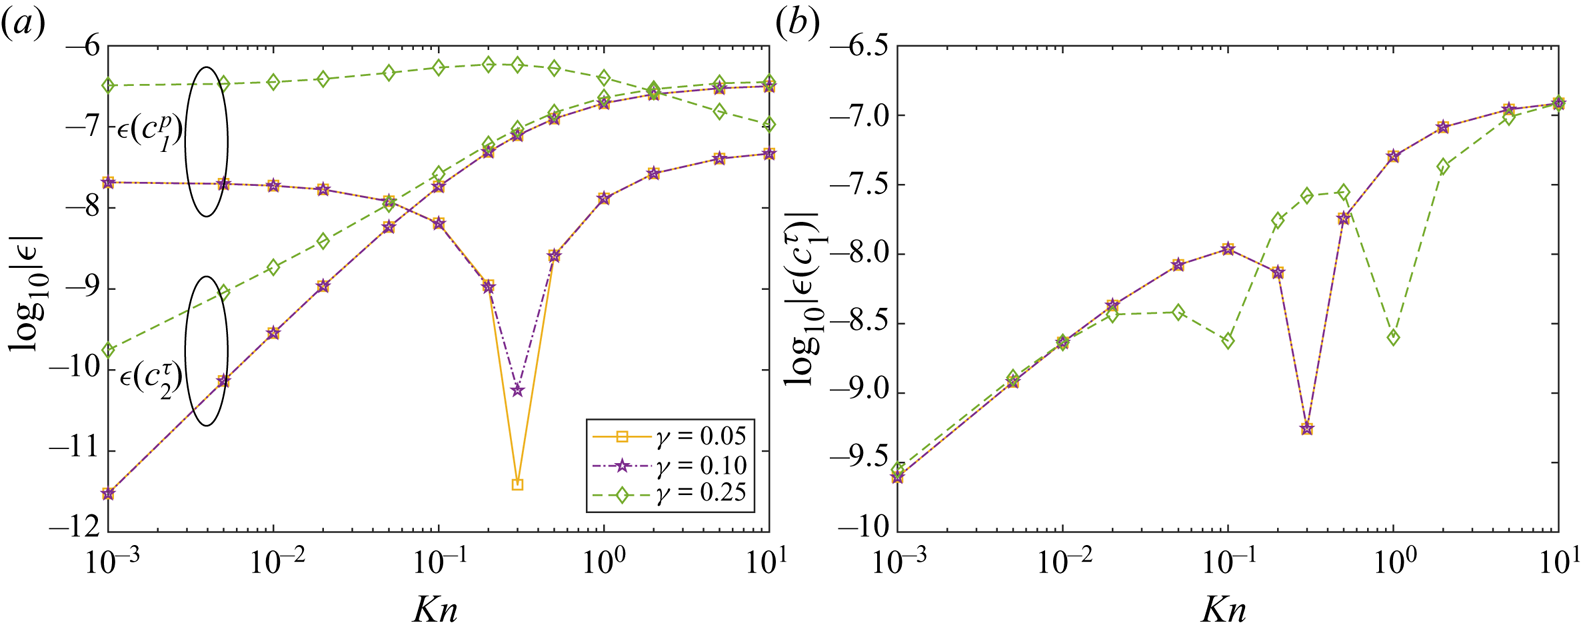
Let us first briefly consider the convergence characteristics of the CCR–MFS method. The configuration for the collocation and singularity points is shown in figure 1. We define errors  $\epsilon$ between the numerical prediction of
 $c_1^{p}$,
 $c_1^{T}$ and
 $c_2^{T}$ to the analytical values (6.2) as
 \begin{equation} \epsilon\left(c_1^{p}\right) = c_1^{p\left(MFS\right)}-c_1^{p},\quad \epsilon\left(c_2^{\tau}\right) = c_2^{\tau\left(MFS\right)}-c_2^{\tau} \quad \text{and} \quad \epsilon\left(c_1^{\tau}\right) = c_1^{\tau\left(MFS\right)}-c_1^{\tau}{.} \end{equation}
Figure 3 shows the numerical errors of the MFS (with  $\alpha _0=2/5$) in
 $c_1^{p}$,
 $c_2^{\tau }$ (a) and
 $c_1^{\tau }$ (b) for three different singularity site locations (
 $\gamma =R_s/R_c=0.05, 0.1, 0.25$) and various values of the Knudsen number. The result indicates very high accuracy with a moderate number of points (
 $N^c=112$). The best results are obtained when the singularity sites are farther away from the collocation nodes, i.e.
 $\gamma$ is small. However, it leads to poorer conditioning of the equation system (5.5), which in turn results in larger least-square errors and computational time.
Log–log plot of errors against Knudsen number with three different singularity locations  $\gamma =R_s/R_c=0.05$, 0.1, 0.25 and with
 $N^c=N^s=112$: (a) error in
 $c_1^{p}$ and
 $c_2^{\tau }$ and (b) error in
 $c_1^{\tau }$.

As Lockerby & Collyer (Reference Lockerby and Collyer2016), numerical tests were also conducted by increasing the number of collocation points, as well as, by shifting the singularities sites (i.e.breaking the symmetry of the collocation and singularity points), the results were found to be satisfactory. Henceforth, the numerical simulations are performed with  $\gamma =0.1$, unless otherwise stated.
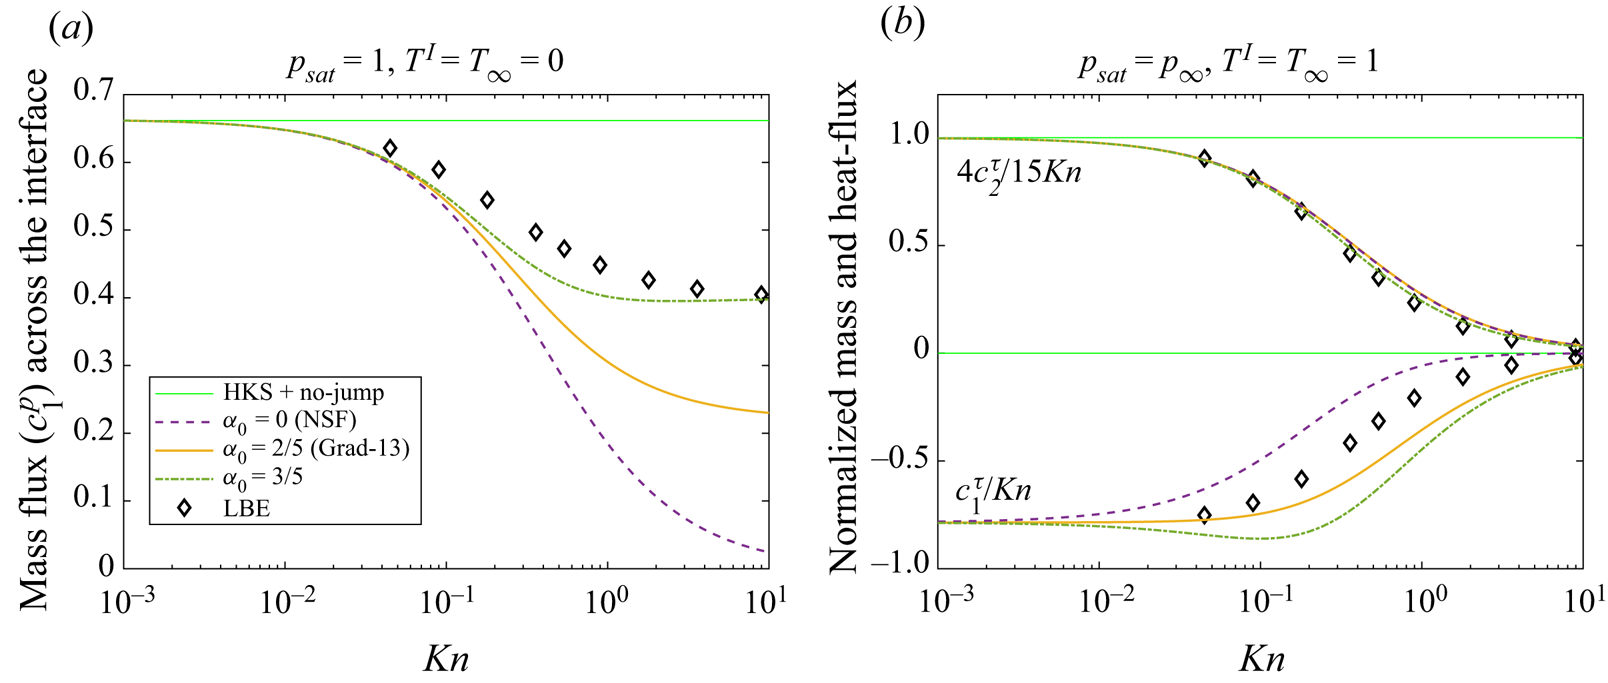
Figure 4 shows the variations in the mass- and heat-flux coefficients ( $c_1$ and
 $c_2$) for a range of Knudsen numbers, the numerical parameters are included in the caption. In order to put the CCR models into perspective, we compare our predictions with different theories, namely, NSF (
 $\alpha _0=0$), Grad-13 (
 $\alpha _0=2/5$) and (
 $\alpha _0=3/5$), against the results (symbols) from the linearised Boltzmann equations (LBEs) by Takata et al. (Reference Takata, Sone, Lhuillier and Wakabayashi1998). The solutions of the NSF equations with classical boundary conditions, i.e. assuming the (linearised) Hertz–Knudsen–Schrage law for evaporation (Schrage Reference Schrage1953) and the continuity of temperature across the interface, are also included (thin green lines) in figure 4 for the comparison. These boundary conditions can be obtained from (4.2a) by taking
 $\eta _{12}=0$ and
 $T=T^{I}$ instead of (4.2a), which are only valid for
 ${Kn}\rightarrow 0$ (Sone Reference Sone2007; Rana et al. Reference Rana, Lockerby and Sprittles2018b).
Mass- and heat-flux coefficients as a function of the Knudsen number: (a) mass flux ( $c_1^{p}$) in pressure-driven case and (b) normalised mass (
 $c_1^{\tau }/{Kn}$) and heat flux (
 $4c_2^{\tau }/15{Kn}$) coefficients in the temperature-driven case. The results obtained from MFS with different theories are compared. The symbols denoting the results from Takata et al. (Reference Takata, Sone, Lhuillier and Wakabayashi1998) and (green) thin line representing the analytic results from classical boundary conditions. The number of collocation nodes used in each case are
 $N^c=N^s=112$ and
 $\gamma =0.1$.

For the pressure-driven case (cf. figure 4a) mass flux goes from liquid to vapour (i.e.  $c_1^{p}\geqslant 0$) and heat flows from vapour to liquid (i.e.
 $c_2^{p} = c_1^{\tau }\leqslant 0$) because the enthalpy of phase change must be supplied to the droplet to keep its temperature constant. All models agree in the limit of
 ${Kn}\rightarrow 0$ for the mass flux, the NSF equations with temperature-jump boundary conditions give better results over classical theories as the Knudsen number grows. Interestingly, the NSF equations with jump boundary conditions predicts a zero mass flux in the free-molecular regime, these results contradict kinetic-theory predictions. On the other hand, the Grad-13 theory gives a non-zero mass flux, but still predicts almost half of the mass flux of the LBE result. By performing an asymptotic expansion and matching the mass flux as
 ${Kn}\rightarrow \infty$, we find
 $\alpha _0=3/5$ (a value extensively used in this study), with this model consequently providing the best agreement with the LBEs.
For the temperature-driven case (cf. figure 4b), Fourier's law with a no-jump boundary condition gives heat flux  $c_2^{\tau } = 15{Kn}/4$, while the cross effects, i.e. the heat flux owing to pressure difference or the mass flux owing to temperature difference, vanish. We have used this value to normalise the heat-flux computation in figure 4(b). All models, except the no-jump boundary conditions (thin green lines), match reasonably well with the LBE data, with
 $\alpha _0=3/5$ giving a slight improvement over other models. However, the cross effects (
 $c_1^{\tau }$) are not well captured by CCR theory, which requires resolution of the Knudsen layer, these are beyond the capabilities of the models considered in this paper, see Rana et al. (Reference Rana, Lockerby and Sprittles2018b) for a discussion on this.
6.1.2. Slow flow around a rigid sphere
Let us now consider the case of low-speed rarefied gas flow around a rigid ( $\vartheta =0$) spherical stationary particle of radius
 $R_{0}$. The particle is assumed to be isothermal, that is, the solid-to-gas conductivity ratio is large, with
 $T^{I}=0$, i.e. the far-field temperature and the temperature of the particle are same. The net force exerted on the sphere by gas is defined as
 \begin{equation} \boldsymbol{F}^{(Gr)}=\int_{0}^{{\rm \pi} }\int_{0}^{2{\rm \pi} }\left( p^{(Gr)}\boldsymbol{I}+ \boldsymbol{\varPi }^{(Gr)}\right) \boldsymbol{\cdot} \boldsymbol{n}\,\textrm{d}\varphi \,\textrm{d}\theta ={Kn} \sum_{i=1}^{N^{s}}\boldsymbol{f}^{(i)}{.} \end{equation}
The drag force is the projection of the net force (6.6) on to the streamwise direction. The Stokes formula for drag force (in the direction of flow) exerted by a spherical particle on the fluid flow has the form Lamb (Reference Lamb1945)
 \begin{equation} F^{S}={-}6{\rm \pi} {Kn}u_{\infty }{,} \end{equation}
where  $u_\infty$ is the far-field velocity.
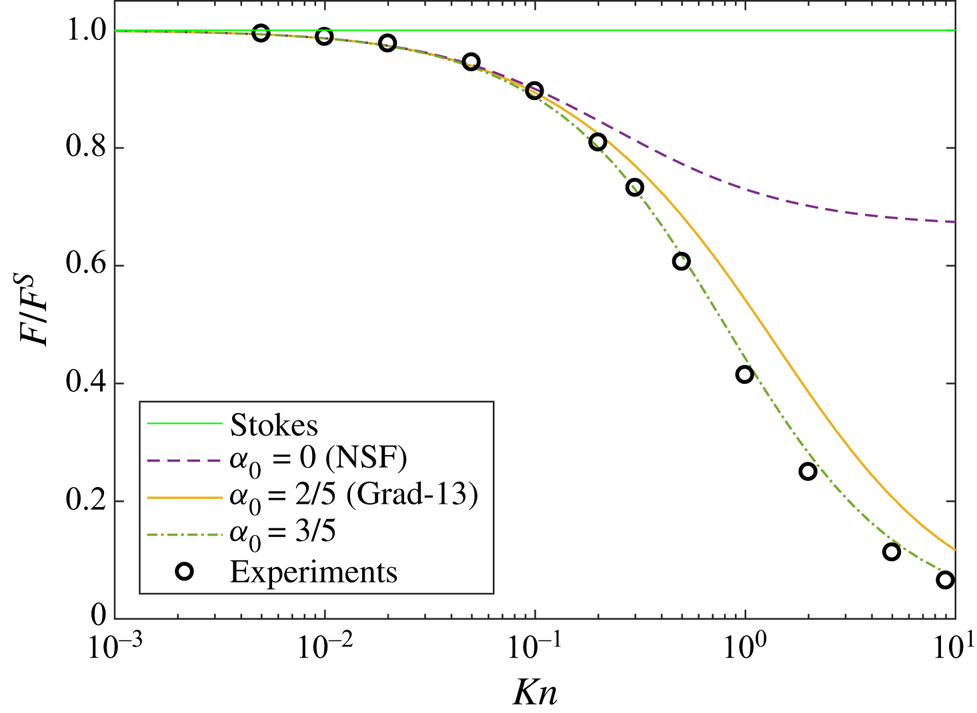
The Stokes formula is only valid for  ${Kn}\rightarrow 0$, and requires corrections at finite Knudsen number. Figure 5 shows the normalised (with Stokes’ drag (6.7)) drag coefficient versus the Knudsen number. As expected, all theories agree in the small Knudsen limit. As the value of Knudsen number increases, the normalised drag decreases owing to increasing slip (which is not embedded in the Stokes formula). Notably, the normalised drag force reaches a finite value from the NSF equations with velocity-slip boundary conditions as
 $Kn\rightarrow \infty$, whereas the extended theories (CCR) predict a vanishing drag in this limit, an observation tantamount to experimental results. Nevertheless, between Grad-13 (
 $\alpha _0=2/5$) and the CCR, with phenomenological coefficient
 $\alpha _0=3/5$, the latter gives the best quantitative agreement for values of the Knudsen number beyond unity (i.e. well beyond its apparent limits of applicability).
The normalised drag force computed from the CCR–MFS, with  $\alpha _0 = 0$ (NSF),
 $\alpha _0 = 2/5$ (Grad-13) and
 $\alpha _0 = 3/5$ against Knudsen number. The experimental data of Millikan (1923) (fitted by Allen & Raabe (1982)) is plotted (circles) for comparison. The results are normalized with Stokes’ drag (6.7).

6.1.3. Slow flow around a spherical liquid droplet
In this section, we consider uniform flow (say, along the  $z$-direction) of a saturated vapour over a spherical liquid droplet with a uniform temperature. The far-field temperature of the surrounding vapour is same as that of the droplet, i.e.
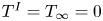 $T^{I}=T_{\infty }=0$,
 $p_{sat}=p_{\infty }=0$ and
 $\boldsymbol {v}_{\infty }=-\boldsymbol {v}^{I} = \{0,0,u_{\infty }\}$. We further assume that the droplet size remains fixed (quasi-steady-state assumption) and that deformation of the droplet is negligible, that is, the capillary number is very small.
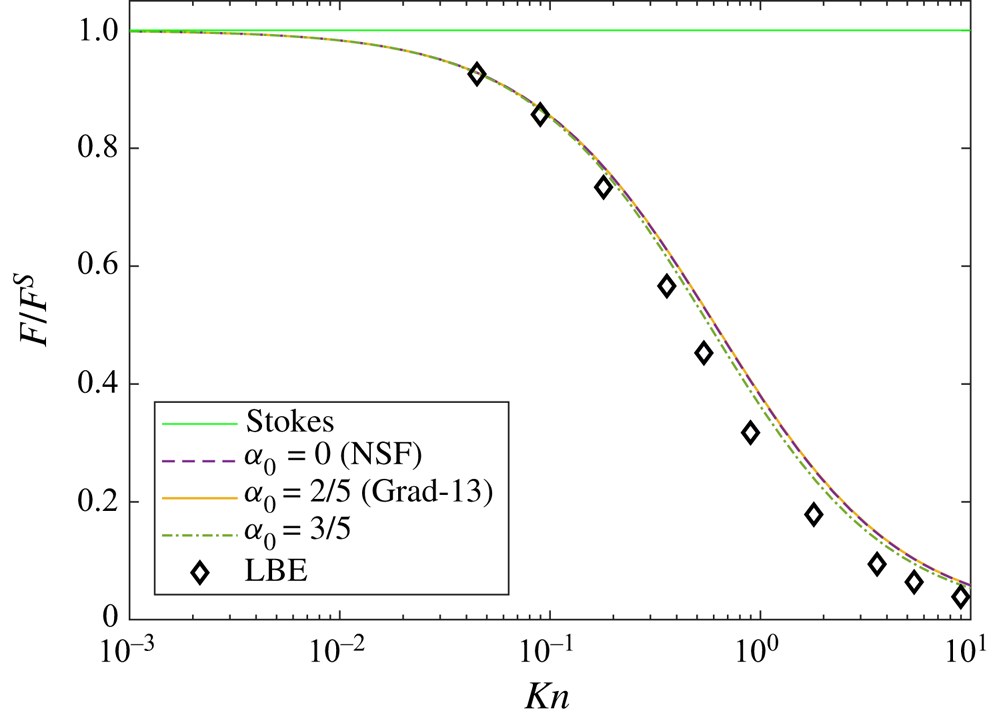
Figure 6 shows the normalised drag force on a liquid droplet versus Knudsen number, while allowing phase-change at the interface. This problem has been considered by Sone et al. (Reference Sone, Takata and Wakabayashi1994) from the LBE, and is clearly important from an engineering point of view. Owing to the motion of the vapour phase, evaporation and condensation take place on the surface of the droplet, thereby slightly reducing the drag on the sphere, cf. figures 5 and 6. Curiously, all theories, except for that of Stokes, give reasonably accurate results. Note that, in this case, the net mass and heat flux from the droplet are zero with evaporation on the front side of the sphere and condensation on the back.
The normalised drag force on a liquid droplet versus Knudsen number. The results computed from the CCR–MFS, with  $\alpha _0 = 0$ (NSF),
 $\alpha _0 = 2/5$ (Grad-13) and
 $\alpha _0 = 3/5$ are compared with LBE data (symbols) of Sone, Takata & Wakabayashi (Reference Sone, Takata and Wakabayashi1994).

The problems considered in previous sections typically allow for analytic solutions, which are often not available for various practical problem of interest. In the following sections, we develop cases of increasing complexity, starting first with the motion over two particles at a finite distance from each other.
6.2. Motion over two solid spheres
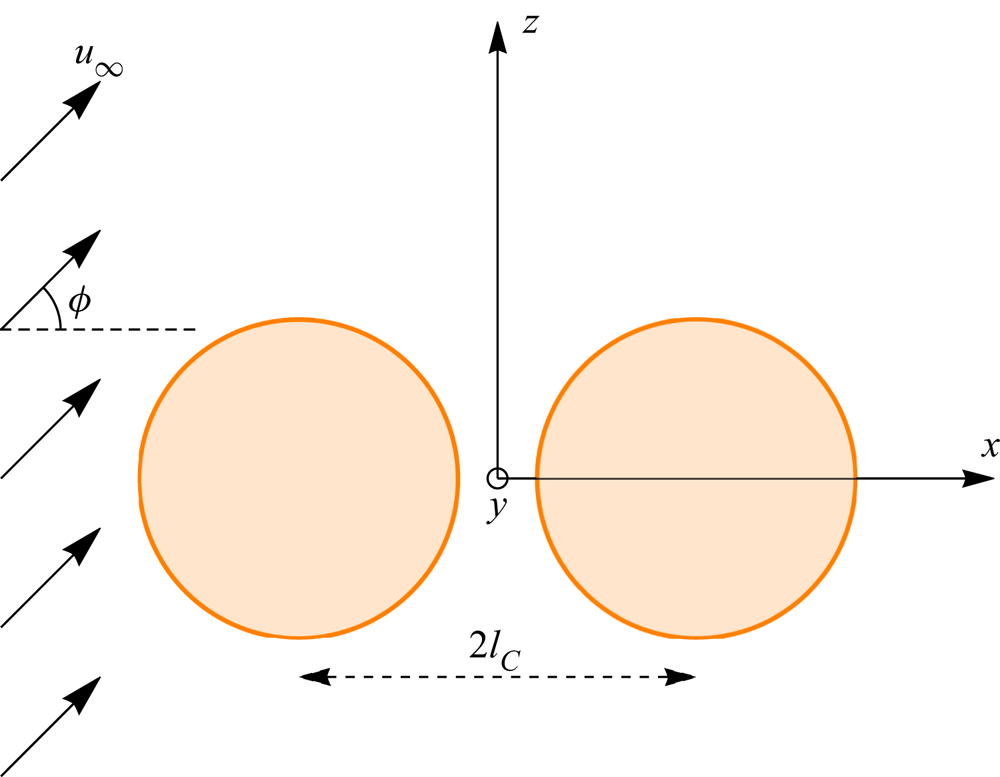
Let us consider a flow over two solid spheres of equal radius with both fixed in shape and size. The flow is characterised by the following parameters: radii of the spheres (i.e. the Knudsen number), centre-to-centre distance  $2l_C$ and the angle
 between the flow direction and the centreline; see figure 7.
Schematic for the flow around two solid spheres. Here,  $2l_C$ is the centre-to-centre distance and
 is the angle between flow direction and the line joining the centres.

For an axisymmetric case ( ), the theoretical result for the drag force (which is equal for both the spheres) calculated by Stimson, Jeffery & Filon (Reference Stimson, Jeffery and Filon1926) reads
 \begin{equation} F^{S}={-}6{\rm \pi} Kn u_{\infty}\beta, \end{equation}
where  $\beta$ is a correction coefficient which may be written in the form
 \begin{equation} \beta =\frac{4}{3}\sinh{\alpha} \sum_{k=1}^{\infty }\frac{n\left( n+1\right) }{\left( 2n-1\right) \left( 2n+3\right) }\left( 1-\frac{4\sinh ^{2}{\left( n+ \dfrac{1}{2}\right) \alpha} -\left( 2n+1\right) ^{2}\sinh ^{2}\alpha }{2\sinh \left( 2n+1\right) \alpha +\left( 2n+1\right) \sinh 2\alpha }\right), \end{equation}
with  $\alpha = \cosh l_{C}$.
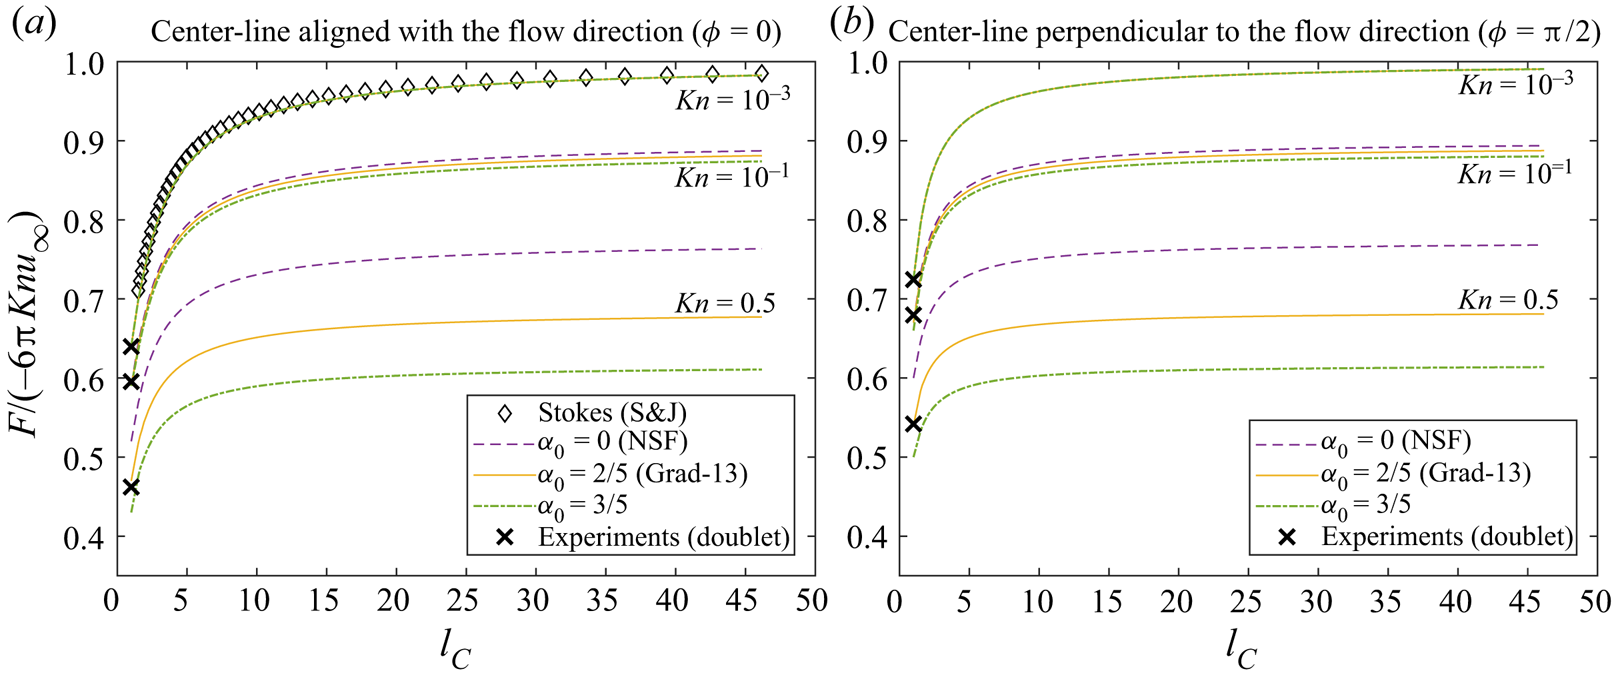
In figure 8(a), the drag force (normalised with Stokes’ drag (6.7) for the single sphere) for an axisymmetric case ( ) is plotted as a function of centre-to-centre distance for different values of the Knudsen number. The results from Stimson et al. (Reference Stimson, Jeffery and Filon1926), which are only valid in the limiting case
 $Kn \rightarrow 0$, are included for comparison (
 $\diamond$), and as expected, for small values of Knudsen number (
 $Kn = 10^{-3}$), our results match with Stimson et al. (Reference Stimson, Jeffery and Filon1926). The experimental results for
 $l_C = 1/2$ obtained by Cheng et al. (Reference Cheng, Allen, Gallegos, Yeh and Peterson1988) (and given by the empirical formula (6.10)) for
 $Kn = 10^{-3}$,
 $10^{-1}$ and
 $0.5$ are also included (
 $\boldsymbol {\times }$) for comparison. For small Knudsen numbers (
 $Kn \lesssim 10^{-1}$), all models (NSF, Grad-13, CCR) agree, whereas at large Knudsen numbers these are markedly different, with the NSF model over-predicting the drag compared with Grad-13 and CCR with
 $\alpha _0=3/5$. The effect of proximity is clearly visible on drag force, which decreases as
 $l_C$ is reduced (i.e. the spheres gets closer). Furthermore, in the limit
 $l_C\rightarrow \infty$ the drag approaches that of the single sphere case (cf. figure 5). In addition, as with the case of a single sphere (cf. figures 5 and 8a), the force monotonically decreases with increases in Knudsen number, for all models.
The drag force on two equal spheres versus centre-to-centre distance: (a) flow direction parallel to their line of centres and (b) flow direction perpendicular to their line of centres. The results computed from the CCR–MFS, with  $\alpha _0 = 0$ (NSF),
 $\alpha _0 = 2/5$ (Grad-13) and
 $\alpha _0 = 3/5$ are compared with the Stokes solution (
 $\diamond$) derived by Stimson et al. (Reference Stimson, Jeffery and Filon1926). The experimental results (denoted by
 $\boldsymbol {\times }$) for a doublet (
 $l_C = 1/2$) obtained by Cheng et al. (Reference Cheng, Allen, Gallegos, Yeh and Peterson1988) are included for comparison.

For the non-axisymmetric case ( ), the normalised drag force is plotted in figure 8(b) as a function of
 $l_C$, with
 $Kn = 10^{-3}$,
 $10^{-1}$ and
 $0.5$. The experimental results of Cheng et al. (Reference Cheng, Allen, Gallegos, Yeh and Peterson1988) for a doublet (
 $l_C = 1/2$) are denoted by symbols (
 $\boldsymbol {\times }$). The overall drag force in the non-axisymmetric case is higher compared with the axisymmetric case (cf. figure 8a,b) and as before, the NSF theory over-predicts the drag.
6.2.1. Drag on a doublet
An interesting case arises when one considers  $l_C\rightarrow 1/2$, i.e. when both spheres are in contact with one another, known as a doublet. Cheng et al. (Reference Cheng, Allen, Gallegos, Yeh and Peterson1988) carried out experiments to study the effects of orientation (modulated by an electric field) on the measured drag force.
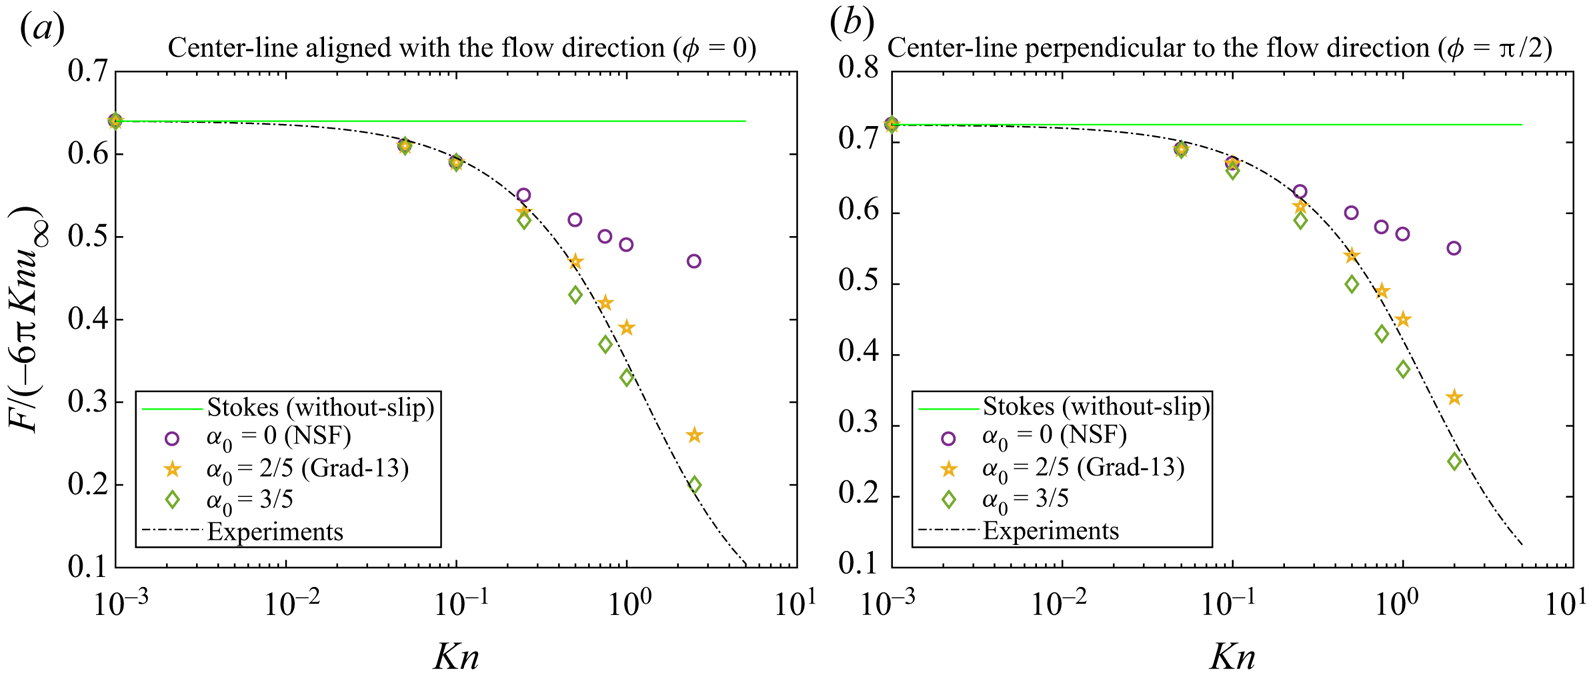
Figure 9 shows a comparison of the different models, computed using CCR–MFS, over a wide range of the Knudsen number. Here, the experimental data for the drag force acting on a doublet are taken from the empirical formula from Cheng et al. (Reference Cheng, Allen, Gallegos, Yeh and Peterson1988), as
 \begin{equation} F ={-}\frac{4{\rm \pi} Knu_{\infty}}{2^{1/3}}\frac{\phi_0}{1+\dfrac{Kn}{\phi_0}\left[ 1.142+0.558\exp\left({-}0.999\dfrac{\phi_0}{Kn}\right) \right]}{,} \end{equation}
where  $\phi _0 = 1.21$ or
 $\phi _0 = 1.37$ for flow moving in parallel (
 ) or in perpendicular (
 ) direction to the centreline, respectively.
The drag force on a doublet: (a) flow parallel to its line of centres (axisymmetric case) and (b) flow perpendicular to its line of centres (non-axisymmetric case). The experimental data are taken from the empirical formula (6.10) obtained in Cheng et al. (Reference Cheng, Allen, Gallegos, Yeh and Peterson1988).

As shown in figure 9, reassuringly for  $Kn \rightarrow 0$, the results converges to the without-slip solution of the Stokes equation. For larger values of the Knudsen number, the force decreases owing to slip, and as
 $Kn \rightarrow \infty$, it reaches a finite value for the NSF theory; while from (6.10) it vanishes. Remarkably, from the results of the Grad-13 and the CCR models, we find that the force indeed vanishes for large Knudsen numbers. The results obtained from the Grad-13 and CCR models are both in good agreement with the experimental results, a sightly better match at larger Knudsen number is obtained by the CCR with
 $\alpha _0=3/5$.
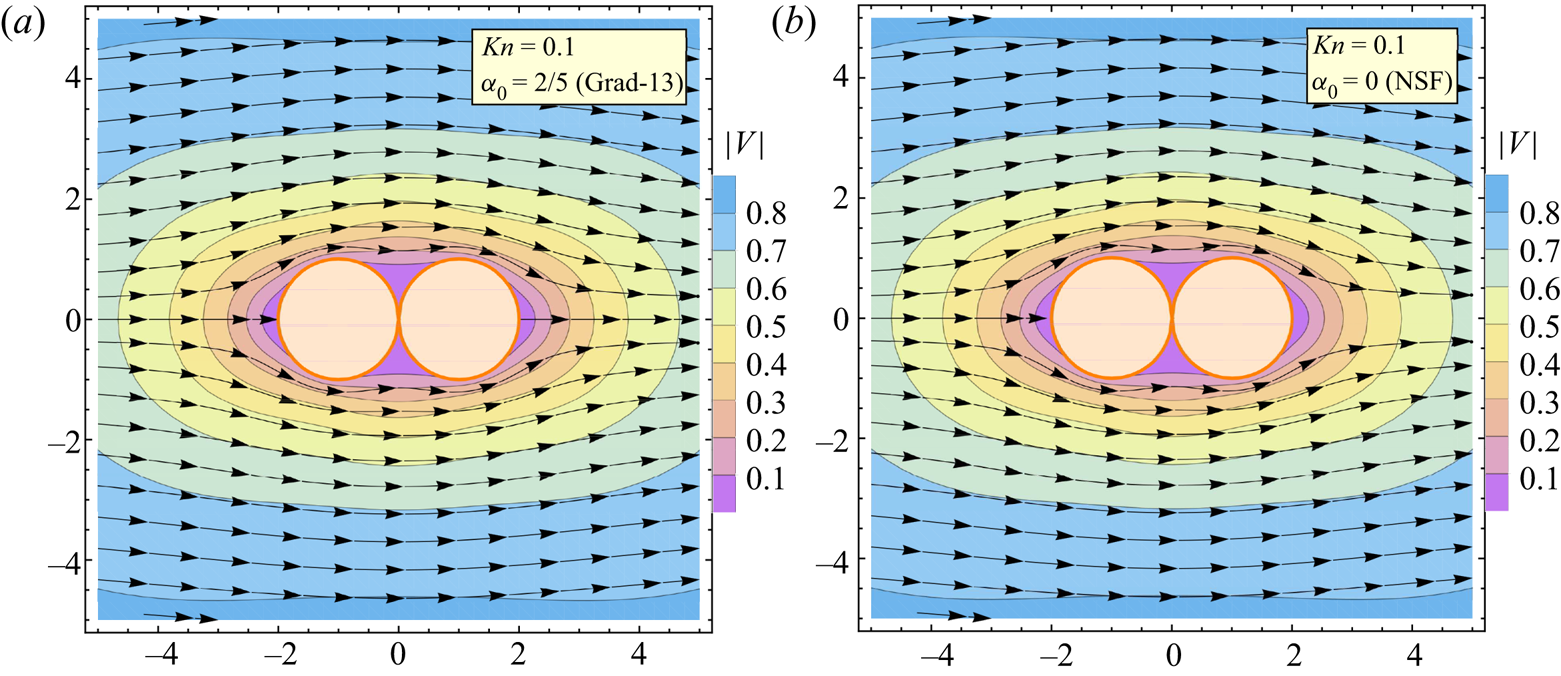
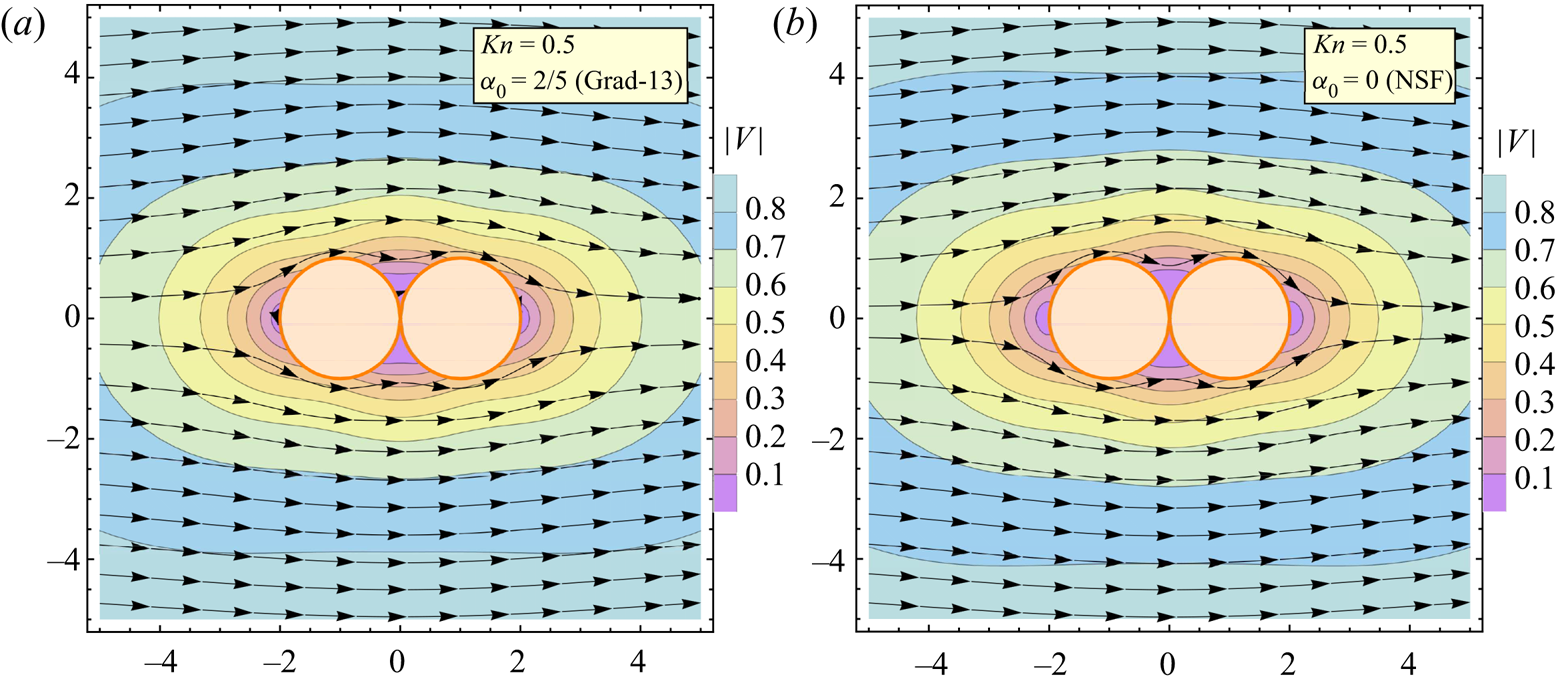
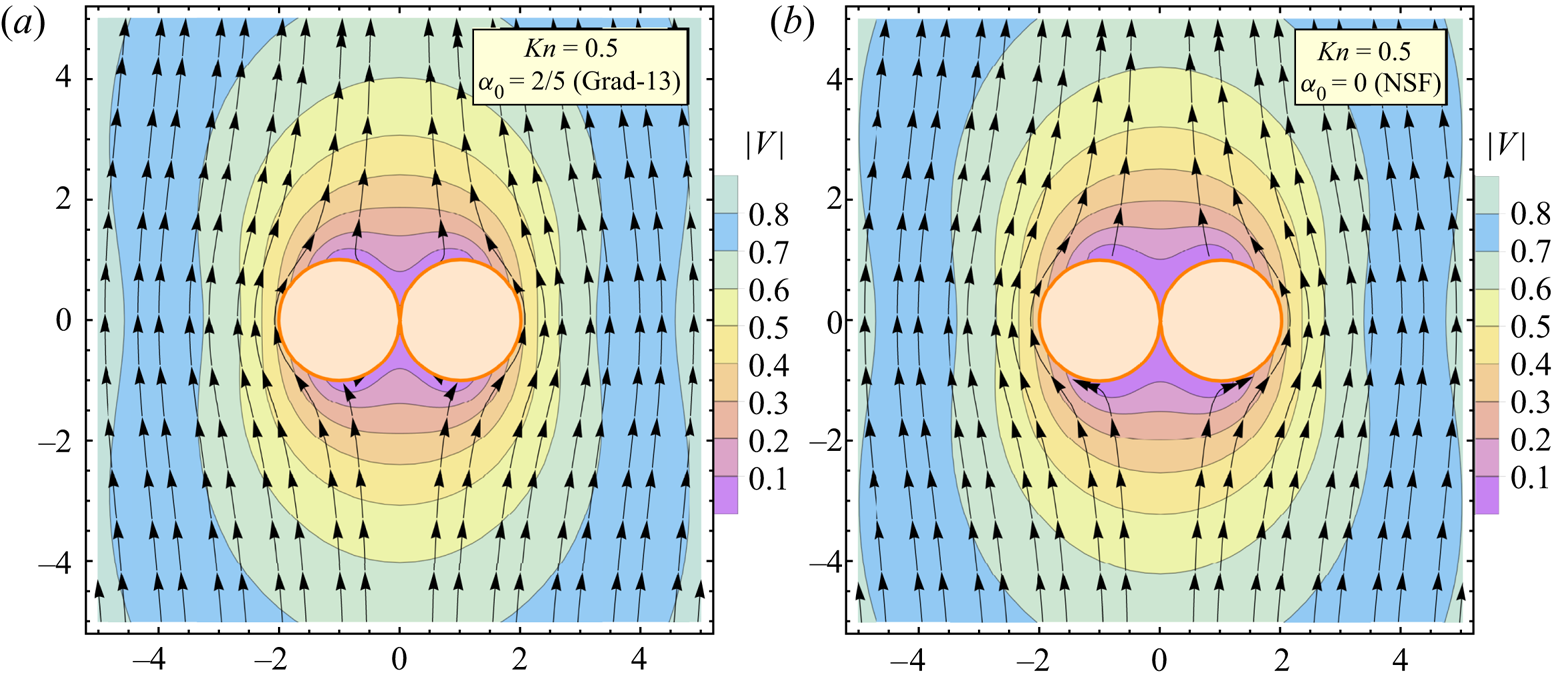
Figures 10 and 11 show the streamlines and the speed contours for the case  $Kn = 0.1$ and
 $Kn = 0.5$, respectively. The horizontal and vertical axes represent
 $x$- and
 $z$-axis, respectively, with flow in the
 $x$-direction. The left-hand side of these figures shows the Grad-13 (
 $\alpha _0=2/5$) results for the case
 , and the right-hand side shows the results computed from the NSF (
 $\alpha _0=0$) equations. Owing to the linearity of the equations, the speed contours are symmetric about the
 $x=0$ plane, resulting in equal drag forces on both spheres.
Streamlines and speed contours from the (a) Grad-13 and (b) NSF equations for Knudsen number 0.1: flow over a doublet with flow direction along the centreline ( ). Vertical and horizontal axes represent
 $x$- and
 $y$-directions (
 $N_c = N_s = 650$ and
 $\gamma = R_s/R_c = 0.1$).

Streamlines and speed contours from the (a) Grad-13 and (b) NSF equations for Knudsen number 0.5: flow over a doublet with flow direction along the centreline ( ). Vertical and horizontal axes represent
 $x$- and
 $y$-directions (
 $N_c = N_s = 650$ and
 $\gamma = R_s/R_c = 0.1$).

These contours show that, as to be expected, the slip velocity at the bottom and top surfaces increases with Knudsen number, resulting in reduced drag forces. For  $Kn = 0.1$ (figure 10), the flow line pattern predicted by the Grad-13 (a) and NSF (b) are very similar. The slip velocity is maximum near the top and bottom surface, which is virtually the same for the NSF and Grad-13 theories, thus giving similar predictions for the drag reduction (cf. figure 8). However, for
 $Kn = 0.5$ (figure 11), the Grad-13 theory predicts a larger slip and thus greater drag reduction. The results from the CCR with
 $\alpha _0=3/5$ are similar to those obtained from the Grad-13 theory, hence these are not shown here.
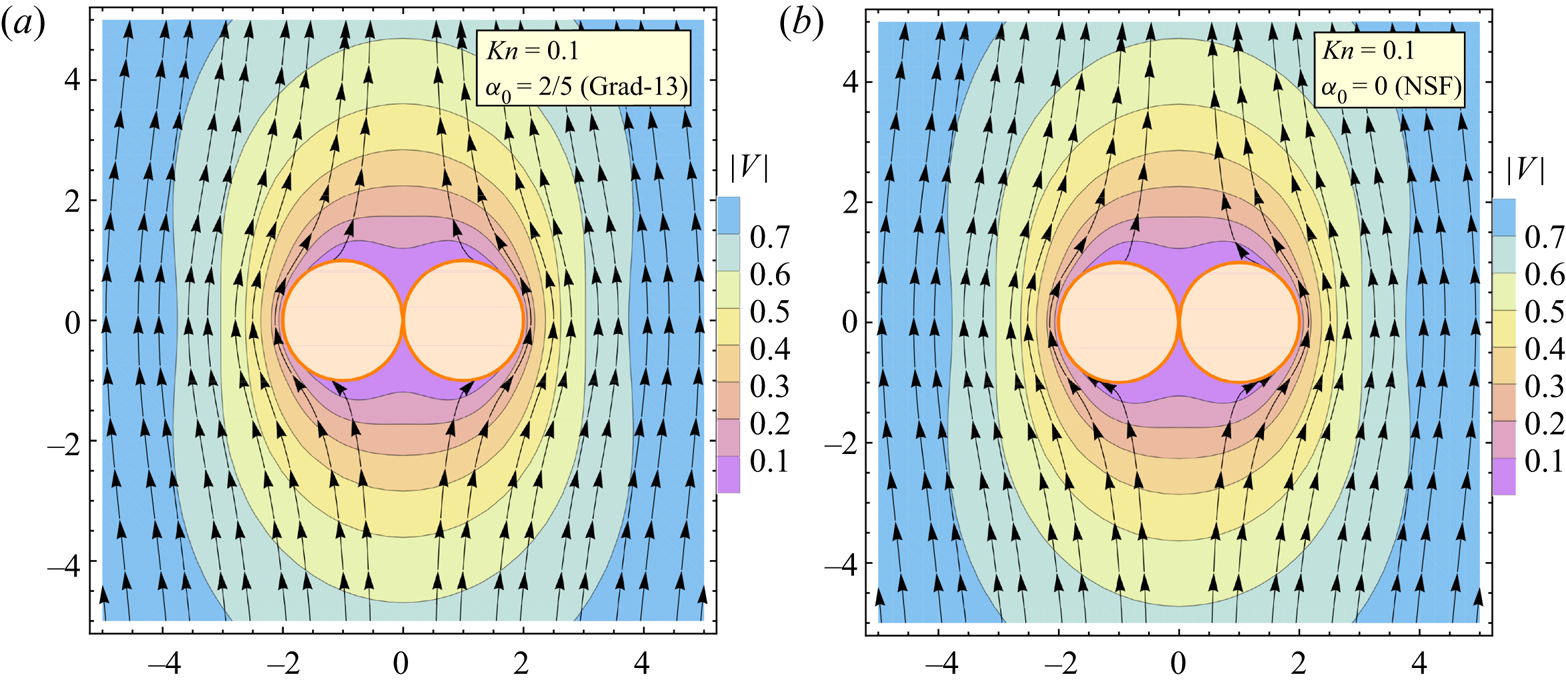
In figures 12 and 13, we again show the streamlines and speed contours predicted by both theories at  $Kn=0.1$ and
 $Kn=0.5$, respectively, for the case when flow (in the
 $z$-direction) is in a perpendicular direction to the centreline, i.e.
 . Unlike the previous case, this is a truly three-dimensional set-up, where no symmetry exists in the azimuthal direction, with the MFS it is remarkably simple to solve this fully three-dimensional flow. The slip velocity increases with increasing the Knudsen number thus reducing the drag coefficient.
Streamlines and speed contours from the (a) Grad-13 and (b) NSF equations for Knudsen number 0.1: flow over a doublet with flow direction perpendicular to the centreline ( ). Vertical and horizontal axes represent
 $x$- and
 $y$-directions (
 $N_c = N_s = 650$ and
 $\gamma = R_s/R_c = 0.1$).

Streamlines and Mach contours from the (a) Grad-13 and (b) NSF equations for Knudsen number 0.5: flow over a non-evaporative ( $\vartheta = 0$) doublet with flow direction perpendicular to the centreline (
 ). Vertical and horizontal axes represent
 $x$- and
 $y$-directions (
 $N_c = N_s = 650$ and
 $\gamma = R_s/R_c = 0.1$).

6.3. Interaction of two evaporating droplets
The evaporation dynamics of two interacting droplets suspended in vapour will be investigated here; a problem relevant to dense-spray applications. We consider two droplets placed is a saturated vapour with centre-to-centre distance  $2l_C$. Again, we consider the shape, size and the surface temperature of the droplet to be fixed.
As before, we consider two cases, i.e. (i) evaporation is driven by temperature difference (i.e.  $p_{sat}=p_{\infty }=0$ and
 $T^{I}=1$) and (ii) evaporation owing to pressure difference (
 $p_{sat}=1$ and
 $T^{I}=T_{\infty }=0$). The distance between the two droplets and the value of the Knudsen number are varied in order to investigate the proximity and rarefaction effects. The results from three models are compared with the NSF, Grad-13 and CCR with
 $\alpha _0=3/5$.
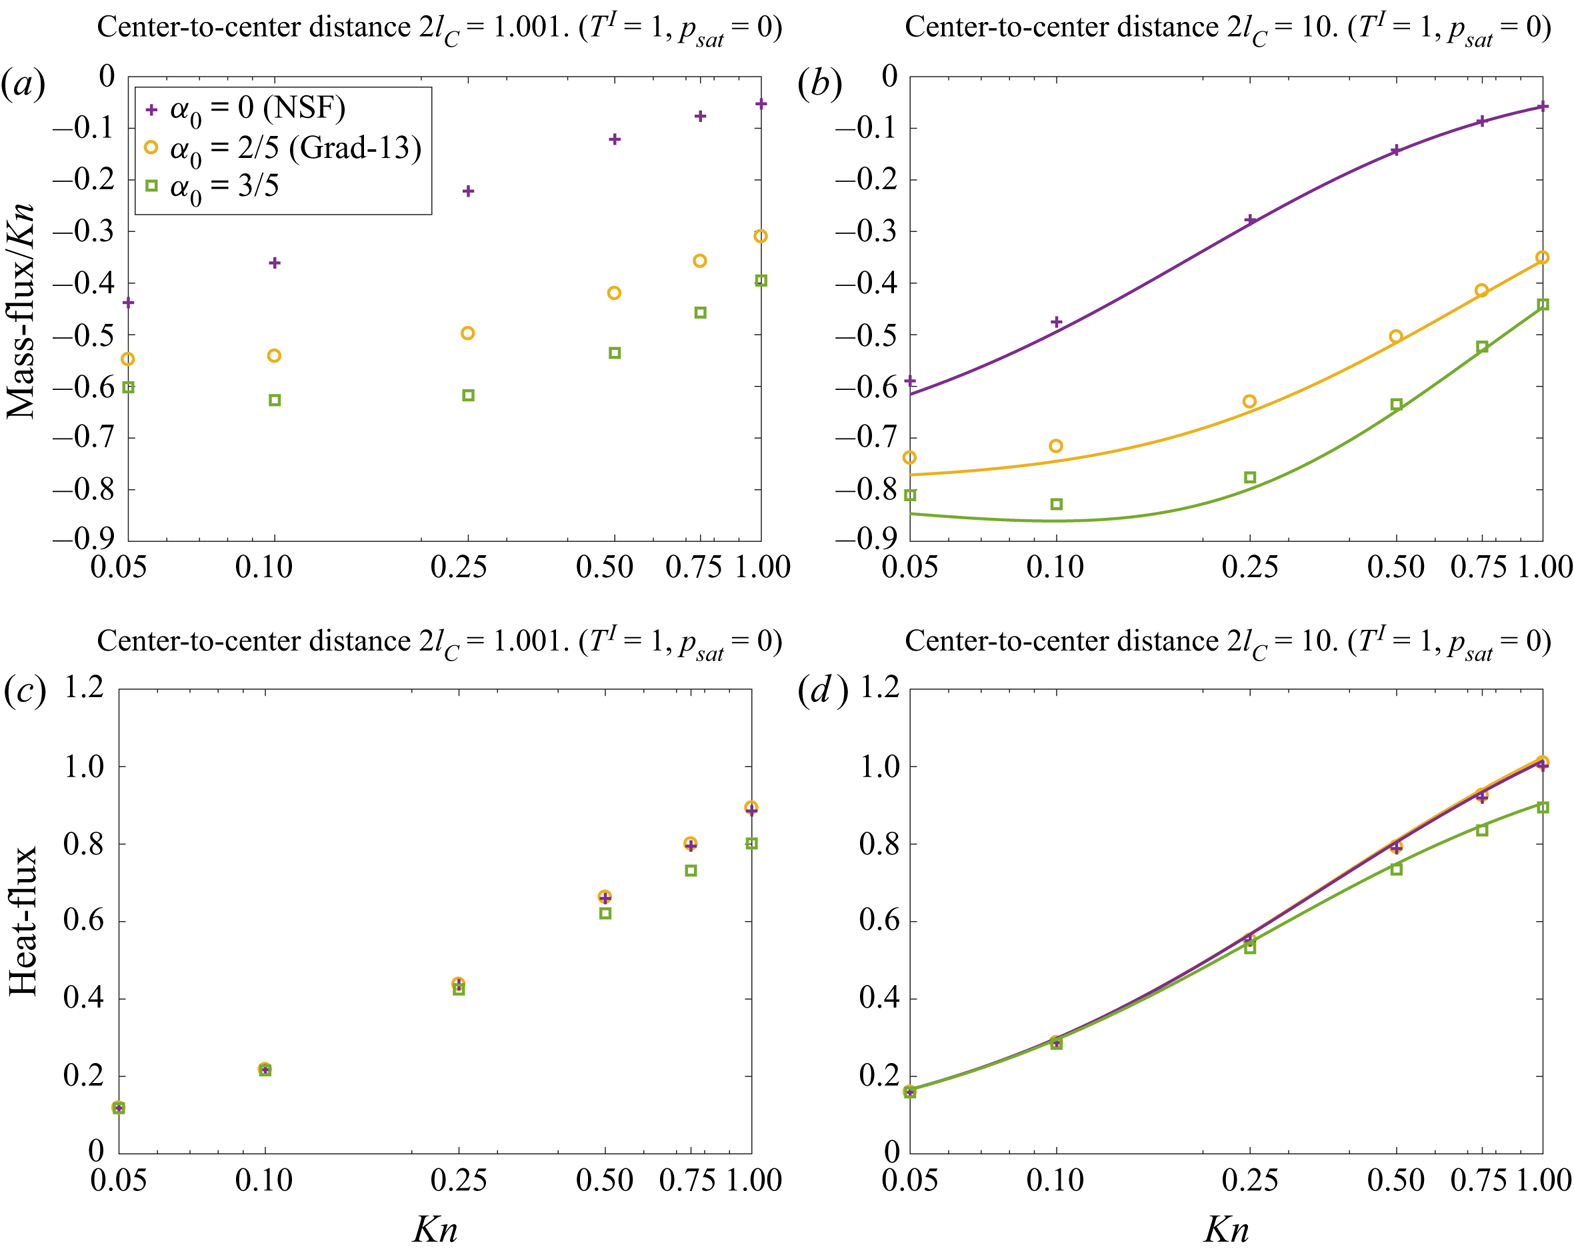
Temperature-driven case: In figure 14, we show the mass flux and the heat flux per unit area as a function of Knudsen number for the temperature-driven case. The mass flux reduces monotonically with the Knudsen number whereas the NSF theory predicts a higher mass flux than the CCR. Figures 14(a) and 14(b) illustrate the mass flux with centre-to-centre distance  $2l_C=0.001$ (i.e. when the droplets are next to each other) and
 $2l_C= 10$ (i.e. at a distance where proximity effects are negligible), respectively. The corresponding heat flux is shown in figures 14(c) and 14(d).
Two interacting droplets for the temperature-driven case ( $T^{I}=1, p_{sat}=0$): profiles of the (a) mass flux with centre-to-centre distance
 $2l_C=0.001$, (b) mass flux with
 $2l_C=10$ (c) heat flux with
 $2l_C=0.001$ and (d) heat flux with
 $2l_C=10$ as functions of the Knudsen number for NSF, Grad-13 and CCR with
 $\alpha _0=3/5$. Symbols denote MFS and curves represent analytic solution from a single droplet.

When the droplets are next to each other a shielding effect is observed, and, as a result, the mass flux reduces (cf. figure 14a,b). At  $Kn=0.05$, all three models predict approximately
 $29\,\%$ reduction in the mass flux as compared with a single droplet (i.e.
 $l_C\rightarrow \infty$). The reduction in the mass flux decreases with increase in Knudsen number. For
 $Kn=1$, NSF, Grad-13 and CCR with
 $\alpha _0=3/5$ predicts approximately
 $9\,\%$,
 $13\,\%$ and
 $12\,\%$ reduction in mass flux, respectively.
The mass fluxes computed from the MFS (symbols) for centre-to-centre distance  $10$ are shown in figure 14(b). The analytic results from a single droplet are also plotted (continuous lines) for comparison. As expected, as the droplets are moved farther apart, the results converge to the single-droplet case; the mass flux is within
 $5\,\%$ (for
 $Kn=0.05$) and
 $1\,\%$ (for
 $Kn=1$) for the single-droplet case.
Similarly, the proximity effects on the heat flux are visible in figures 14(c) and 14(d), for  $2l_C=0.001$ and
 $2l_C=10$, respectively. Again, the heat flux reduces as
 $l_C\rightarrow 1/2$, and as the value for the Knudsen number increases the proximity effects diminish. The percentage difference in the heat flux from the single-droplet cases varies from approximately
 $29\,\%$ to
 $12\,\%$ for
 $2l_C= 1.001$ and from approximately
 $4\,\%$ to
 $1\,\%$ for
 $2l_C= 10$, as the value of Knudsen number varies from
 $0.05$ to 1.
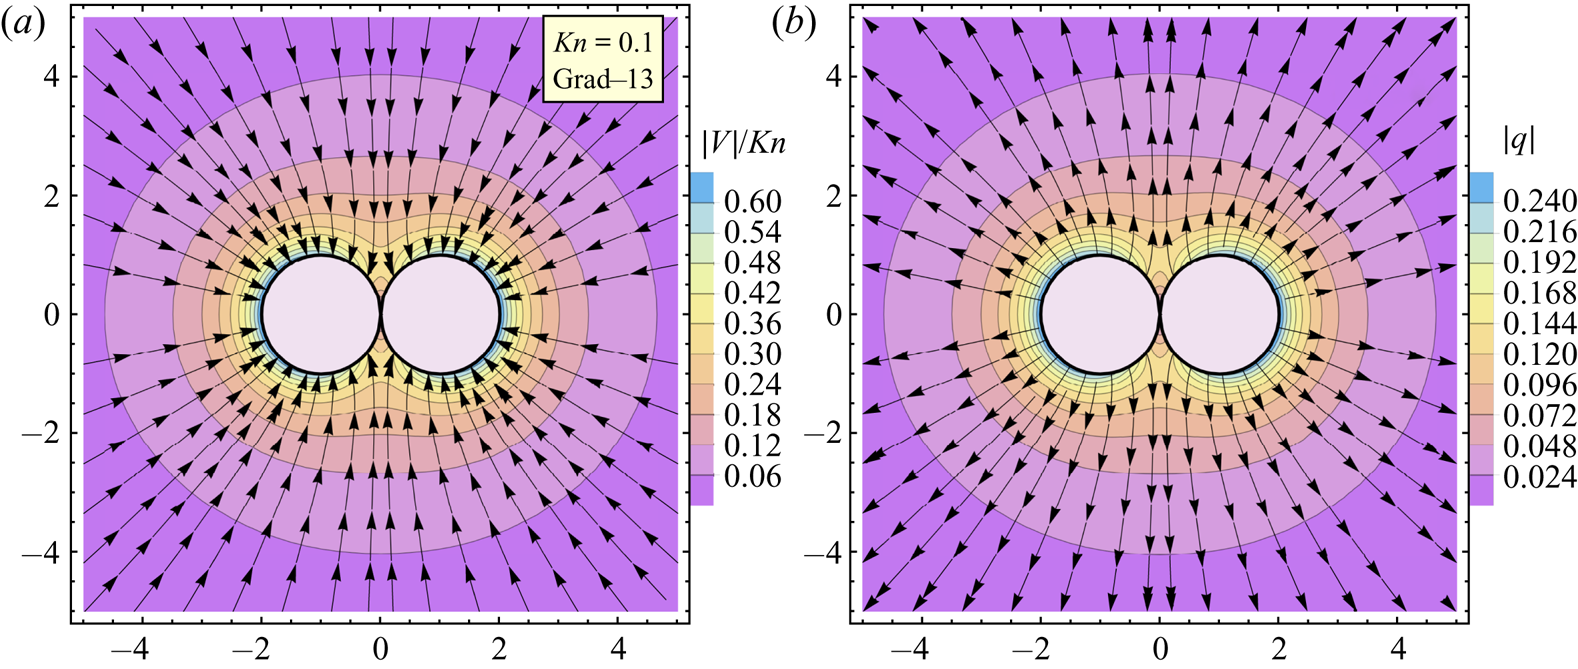
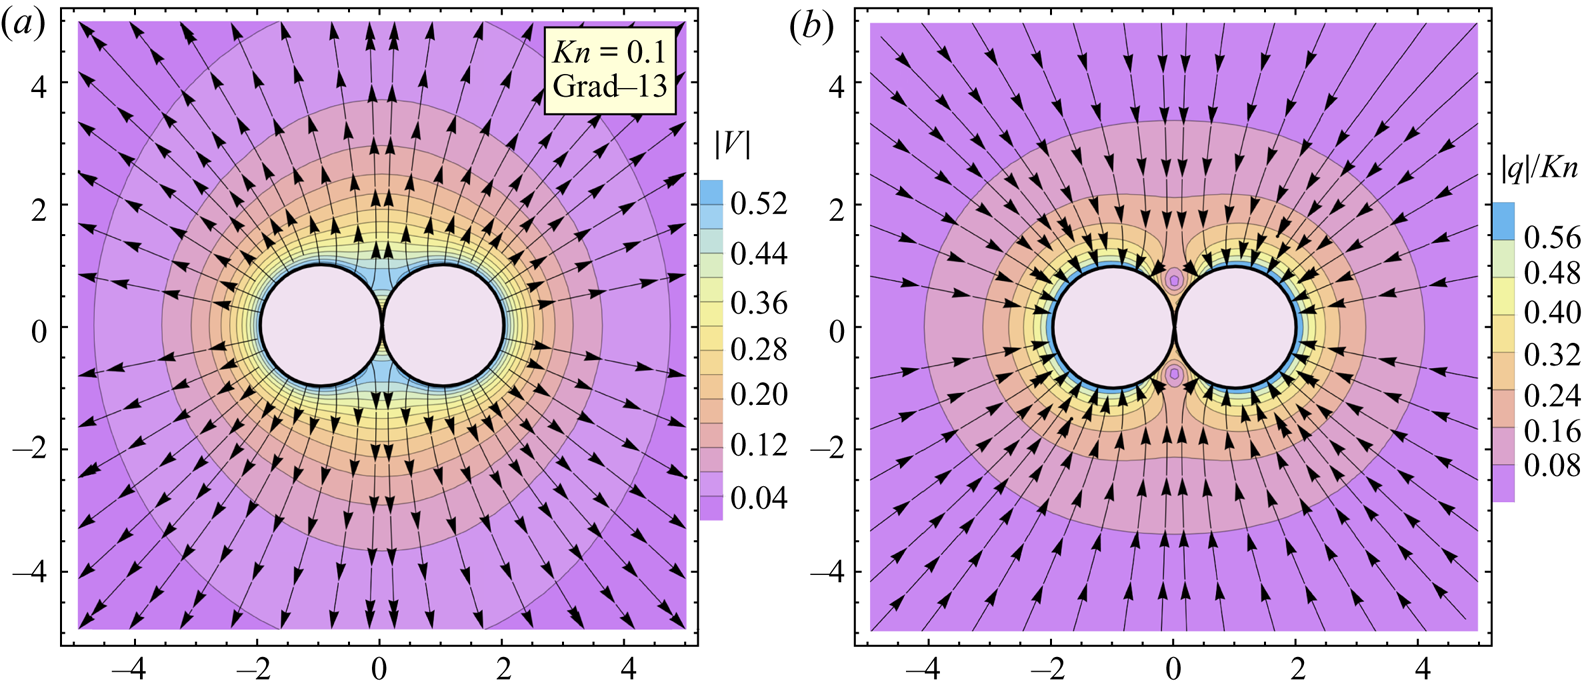
The vaporisation dynamics of a pair of droplets placed adjacent to each other is markedly different from the single-droplet counterpart. In figure 15, (a) the streamlines superimposed on the velocity magnitude contours and (b) the heat-flux lines and the magnitude contours are shown. The heat leaves the hot droplets owing to negative temperature gradients while condensation occurs in order to compensate for the heat loss. Figure 15 shows that the mass flux and the heat flux at the confined region between the droplets are sufficiently lower than at the outer regions. In this region, the vapour temperature is relatively high, thus a smaller temperature jump which leads to a reduced mass flux and heat flux.
Two droplets placed adjacent to each other ( $2l_c=1.001$) for the temperature-driven case (
 $T^{I}=1, p_{sat}=0$): (a) streamlines and speed contours and (b) heat-flux lines and magnitude, obtained from the Grad-13 MFS. Vertical and horizontal axes represent
 $x$- and
 $y$-directions (
 $N_c = N_s = 650$ and
 $\gamma = R_s/R_c = 0.1$).

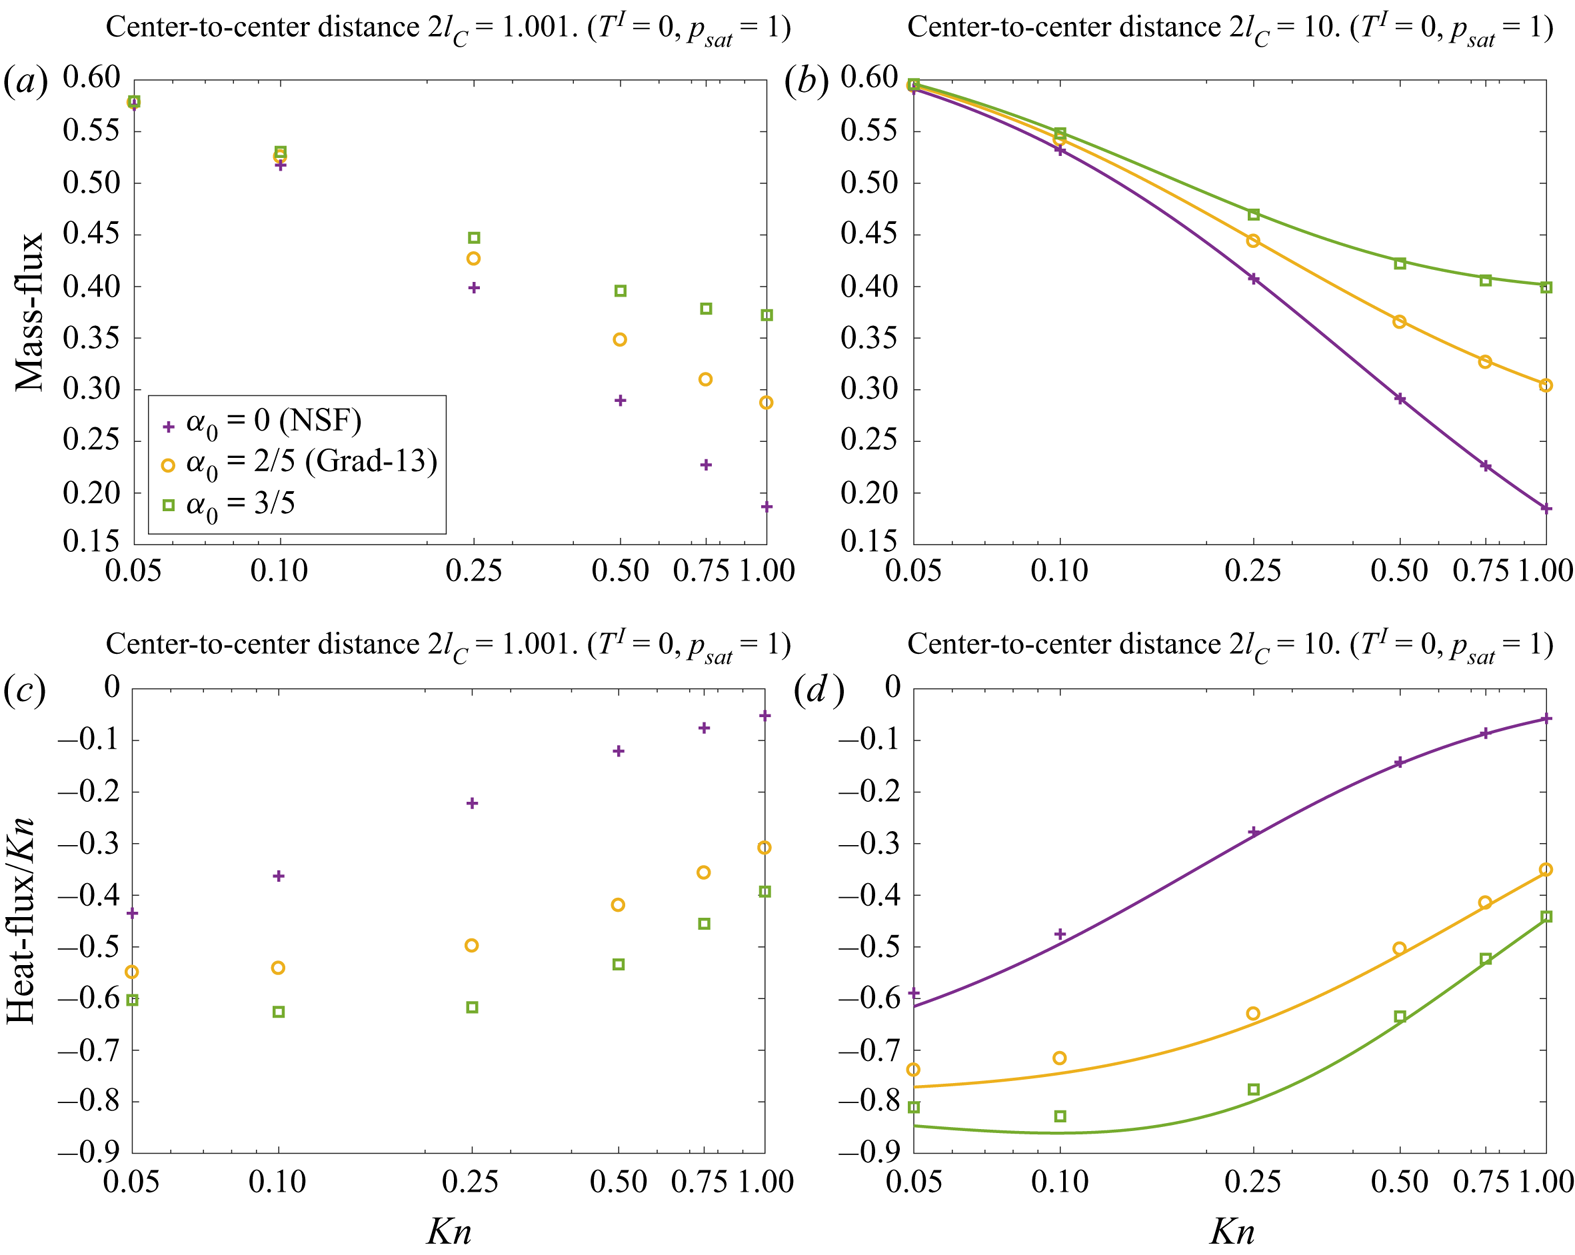
Pressure-driven case: In figure 16, we show (a) mass flux with centre-to-centre distance  $2l_C=0.001$, (b) mass flux with
 $2l_C=10$, (c) heat flux with
 $2l_C=0.001$ and (d) heat flux with
 $2l_C=10$ as functions of the Knudsen number for the pressure-driven case. Again, in order to gain insights into the proximity effects, the numerical solution obtained via the MFS (symbols) and the analytic results from a single-droplet case (continuous lines) are compared in figure 16. In this case, the mass flux is slightly reduced (
 ${\lesssim }3\,\%$ for
 $2l_C=0.001$ and
 ${\lesssim } 0.06\,\%$ for
 $2l_C=10$) in the range (
 $0.05\leq Kn\leq 1$). On the other hand, the proximity effects on the heat flux are observed to be significant. For
 $2l_C=0.001$, the magnitude of the heat flux is reduced approximately
 $29.3\,\%$ for NSF (
 $28.7\,\%$ for Grad-13 and CCR) at
 $Kn=0.05$ and approximately
 $10\,\%$ for NSF (
 ${\leq } 15\,\%$ for Grad-13 and CCR) at
 $Kn=1$. For
 $2l_C=0.001$, all models give less than a
 $4\,\%$ reduction in heat flux, for all ranges of Knudsen number considered.
Two interacting droplets for the pressure-driven case ( $T^{I}=0, p_{sat}=1$): profiles of (a) mass flux with centre-to-centre distance
 $2l_C=0.001$, (b) mass flux with
 $2l_C=10$, (c) heat flux with
 $2l_C=0.001$ and (d) heat flux with
 $2l_C=10$ as functions of the Knudsen number for NSF, Grad-13 and CCR with
 $\alpha _0=3/5$. Symbols denote MFS and curves represent analytic solution from a single droplet.

Another interesting point to be noted from figure 16(c,d) is that the heat flux predicted by the NSF equations is significantly lower in magnitude compared with the CCR and Grad-13 models, especially in the transition regime ( $Kn \geqslant 0.1$). Within this regime, the heat flux is not only driven by the temperature gradient (i.e.Fourier's law) but also owing to the pressure gradient, this second-order effect can easily be understood from the constitutive relations (2.5a,b) and the momentum balance equation (2.4a–c), which give
 \begin{equation} \boldsymbol{q}={-}\frac{c_{p}Kn}{Pr}\left( \boldsymbol{\nabla} T-\alpha _{0}\boldsymbol{\nabla} p \right). \end{equation}
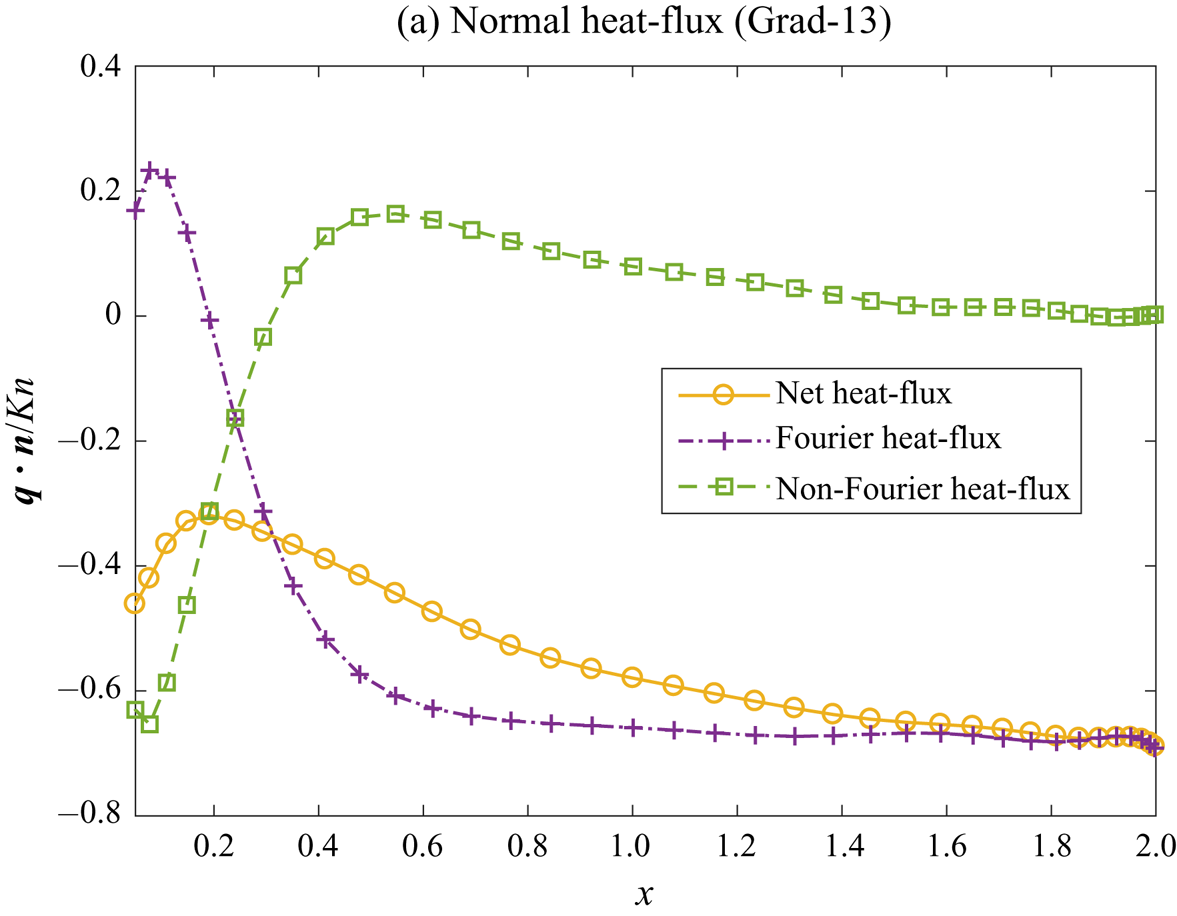
Here, the second term on the right-hand side is the non-Fourier contribution to the heat flux owing to pressure gradient (Rana et al. Reference Rana, Gupta and Struchtrup2018a). In figure 17, we show two different contributions to the scaled normal heat flux ( $\boldsymbol {q}\boldsymbol {\cdot }\boldsymbol {n}/Kn$) along the surface of the droplet (in the
 $x$–
 $z$ plane) for the pressure-driven case with
 $Kn=0.1$. As predicted from the Grad-13 theory, the heat flux owing to the pressure gradient (non-Fourier) and heat flux owing to the temperature gradient (Fourier) have opposing effects, and consequently the net heat flux is reduced in the second-order theories.
Two interacting droplets for the pressure-driven case ( $T^{I}=0, p_{sat}=1$): Fourier and non-Fourier contributions to the normal heat flux (
 $\boldsymbol {q}\boldsymbol {\cdot }\boldsymbol {n}/Kn$) given by the Grad-13 theory plotted along the top surface of the droplet in
 $x$–
 $z$ plane.

In figure 18, we again show the streamlines and the velocity magnitude contours (a), and the heat-flux lines and the magnitude contours (b) for the pressure-driven case. In this case, evaporation occurs owing to a negative pressure gradient and the heat flows inwards. The mass flux and the heat flux at the confined region between the droplets are reduced owing to a high vapour pressure.
Two droplets placed next to each other ( $2l_c=1.001$) for the pressure-driven case (
 $T^{I}=0, p_{sat}=1$): (a) stream lines and speed contours (b) heat-flux lines and magnitude, obtained from the Grad-13 MFS. Vertical and horizontal axis represent
 $x$- and
 $y$-directions. (
 $N_c = N_s = 650$ and
 $\gamma = R_s/R_c = 0.1$).

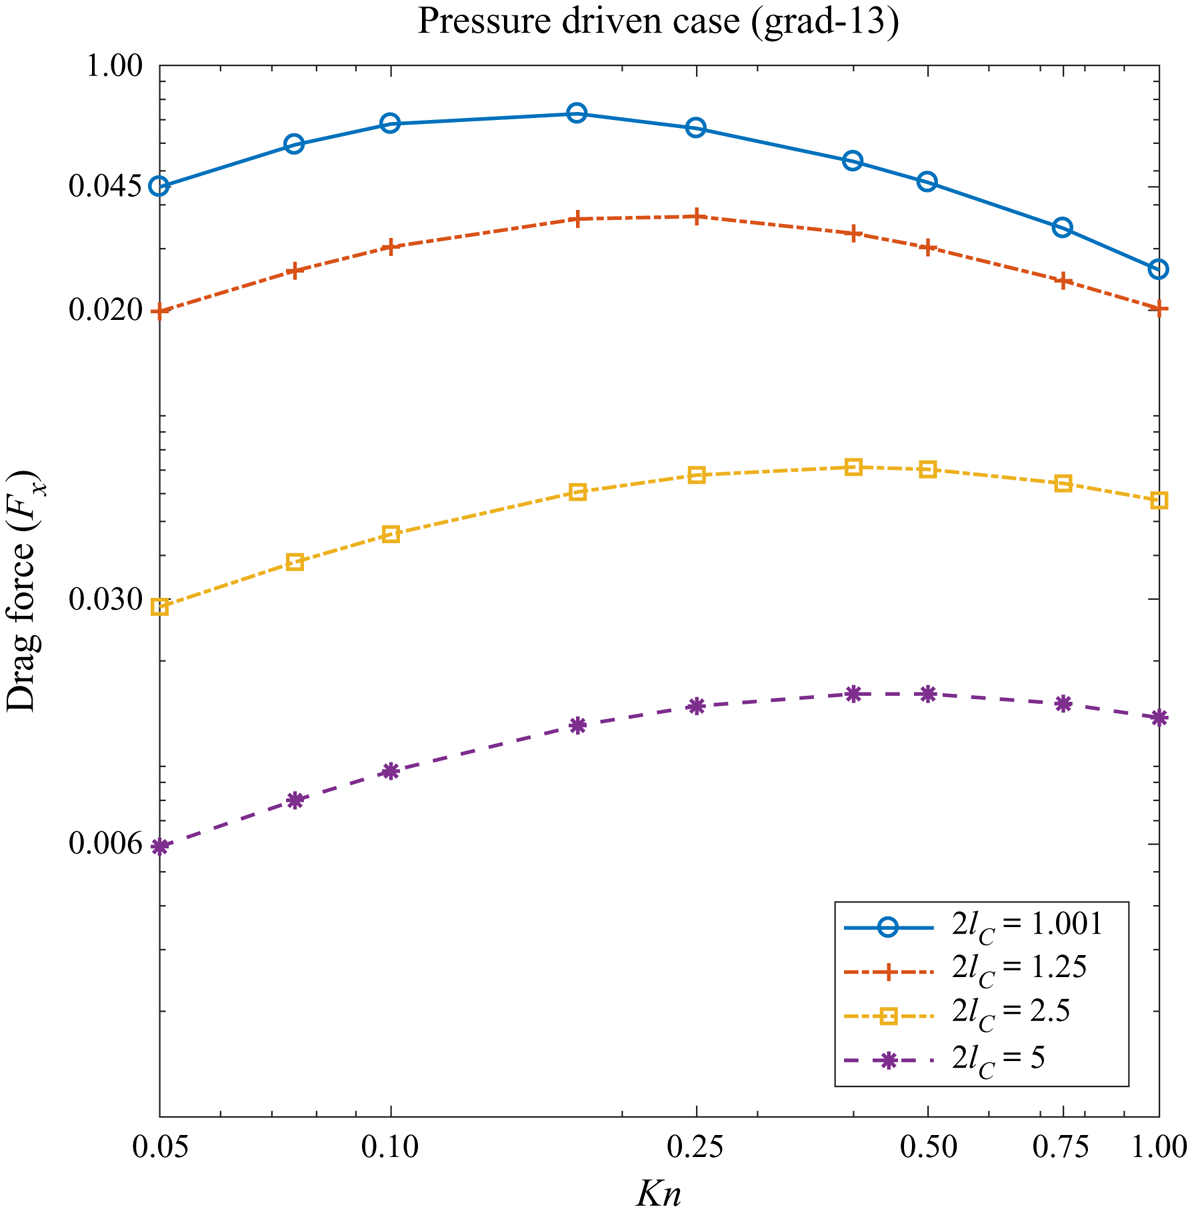
The high-pressure region created between two droplets pushes them away from each other. The net drag force (in the  $x$-direction) acting on each droplet is plotted in figure 19 as a function
 $Kn$. The results for various values of centre-to-centre distance shown in figure 19 are computed from the Grad-13 model, the drag force predicted by the NSF model is within
 $10\,\%$ and not shown. The force decreases exponentially as droplets become farther apart, i.e. as
 $l_C$ increases. Interestingly, the drag force attains a minimum value at a certain Knudsen number, which depends on how far the droplets are from each other. As
 $Kn\rightarrow \infty$, the drag force vanishes.
The drag force acting on the droplets versus Knudsen numbers for various values of the separation distance as predicted by the Grad-13 theory for the pressure-driven case.

6.4. Evaporation of a deformed droplet
In this section, we study evaporation/condensation from a deformed droplet with a fixed shape and size, in order to gain some initial insight into evaporation occurring during oscillatory and/or deformed droplet events, leaving the step to unsteady flow as a focus for future work. The effects of heat conduction and the flow inside the droplet are not considered. The parametric equation for the droplet surface in the second harmonic mode is given by (see, e.g., Sprittles & Shikhmurzaev Reference Sprittles and Shikhmurzaev2012)
 \begin{equation} \boldsymbol{X}=\eta _{0}\left[ 1+\frac{\eta }{2}\left( 3\cos ^{2}\phi -1\right) \right] \left\{ \sin \phi \cos \theta,\sin \phi \sin \theta,\cos \phi \right\}, \end{equation}
where  $\phi \in \lbrack 0,{\rm \pi} ]$,
 $\theta \in \lbrack 0,2{\rm \pi} ]$ and
 $\eta$ is the shape factor. The volume of the droplet is
 \begin{equation} V=\eta _{0}\frac{4{\rm \pi} }{3}\left(\frac{35+21\eta ^{2}+2\eta ^{3}}{35}\right)^{1/3}{.} \end{equation}
Therefore, in order to have the volume  $V$ equal to a spherical droplet of radius
 $1$, the normalising factor
 $\eta _{0}$ is given by
 \begin{equation} \eta _{0}=\left(\frac{35}{35+21\eta ^{2}+2\eta ^{3}}\right)^{1/3}{.} \end{equation}
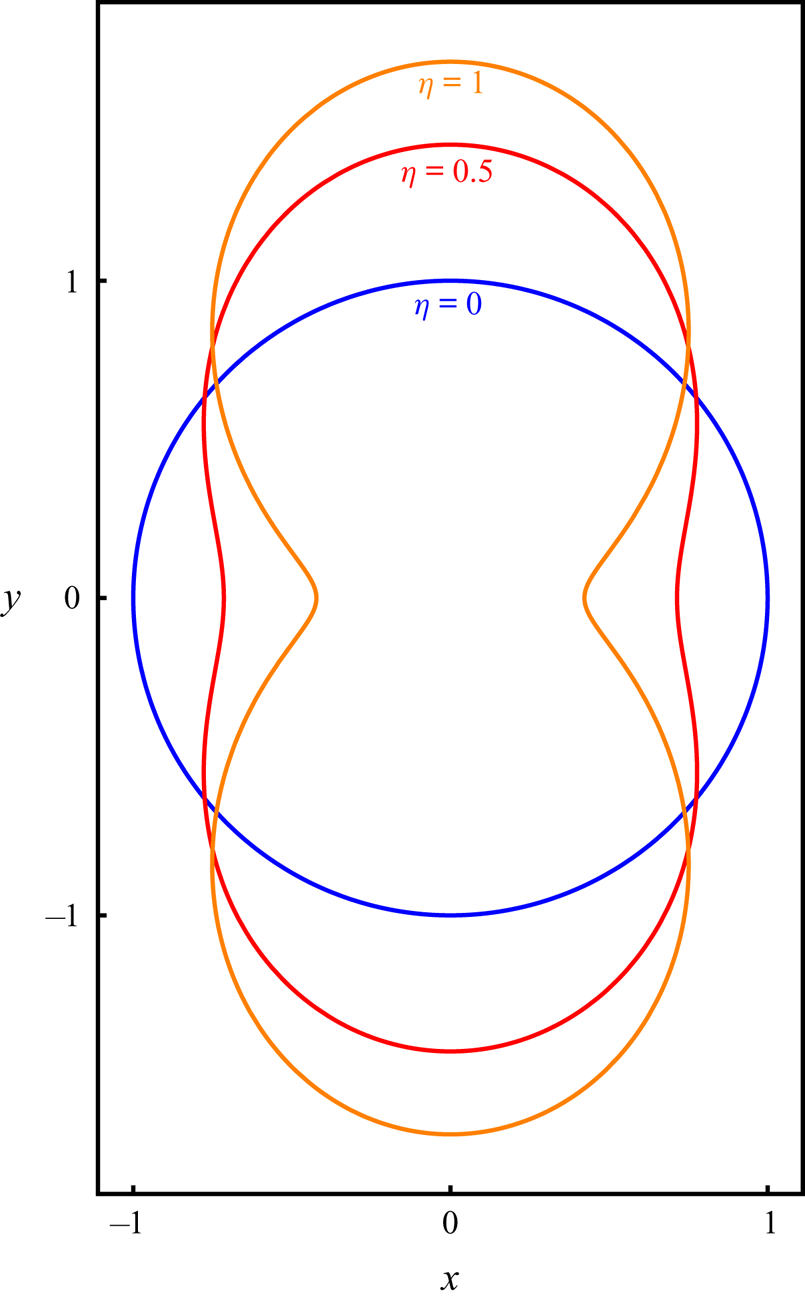
The droplet shapes with different values of shape parameter  $\eta =0$,
 $0.5$ and
 $1$ are depicted in figure 20; the corresponding (non-dimensional) surface area of the droplets are
 $4{\rm \pi} , 4{\rm \pi} \times 1.078$ and
 $4{\rm \pi} \times 1.192$, respectively.
Droplet shapes given by second spherical harmonics with shape parameter  $\eta = 0$,
 $0.5$ and
 $1$ and the normalising factor
 $\eta _0 = 35^{1/3}/(35+21 \eta ^2+2\eta ^3)^{1/3}$ ensuring that the droplet has fixed volume.

We shall again consider two cases: (i) flow caused by a unit pressure difference while the temperature of the liquid is equal to the far-field temperature (i.e.  $p_{sat}-p_{\infty }=1$ and
 $T^{l}-T_{\infty }=0$) and (ii) flow caused by a unit temperature difference while the saturation pressure in the liquid is same as the far-field pressure (i.e.
 $p_{sat}-p_{\infty }=0$ and
 $T^{l} -T_{\infty }=1$).
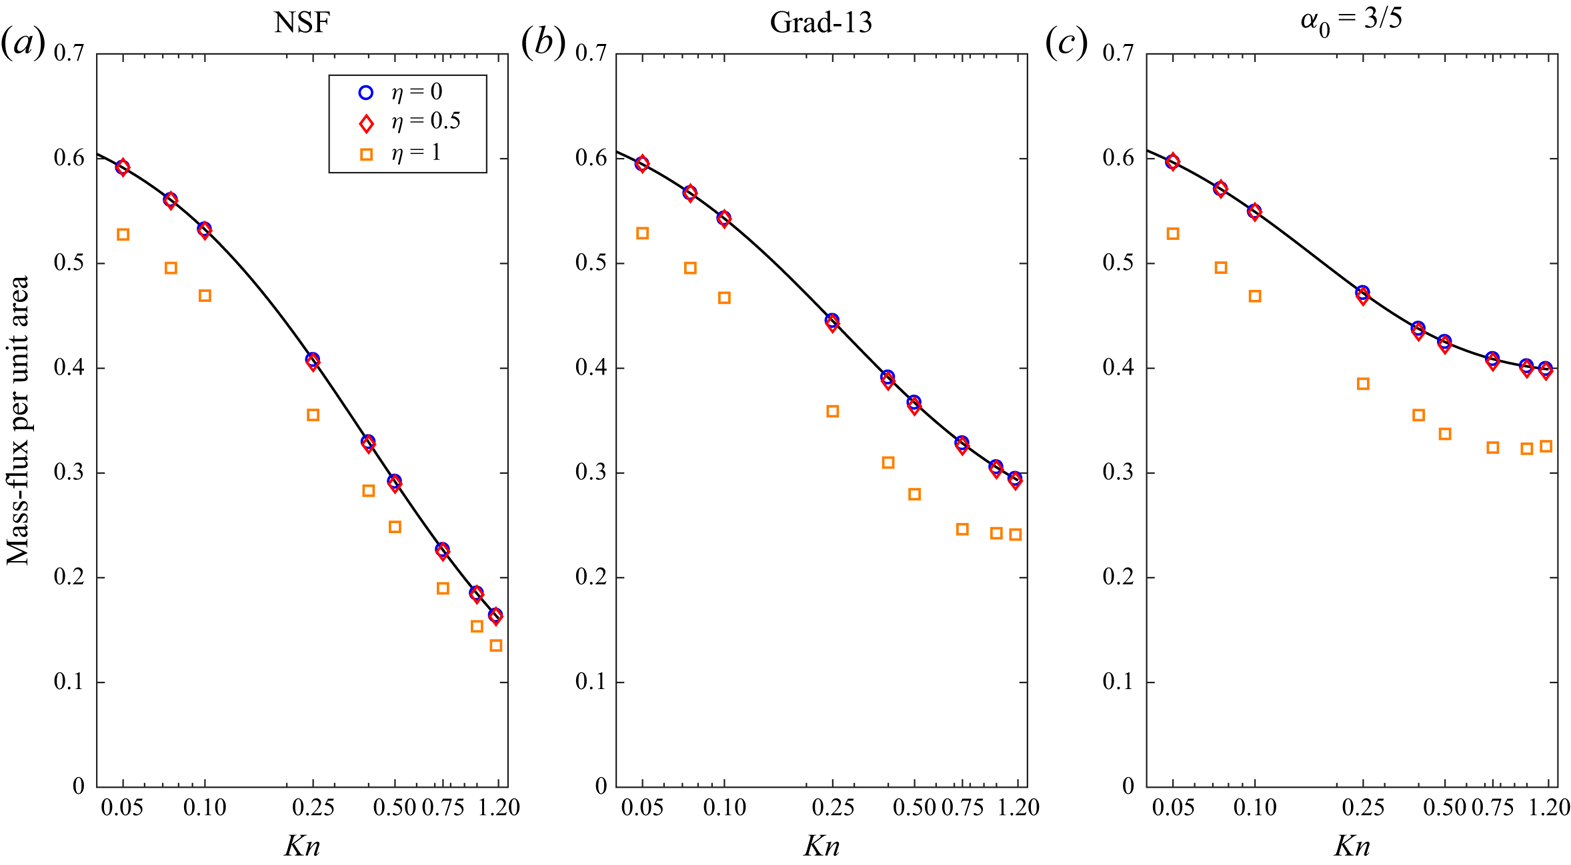
Pressure-driven case: In figure 21(a–c), we show the mass flux per unit area as a function of  $Kn$ computed using the NSF, Grad-13 and
 $\alpha _0=3/5$ models, respectively for the shape parameter
 $\eta = 0, 0.5$ and
 $1$. Here, the numerical results from the MFS are denoted by symbols and the analytic results for the spherical droplet (
 $\eta = 0$) are represented by the solid line. For small deformity (
 $\eta = 0, 0.5$), the mass flux is nearly same, however when the droplet is more deformed (
 $\eta = 1$) the mass flux is reduced. The percentage reduction in the mass flux (compared with a spherical droplet) is approximately
 $11\,\%$ for
 $Kn=0.05$ and approximately
 $21\,\%$ for
 $Kn=1$. In a similar manner to the case of two droplets placed next to each other, considered in the previous section, the reduction in the mass flux is caused by the formation of a high pressure in the high curvature (for
 $\eta = 1$) cusp region near
 $z=0$, which is not present at smaller
 $\eta$.
Pressure-driven case ( $p_{sat}-p_{\infty }=1$,
 $T^{l}-T_{\infty }=0$); mass flux per unit area versus Knudsen number with
 $\eta = 0$,
 $0.5$ and
 $1$: (a) NSF, (b) Grad-13 and (c)
 $\alpha _0=3/5$. The symbols denote the MFS and the solid lines represent analytic results for a spherical droplet.

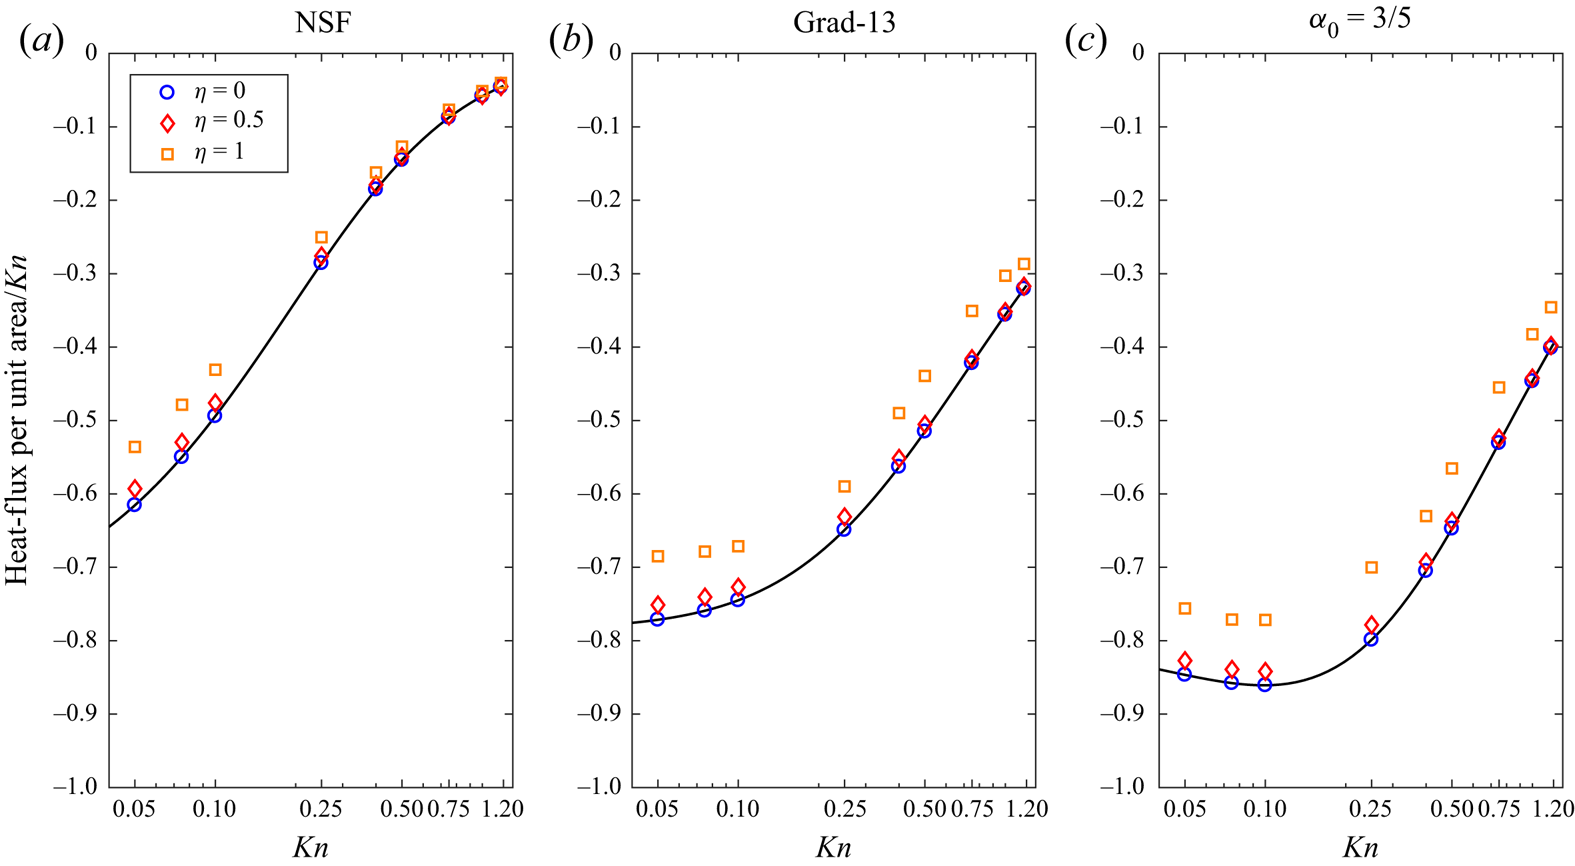
Similarly, in figure 22(a–c) we plot the heat flux per unit area as a function of  $Kn$ for the same shape parameters. Note that the heat flux owing to pressure difference is a first-order quantity in terms of
 $Kn$ (that is, it vanishes as
 $Kn\rightarrow 0$), hence in these figures we have scaled the heat flux with inverse
 $Kn$. Again, the heat-flux magnitude reduces as
 $\eta \rightarrow 1$. The reduction in the heat flux is approximately 13 %. Furthermore, the Grad-13 and CCR theories predict a larger heat flux compared with the NSF results owing to non-Fourier heat-flux contribution (6.11).
Pressure-driven case ( $p_{sat}-p_{\infty }=1$,
 $T^{l}-T_{\infty }=0$); heat flux per unit area/
 ${Kn}$ versus Knudsen number with
 $\eta = 0$,
 $0.5$ and
 $1$: (a) NSF, (b) Grad-13 and (c)
 $\alpha _0=3/5$. The symbols denote the MFS and the solid lines represent analytic results for a spherical droplet.

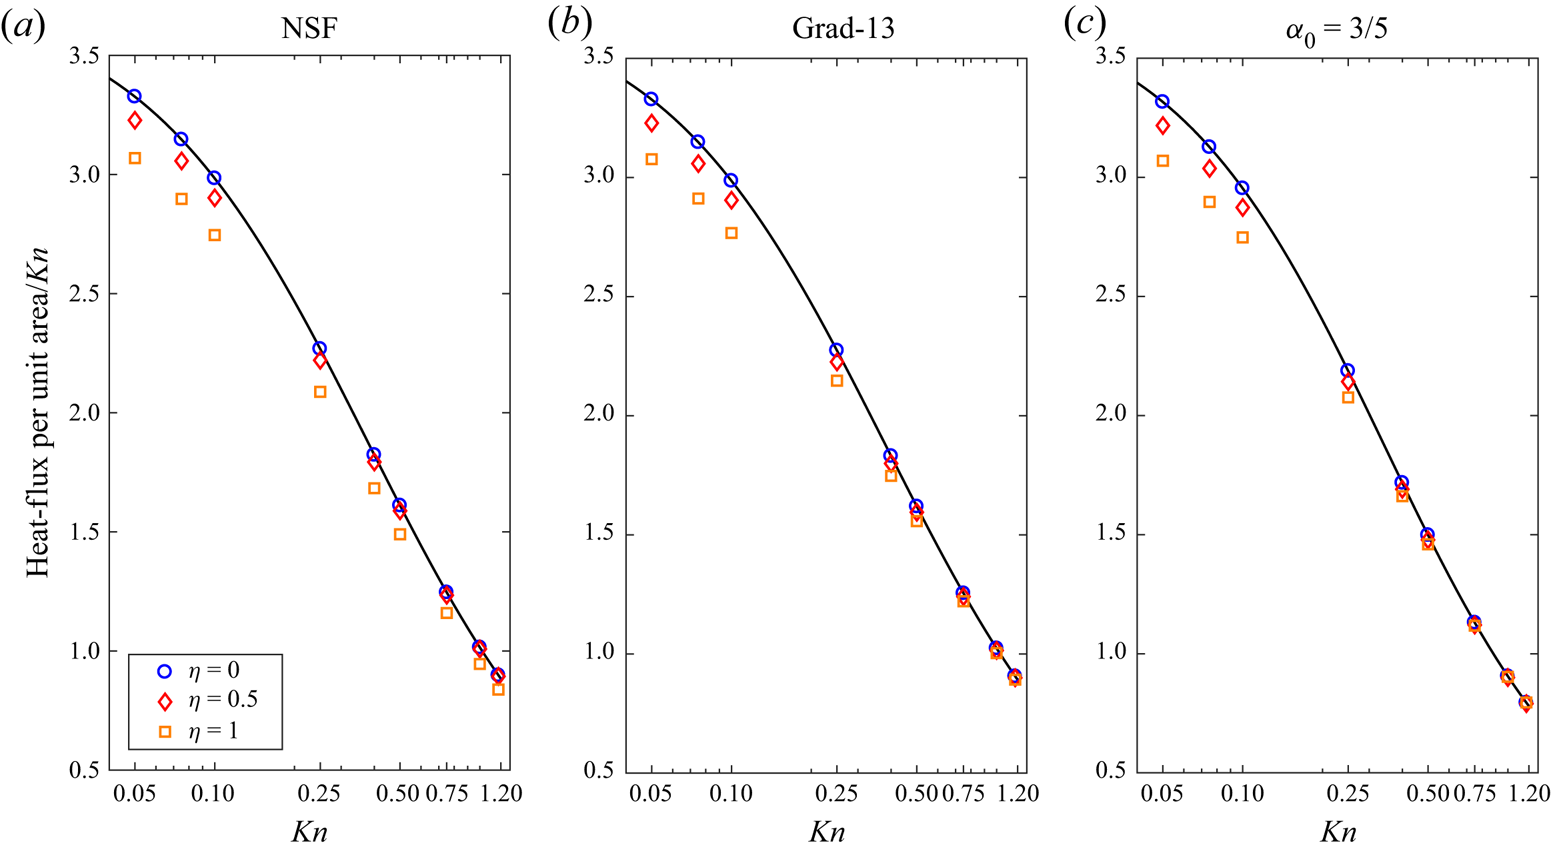
Temperature-driven case: In figure 23, we present the heat flux per unit area for the temperature-driven case for different shape factors (see legend in the figures) for NSF (a), Grad-13 (b) and CCR with  $\alpha _0=3/5$ (c). Note that, owing to the Onsager reciprocity relations (Chernyak & Margilevskiy Reference Chernyak and Margilevskiy1989), the mass flux for the temperature-driven case is the same as the heat flux for the pressure-driven case (figure 22), hence it is not shown. Evidently, from figure 23, the magnitude of the heat flux reduces with the deformation, i.e. as
 $\eta \rightarrow 1$. For NSF (figure 23a), the reduction is approximately 3 % for
 $\eta =0.5$ and approximately 12 % for
 $\eta =1$.
Temperature-driven case ( $p_{sat}-p_{\infty }=0$,
 $T^{l}-T_{\infty }=1$); heat flux per unit area/Kn versus Knudsen number with
 $\eta = 0$, 0.5 and 1: (a) NSF, (b) Grad-13 and (c)
 $\alpha _0=3/5$. The symbols denote the MSF solutions and the solid lines represent analytic results for a spherical droplet.

Curvature dependence of the saturation pressure: Throughout this paper, we have taken  $T^{I}$ and
 $p_{sat}$ as independent parameters. However, in general, the Clausius–Clapeyron–Kelvin formula provides a relation between the saturation pressure and the temperature at the interface (linearised and dimensionless) (McElroy Reference McElroy1979; Bond & Struchtrup Reference Bond and Struchtrup2004):
 \begin{equation} p_{sat}\left( T^{I}\right) =p_{sat}^{p}\left( T^{I}\right) \underline{\exp \left( 2\gamma \kappa \right)} {.} \end{equation}
Here,  $\gamma$ is the dimensionless surface tension (
 $\gamma =\hat {\gamma }/ \hat {\rho }_{l}\hat {\ell }\hat {R}\hat {T}_{0}$),
 $\kappa$ is the dimensionless curvature (
 $\kappa =\hat {\kappa }\hat {\ell }$) and
 $p_{sat}^{p}( T^{I}) =H_{0}T^{I}$ is the saturation pressure for a planar surface with
 $H_{0}$ (
 ${=}\hat {H}_{0}/\hat {R}\hat {T}_{0}$) being the dimensionless heat of evaporation.
Thus far, the modelling assumption has been that  $H_{0}$ (and
 $\gamma$) can be independently chosen to give a desired value of the saturation pressure. Notably, for the noble gases (vapour/liquid) the Kelvin correction term (underlined) in (6.15) are often small, unless the radius of curvature
 $\hat {\kappa }$ is in nanometers. For example, for argon, if we choose
 $\hat {T}_0=103\ \mathrm {K}$,
 $\hat {p}_0=p^p_{sat} (\hat {T}_0) = 0.4\ \mathrm {MPa}$,
 $\hat {\rho }_l = 1294.6\ \mathrm {kg} \ \mathrm {m}^{-3}$ and
 $\hat {\gamma } = 8.75\ \mathrm {mN}\ \mathrm {m}^{-1}$ (a case considered in Rana et al. Reference Rana, Lockerby and Sprittles2019), the Kelvin correction term gives
 $\exp (0.6305/a)$, where
 $a$ (in nanometres) is the inverse of local curvature
 $\hat {\kappa }$. Therefore, for a drop of size greater than
 $10\ \mathrm {nm}$, the effect of the Kelvin correction term will be less then
 $6.1\,\%$.
In order to compare our results with existing literature, in § 7 we use the dimensionless heat of evaporation  $H_{0}$ as an independent parameter.
7. Inverted temperature profile and Knudsen layer
A notorious deficiency of the NSF and CCR theories is their inability to capture the Knudsen layer, a kinetic boundary layer extending within a few mean free paths into the domain (Sone Reference Sone2007; Struchtrup & Torrilhon Reference Struchtrup and Torrilhon2008; Torrilhon Reference Torrilhon2016). We have seen in previous sections that the CCR model is able to predict global flow features, such as net mass flux, heat flux and drag, however, it may fail to describe finer flow features, especially those in which the Knudsen layer and other rarefaction effects are dominant. In this section, we consider such a case.
Let us consider heat and mass transfer between two liquid layers located at locations  $x=\pm 1/2$, see figure 24. We prescribe the dimensionless temperature and saturation pressure of the liquid layers as
 $T^{I}( \pm 1/2) =\pm \Delta \theta$ and
 $p_{sat}( \pm 1/2) =\pm \Delta p$. For a planar surface,
 $\hat {\kappa }=0$, and thus
 $\Delta p = \Delta \theta H_{0}$.
Schematic for heat and mass transfer between two liquid layers.

After some calculation, the analytic solution of the linear problems (2.4a–c) and (2.5a,b) assumes the form
 \begin{gather} v_{x} =c_{1}{, }\quad q_{x}=c_{2}{, }\quad T={-}\frac{Pr c_{2}}{c_{p} Kn}x{,} \end{gather}
 \begin{gather}p =\sigma _{xx}=0{,} \end{gather}
where  $c_{1}$ and
 $c_{2}$ are integration constants, which need to be evaluated using boundary conditions. Solving (4.2) for
 $c_{1}$ and
 $c_{2}$ gives
 \begin{gather} c_1 = \sqrt{\frac{2}{\rm \pi}}\left(\frac{(0.306763 +1.62499 Kn)H_0-0.741358 Kn}{0.370583+1.77245 Kn}\right) \Delta\theta{,} \end{gather}
 \begin{gather}c_2 = \frac{5 Kn}{2 Pr}\left(\frac{0.741165 -0.157738 H_0}{0.370583+1.77245 Kn}\right) \Delta\theta {.} \end{gather}
Note that, for this problem, the CCR reduces to the NSF constitutive relations.
Interestingly, as can be seen from inspection of (7.2b), the conductive heat flux  $q_{x}$ switches sign for
 $H_{0} \geqslant 4.7$, which leads to an inverted temperature profile in the vapour, this is qualitatively consistent with kinetic theory (Pao Reference Pao1971) and MD simulations (Frezzotti, Grosfils & Toxvaerd Reference Frezzotti, Grosfils and Toxvaerd2003). Notably, the NSF equations with classical boundary conditions, i.e. with no temperature-jump boundary conditions, along with the Hertz–Knudsen–Schrage, can not describe the inverted temperature phenomenon.
Figures 25(a) and (b) show the temperature curves as functions of  $x$ for
 $\Delta \theta =0.05{, }H_{0} =1 ({<}4.7)$ and
 $\Delta \theta =0.05, H_{0}=7.5 ({>}4.7)$, respectively, for
 $Kn=0.078$. These flow parameters are chosen so that our results can be compared with those obtained from the direct simulation Monte Carlo (DSMC) and R13 theories given in Beckmann et al. (Reference Beckmann, Rana, Torrilhon and Struchtrup2018). Comparing both cases, when
 $H_0$ is smaller than the critical heat of evaporation (case 1) the temperature profile shows a large jump at both boundaries with higher temperature on the lower boundary. In this case, the mass and heat fluxes are both positive (i.e. from lower boundary to upper) and as expected, the temperature is higher at the lower boundary. On the other hand, in case 2,
 $H_0$ is larger then the critical heat of evaporation and the temperature profile is inverted. For this case the heat flows from the hot side (where condensation occurs) towards the cold side (where evaporation occurs). The results from the DSMC are denoted by symbols.
Temperature profiles as functions of location  $x$ for (a)
 $( \Delta \theta =0.05{, }H_{0}=1)$ and (b)
 $( \Delta \theta =0.05 {, }H_{0}=7.5)$ for
 $Kn=0.078$. The figure on the right shows the inverted temperature profile.

Evidently, the CCR theory qualitatively explains the intriguing inverted temperature phenomenon. However, the CCR model does not provide detail of the temperature profiles near to the boundaries, the region which is dominated by the Knudsen layer. The R13 theory provides improvement in predicting the temperature profile at this value of the Knudsen number because, as is well known, it can capture some basic features of the Knudsen layer.
8. Conclusion and future directions
The present paper studies liquid–vapour phase-transition processes in which  $Kn\lesssim 1$, i.e. down to sub-micrometre scales. In particular, we derive a set of fundamental solutions for the CCR system which allows for three-dimensional multiphase micro-flows at remarkably low computational cost, the fundamental solutions to the linearised NSF and Grad-13 equations are obtained as a special case. A set of thermodynamically consistent liquid–vapour interface conditions for the linearised CCR system are derived within the framework of irreversible thermodynamics.
Different macroscopic models were applied to solve the motion of a sphere in a gas and the results were compared with theoretical and experimental results from the literature. We observed that the results for the drag force obtained from the Grad-13 and CCR model are both in good agreement with the experimental results, a slightly better match at larger Knudsen number is obtained by taking  $\alpha _0=3/5$.
The motion of two spherical particles was investigated and compared with the classical Stokes solutions and experimental results. The drag force reduces as the Knudsen number increases, mainly owing to velocity slip at the surface. The effect of proximity is investigated on the drag force, which decreases as the particles get closer. For a doublet, contrary to the experimental observations, the Stokes and NSF equations predict a non-zero drag whereas the Grad-13 and the CCR, with coupling coefficient  $\alpha _0=3/5$, provide an excellent match with the experimental data. Proximity effects on mass and heat transfer coefficients of two interacting droplets were investigated over a range of Knudsen numbers. Two far-field conditions were examined, (i) pressure-driven, where
 $p_{sat}-p_{\infty }=1$,
 $T^{l}-T_{\infty }=0$, and (ii) temperature-driven, where
 $p_{sat}-p_{\infty }=0$,
 $T^{l}-T_{\infty }=1$. However, owing to the linearity of the governing equations and the boundary conditions involved, these two cases can be combined to give results for a general case. For the pressure-driven case a slight reduction (
 ${\lesssim } 3\,\%$) in the mass flux was observed when the droplets are placed next to each other. On the other hand, the heat flux was significantly reduced (
 ${\sim }30\,\%$). For the temperature-driven case, the situation is reversed, where a significant reduction in the mass flux was observed owing to shielding effects. We also considered the case of a single deformed droplet and studied the effects of deformity on the mass- and heat-transfer characteristics over a range of the Knudsen number.
Motivated by these findings, future work could be to extend this work to study the phase-transition process in polyatomic fluids and binary mixtures.
Extension of the current work to unsteady flows and coupling to liquid dynamics (Rana et al. Reference Rana, Lockerby and Sprittles2019; Chubynsky et al. Reference Chubynsky, Belousov, Lockerby and Sprittles2020) can be considered in the future, the liquid phase can be modelled as an incompressible fluid (Stokeset/Oseenlet and heatlet) and the vapour phase modelled via the CCR model. However, it will require solving the moving-boundary problem efficiently within the MFS framework (Jiang et al. Reference Jiang, Wang, Bai and Pang2014). Another line of inquiry would be to implement these fundamental solutions via boundary integral methods which offer more flexibility and robustness as compared to the MFS. A prominent deficiency of the NSF and the CCR model is their inability to capture the Knudsen layer, a kinetic boundary layer extending a few mean free paths into the domain. Future work can also include finding fundamental solutions to the linearised R26 equations in order to incorporate Knudsen layers. The cornerstone of this work is the linearity of the differential operators involved, which allow us to obtain Green's functions and formulate the MFS. As such, the method developed here can not be directly applied to nonlinear problems. In another context, the MFS has been applied to some nonlinear problems using appropriate fixed-point iterative schemes (Fan, Chen & Monroe Reference Fan, Chen and Monroe2009). It would be interesting to attempt a similar approach for solution of the nonlinear CCR model and/or nonlinear boundary conditions.
Funding
This work has been partially supported via the Scheme for Promotion of Academic and Research Collaboration (SPARC) grant (IDN_SKI 444) funded by the Ministry of Human Resources Development (MHRD), India and EPSRC Grant Numbers EP/N016602/1, EP/P031684/1 and EP/S029966/1. The authors are grateful to Dr J. Padrino from the University of Warwick for many fruitful discussions on Green's functions.
Declaration of interests
The authors report no conflict of interest.
Appendix A. Derivation of the Green's functions for the Sourcelet
The Fourier transformation of the energy conservation law (3.5a–c $_3$) and the heat-flux constitutive relation (2.5a,b
 $_2$) gives
 \begin{equation} \boldsymbol{k}\boldsymbol{\cdot} \boldsymbol{\tilde{q}}=0\quad \text{and}\quad \boldsymbol{\tilde{q}}=\textrm{i}\frac{ c_{p}Kn}{Pr }\boldsymbol{k}\tilde{\varTheta}{,} \end{equation}
where we have defined  $\varTheta =T-\alpha _{0}p$ and its Fourier transformation
 $\mathcal {F} [ \varTheta ( \boldsymbol {r}) ] =\tilde {\varTheta } ( \boldsymbol {k})$. Clearly, the inverse Fourier transformation of (A1) leads to
 \begin{equation} \boldsymbol{q=0}\quad \text{and} \quad\varTheta =0{.} \end{equation}
Similarly, taking a Fourier transformation of (3.5a–c $_{1,2}$), one obtains
 \begin{equation} \boldsymbol{k}\boldsymbol{\cdot} \boldsymbol{\tilde{v}}=\textrm{i}h\quad \text{and} \quad \tilde{p}\boldsymbol{k}+\tilde{\varPi} \boldsymbol{\cdot} \boldsymbol{k}=\boldsymbol{0}{,} \end{equation}
where from (2.5a,b $_1$)
 \begin{equation} \tilde{\boldsymbol{\varPi }}=\textrm{i}Kn\left(\tilde{\boldsymbol{v}}{\boldsymbol{k}}+\boldsymbol{k}\tilde{\boldsymbol{v}}- \tfrac{2}{3}\left( \boldsymbol{k}\boldsymbol{\cdot} \boldsymbol{\tilde{v}}\right) \boldsymbol{I}\right) {.} \end{equation}
 \begin{equation} \tilde{v}=\textrm{i}h\frac{\boldsymbol{k}}{|k|^{2}},\quad \tilde{\boldsymbol{\varPi}}={-}2Knh\left( \frac{\boldsymbol{kk}}{|k|^{2}}- \frac{1}{3}\boldsymbol{I}\right), \quad \tilde{p}=\frac{4}{3}Knh.\end{equation}
Finally, taking the inverse Fourier transformation of (A5) yields
 \begin{equation} \left.\begin{gathered} \boldsymbol{v} =\textrm{i}h\mathcal{F}^{{-}1}\left[ \frac{\boldsymbol{k}}{|k|^{2}}\right] = \frac{h}{4{\rm \pi} }\frac{\boldsymbol{r}}{|r|^{3}}, \quad p = 0,\quad \text{and} \\ {\boldsymbol{\varPi} } ={-}2Knh\mathcal{F}^{{-}1}\left[ \frac{\boldsymbol{kk}}{|k|^{2}}- \frac{1}{3}\boldsymbol{I}\right] =\frac{3Knh}{2{\rm \pi} }\frac{1}{|r|^{5}}\left[ \boldsymbol{rr}-\frac{1}{3}|r|^{2} \boldsymbol{I}\right]{.} \end{gathered}\right\} \end{equation}
Here, we have used the following inverse Fourier transformation identities:
 \begin{equation} \mathcal{F}^{{-}1}\left[ \frac{\boldsymbol{k}}{|k|^{2}}\right] ={-}\frac{\textrm{i}}{4{\rm \pi} } \frac{\boldsymbol{r}}{|r|^{3}}\quad \text{and}\quad \mathcal{F}^{{-}1}\left[ \frac{\boldsymbol{kk}}{|k|^{2}}\right] ={-}\frac{3}{4{\rm \pi} }\left[ \frac{\boldsymbol{rr}}{|r|^{5}}-\frac{1}{3|r|^{3}}\boldsymbol{I}\right] {.} \end{equation}
Appendix B. Phenomenological coefficients in the boundary conditions
The numerical coefficients appearing in the phenomenological boundary conditions are based on Sone (Reference Sone2007), where these were obtained by an asymptotic expansion of the LBE for  $Kn\rightarrow 0$. The coefficients
 $\eta _{ij}$ appearing in (4.4a–c) can be directly compared with Sone (Reference Sone2007), as
 \begin{gather} \eta _{11} ={-}\frac{4\sqrt{{\rm \pi} }d_{1}}{4C_{4}^{{\ast} }d_{1}+5{\gamma}_{2}d_{4}^{{\ast} }}, \quad\eta _{12}=\frac{5\sqrt{\rm \pi}\gamma_{2}d_{4}^{{\ast} }}{4C_{4}^{{\ast} }d_{1}+5\gamma_{2}d_{4}^{{\ast} 2}} \end{gather}
 \begin{gather}\eta _{12} ={-}\frac{25\sqrt{{\rm \pi} }{\gamma}_{2}^{2}d_{4}^{{\ast} 2}}{ 16C_{4}^{{\ast} }d_{1}^{2}+20{\gamma}_{2}d_{1}d_{4}^{{\ast} 2}}\quad \text{and} \quad\tau _{0}=\frac{5\sqrt{{\rm \pi} } \gamma_{2}}{8d_{1}}. \end{gather}
Here, the values of  $\gamma _{1}$,
 $\gamma _{2}$,
 $d_{1}$,
 $d_{4}^{\ast }$ and
 $C_{4}^{\ast }$ for a hard-sphere gas (HS) and for the Bhatnagar–Gross–Krook (BGK) model are given in table 1.
The values of  $\gamma _{1}$,
 $\gamma _{2}$,
 $d_{1}$,
 $d_{4}^{\ast }$ and
 $C_{4}^{\ast }$ for a hard-sphere gas (HS) and for the BGK model. Data taken from Sone (Reference Sone2007).

Appendix C. Analytic solutions obtained from fundamental solutions
The analytic solutions (6.1a–e) for an evaporating spherical droplet can also be obtained from the fundamental solutions (3.7a)–(3.7c). Owing to the spherical symmetry let us place one singular mass source of strength  $h$ and a heat source of strength
 $g$ at the origin. Let
 $\boldsymbol {r}=r\{ \cos \phi \sin \theta ,\sin \phi \sin \theta ,\cos \theta \}$ be an arbitrary point outside the droplet (
 $r\geqslant 1$). From (3.7) and (3.8) we get
 \begin{equation} \boldsymbol{v}\left( \boldsymbol{r}\right) \boldsymbol{\cdot} \boldsymbol{n}=\frac{h}{4{\rm \pi} r^{2}} {, }\quad p\left( \boldsymbol{r}\right) =0{, }\quad \boldsymbol{n}\boldsymbol{\cdot} \sigma \left( \boldsymbol{r}\right) \boldsymbol{\cdot} \boldsymbol{n=}\frac{Kn\left( h+\alpha _{0} gKn\right) }{{\rm \pi} r^{3}} \end{equation}
and
 \begin{equation} T\left( \boldsymbol{r}\right) =\frac{{Pr }}{{c_{p}}}\frac{g}{4{\rm \pi} r}{, }\quad \boldsymbol{q}\left( \boldsymbol{r}\right) \boldsymbol{\cdot} \boldsymbol{n}=\frac{Kng}{4{\rm \pi} r^{2}} \end{equation}
Comparing (C1) and (C2) with (6.1a–e), one finds  $c_{1}=h/4{\rm \pi}$ and
 $c_{2}=Kn g/4{\rm \pi}$.