1. INTRODUCTION
The tracking of animals is vital to our understanding of the natural world. Traditionally, the study of wildlife has been, to a large extent, the remit of biological research with the pure objective of furthering mankind's knowledge. However, there is growing interest in the commercial sector as we have become more aware of how the actions of human society impact nature. Whatever technique is employed for tracking animals there are a few considerations that tend to present technical challenges:
• Weight/Size
• Packaging for particular environment
• Data retrieval
• Accuracy
• Duration
These challenges could be tackled individually but the key to animal tracking is achieving an appropriate balance for the application/species in question. For example, a device to be deployed on a pigeon for a week is likely to be far smaller than that deployed on a blue whale. The device on the whale, however, is likely to have a requirement to last for many months only taking positions every few minutes/hours. So, there is a wide diversity of potential requirements that depend on the individual research being carried out.
The work described in this paper was developed for NAVSYS' TrackTag technology. The TrackTag system is based on the TIDGET technology patented by NAVSYS (Brown and Sturza, Reference Brown and Sturza2003). The aim of TrackTag is to offer the market a very small tag that can tell the user where it has been – anywhere on the planet. It does this by recording a very short (typically 24 ms) snapshot of GPS data and storing those samples in memory without any processing. The samples are downloaded into a PC file and can then be processed by NAVSYS to find out where the tag had been. The fundamental difference between TrackTag technology and other GPS tags is that no signal processing is done on the tag itself. This post-processing technique allows for an extremely small size and low-power design which should be a major benefit to certain applications. The limitations of this approach are that the snapshots of data taken are very short, in terms of time, and there is no real-time logic capable of making the decision to take longer or more frequent snapshots. Also, the number of raw bits required is excessively large if considering a communications link to transfer the raw data to a base-station for processing.
The ability of the post-processing algorithms to use such short snapshots is, however, also a key technological advantage TrackTag has over its competitive technologies. All benefits over the competition, i.e. weight, performance and duration, are possible due to the extremely short ON time requirement for a position fix. The ON time requirement is two orders of magnitude below the competition's requirement and this has major implications for battery capacity, in particular, and consequently weight. It also has advantages in harsh environments where a long uninterrupted period of signal reception is not likely.
Some of the work involved in getting the TrackTag tagging technology to work with weak GPS signals is discussed in this paper. It was fortunate that a few studies around the world had agreed to invest in TrackTag, thus enabling this research to utilise close cooperation between the TrackTag signal processing research and its end users. The TrackTag users at this stage included studies looking at Albatross, King Penguin, Seals, Leatherback Turtle and Tapir. Although every one of these animals presented significant challenges for GPS tagging, it was the Tapir tracking that pushed the limits of weak signal detection most, due to their location. Living life under the dense rainforest canopy of the Amazon the Tapir (or any other animal in the area) had never successfully been tracked using GPS-based technology.
2. WEAK GPS SIGNAL DETECTION REVIEW
2.1. Signal Integration
The conventional correlation equations (1) are performed for a number of code phase offsets (code search) and also a number of Doppler bins (Doppler search).
The number of Doppler bins depends on how accurate the receiver's estimate of Doppler offset is. For example, the Doppler error would be small if the receiver had detected signals a short time before which resulted in a good position fix and could be trusted to update the estimated local oscillator drift as well as the estimated position. Conversely, if the receiver had not been able to calculate a position fix for a long time, the uncertainty in the local oscillator error and positional error would mean more Doppler bins would be required. In addition, if the receiver experiences some velocity due to the animal's movement, that will translate to apparent Doppler shift. The magnitude of this additional Doppler shift depends on both the direction and magnitude of the animal's velocity as well as the geometry of satellites at that instant.
The number of code phases can vary depending on the algorithm used. If a signal had been tracked a short time previously and the time elapsed since that measurement is accurate and the position has not changed significantly, an estimate of the expected code phase can be made. Some algorithms will perform an expanding code phase search starting at this estimate and moving out in time until a signal is found. Where this estimate is not practical the algorithm will search across all possible code phases, effectively performing a convolution.
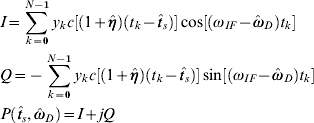
where:
N:No. of samples
y k:Sample input
c(t): C/A PRN code
 :Chipping rate perturbation due to Doppler
- :Code phase estimate
ωIF:Intermediate Frequency used in front-end mixer
- :Doppler estimate
 :Chipping rate perturbation due to Doppler
 :Code phase estimate
 :Doppler estimate
2.2. Block Accumulation
A common approach to performing the correlations on the data is to split the data into a series of blocks (Psiaki, Reference Psiaki2001). Instead of processing the data as a whole, the integration is arranged into several blocks and are correlated with their results are averaged to give an equivalent result. Equation (2) shows how the algorithm can be re-arranged in order to have integration done in ℓ blocks of length N. This assumes that  and that
 is a sampled version of the signal's PRN code.
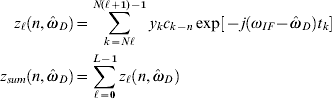
Averaging the blocks can be done in a number of ways. A complete, single block over which the correlation is performed would be expressed using Equation (2) with both L and N equal to the number of samples in entire data snapshot, which are then averaged to give the correlation power for the complete data. If applied to the full length of a data snapshot, it does of course carry the high risk of data bit transitions cancelling out the correlation power.
At the other extreme, the block length could be made equal in length to the BPSK code period (1 ms). This would mean L would equal the number of milliseconds to integrate over. Summing all block correlations is then mathematically equivalent to the full correlation. It does, however, offer a more efficient way to do the correlations and also opens up opportunities for migrating data bit transitions as discussed next.
2.3. Non-Coherent Data Bit Inversion Mitigation
The major challenge with long integration in GPS is that of the signal's data bit transitions. Although not shown in the equation above, the signal is modulating 50 Hz data and therefore the BPSK code could invert at 20 ms intervals. An inversion part way through the correlation will attenuate the result. It would, in fact, completely cancel out any correlation power if it were to occur exactly halfway through the correlation due to each side of the inversion giving equal power but with opposite polarities.
One way to handle the data bit inversions is to square the correlations before they are added. This serves to lose the data inversions as each polarity will end up being positive having been squared. Known as non-coherent integration due to the phase information being lost through squaring, its use is widespread in GPS. The problem with using non-coherent integration is the Squaring-Loss that is encountered. Where coherent integration would offer an improvement of 3 dB for every doubling of the integration length, non-coherent integration will offer only 1·5 dB (Strassle et al, Reference Strassle, Mathis and Burgi2007).
A new technique using a different squaring method in a non-coherent integration has been developed (Rodriguez et al, Reference Rodriguez, Pany and Eissfeller2005). This appears to offer around 2 dB gain overall in the non-coherent processing. However, the technique experiences significant problems when used on signals with even a minor Doppler error. Due to the fact that the TrackTag algorithms are constantly having to estimate Doppler on all signals this technique was discarded for use in the TrackTag research at an early stage. The majority of signal acquisition attempts were assumed to have a large Doppler error, especially where non-coherent processing would be used, i.e. as the first step to acquisition. If the Doppler is known, coherent integration was considered the best way to detect weak signals.
2.4. Multiple Data Bit Coherent Integration
The biggest challenge when integrating coherently is that of the data bit transitions. There are twenty 1 ms code epochs in each GPS BPSK data bit (Dedes, Reference Dedes and 2005). This means that any integration that overlaps one of these code epochs will be severely affected. One way to counter this problem is to reverse all the data transitions. This, however, would require knowledge of the data stream as well as very accurate time of transmission in order to synchronize to the correct point in the data. There has been some work on algorithms that require no a priori knowledge of the data bits received to enable long coherent integration; this obviously relies on obtaining the full broadcast data-stream for every GPS satellite over the time of interest. This potential Assisted technique was considered outwith the scope of this research.
Non-assisted GPS coherent integration is often limited to 10 ms due to the 20 ms code epochs (Zheng, Reference Zheng2005). A period of 10 ms is used so that it can be guaranteed that no data transitions will occur in either the odd or even integration blocks. This approach is very commonly used in GPS receivers by taking multiple “Alternate Half-Bits” (Psiaki, Reference Psiaki2001) and is described by Equation (3). The 10 ms blocks are squared as the polarity between each is unknown. By calculating the odd and even results of such a process and using the set that offers the higher power, significant improvement in SNR can be achieved over pure non-coherent methods.
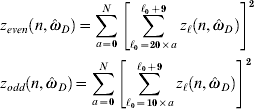
where:
ℓ: Millisecond Block index
z ℓ: Millisecond Block correlation
N: Number of millisecond periods to integrate
There has been research into the use of sliding 20 ms correlation windows that attempt to find a GPS bit edge to enable extended coherent integration (Han, Reference Han2006). The method presented where 1 ms blocks integrations have their polarities successively inverted (twenty times to cover each of the 20 possible millisecond phases) to cater for any bit phase alignment, requires no data in addition to the first 20 ms. This would therefore fit well with the requirements of TrackTag although it does not allow for acquisition of the signal using integration over more than 1 GPS bit (20 ms).
The concept of the BACIX approach (Han, Reference Han2006) was developed during the same period that this research was conducted and has much in common in terms of the general concept. However, the research presented here was done independently and resulted in a subtly different method which has key benefits to the TrackTag system. With TrackTag snapshots being taken on a tag with no processing intelligence for making decisions over snapshot length or frequency, the acquisition algorithm has to make best use of what is offered by the dataset. This means that acquisition should aim to integrate over the entire snapshot where possible.
The BACIX approach suffers from the limitation that only the bit phase is adjusted and therefore it cannot handle anything other than one bit transition. In the TrackTag system the user may decide to compromise battery life in favour of taking snapshots many times the length of normal TrackTag snapshots. This would be done if the user believes the signal environment is going to be very tough for the tag to acquire signals. Under that circumstance, integrating over only the first 20 ms to acquire would mean the longer snapshots offer no benefit. Integration over multiple GPS bits is a definite requirement to the success of TrackTag's weak signal detection capability. It is therefore considered a primary objective of this research as it was assumed that minimising the signal detection threshold as far as possible would be a pre-requisite to weak signal tracking on animals in harsh environments.
3. CROSS-CORRELATION
As the noise floor is pushed down the effect of cross-correlation has to be considered. Cross-correlation is the term often used to describe the process whereby the incoming signal is cross-correlated against the expected gold-code in order to de-modulate the signal – the basic GPS signal detection process. In this discussion, however, cross-correlation is assumed to describe the unwelcome effect of gold-codes correlating well enough against others to cause problems.
Although the BPSK sequences selected for the gold-codes have been chosen to be orthogonal and therefore minimise cross-correlation properties, they are not perfect. The effect is that a strong signal can also show up as a weak signal while looking for a completely different signal, i.e. using a different gold-code. There has been some research into the cross-correlation properties of GPS signals (Parkinson et al, Reference Parkinson and Spilker1996) which suggest the worst case cross-correlation peaks relative to the source signal strength. The worst case is a cross-correlation peak at −21·6 dB down from the strong signal peak.
3.1. Cross-correlation Impact
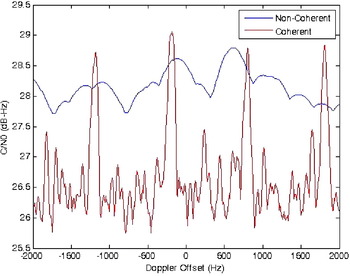
Many examples of cross-correlation have been found in the TrackTag datasets. An example of cross-correlation interference on a signal taken under the Amazon Rainforest where there was a strong signal present with a power of just over 51 dB-Hz (PRN-22) is shown in Figure 1. It shows the cross-correlation effect on weak signals in the same snapshot of data. The plot is the result of attempting to track a signal expected from an SV (PRN-1) that was behind the Earth at that time and therefore definitely not visible. While the noise floor was close to the expected value when using non-coherent processing, when pushing the noise floor down further, by employing coherent integration, sporadic peaks are seen around 29 dB-Hz well above the expected coherent noise floor.
Cross-correlation on PRN-1 from PRN-22.

The worst case scenario of having cross-correlation −21·6 dB below the level of the strong signal means that the example above, with a strong signal of around 51 dB-Hz, should exhibit cross-correlation peaks no higher than 29·4 dB-Hz. It seems to match what has been observed in practice. This effect should therefore always be considered while analysing weak signals and care must be taken to ensure there are no strong signals present that would give erroneous measurements for the signal you are actually looking for.
In the TrackTag processing a dynamic signal detection threshold is adjusted depending on the highest signal power detected. Although the threshold is set depending on the integration type and length, this can be over-ruled if there is a strong enough signal detected that would require the detection threshold to be raised to prevent false-locking on to cross-correlation products.
4. NON-COHERENT INTEGRATION
The processing for TrackTag performs 1 ms convolutions. Each convolution is the vector result from performing correlations following the detail provided in Equation (2) for very possible sample offset, n. The maximum value of n therefore equals the number of samples there are per millisecond.
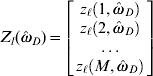
Equation (4) shows the relationship between the correlations, zℓ, and convolutions, Zl. For a snapshot of, say, 24 ms data using 5 MHz sampling would result in a 5,000 element vector for each millisecond. Zl would be calculated for l=1,2 . . 24.
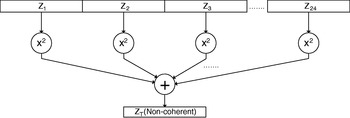
When integrating all milliseconds together non-coherently, each convolution element is squared before being summed with corresponding samples from neighbouring millisecond convolutions. Figure 2 illustrates how the millisecond convolutions are accumulated using a non-coherent technique. Non-coherent implies that the integration does not keep track of phase between milliseconds. The convolutions are squared; in fact they are multiplied by their complex conjugate and therefore lose their phase information. This method is therefore not affected by data bit inversions. The end result is a vector ZT which has been integrated in an effort to resolve the noise level.
Non-Coherent Integration.

The bandwidth of the output signal is related to the length of coherent integration. In the non-coherent case there are multiple 1 ms long blocks of coherent integration and therefore the bandwidth of the non-coherent accumulation remains constant at 1 kHz.
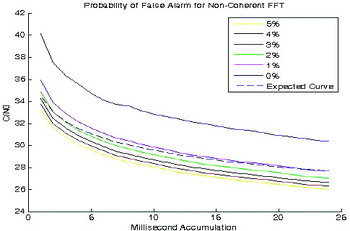
There should be a drop of 1·5 dB per octave in the noise floor with non-coherent integration. Sample data was acquired by obscuring the system's antenna in order to measure the noise level. Figure 3 shows how the noise floor drops as longer accumulation times are taken for a Probability of False Alarm (PFA) of 1 to 5%. The expected curve is also superimposed (at an arbitrary level) to show what −1·5 dB/octave looks like. All curves follow close to this.
Non-Coherent PFA C/N0.

5. COHERENT INTEGRATION
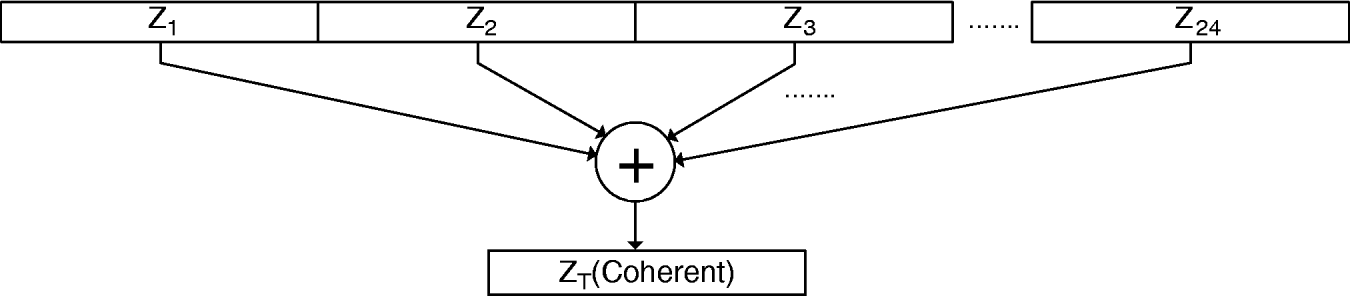
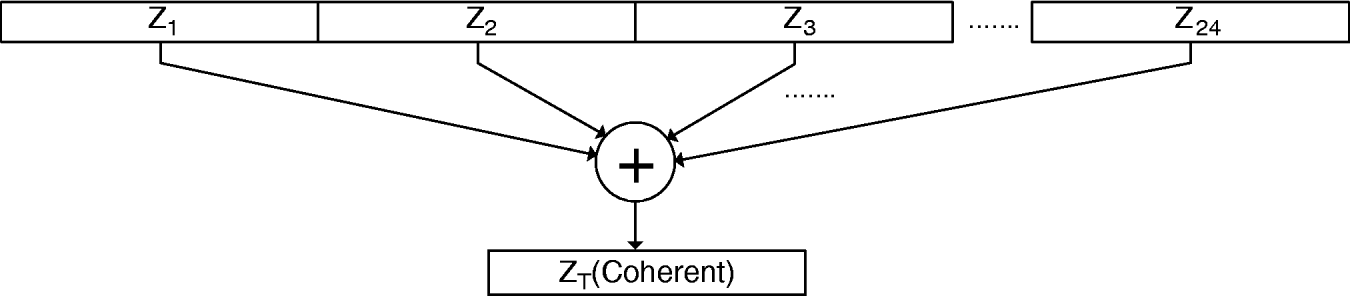
When integrating coherently, each millisecond convolution vector result is simply added to the others (without squaring). Figure 4 illustrates how the millisecond correlations are accumulated using a coherent technique. Coherent implies that the integrations keep track of phase between milliseconds. This relies on phase being continuous throughout all milliseconds used. This method is therefore affected by any data bit inversions as they invert the signal phase by 180° in BPSK.
Coherent Integration.
As the navigation data superimposed on the BPSK carrier is at 50 b/s, data bit inversions can occur at 20 ms intervals. Another potential issue is code-phase alignment with coherent integration. If a data bit transition occurs at some point in the middle of the 5000-point convolution, the signal power will be affected. For example, if a data bit edge occurs halfway through the millisecond being correlated, half the signal will be in-phase while the other half will be exactly out of phase therefore cancelling out and leaving zero signal power, even with a very strong signal!
These issues combined mean that coherent processing is always best done when the correct code-phase is used to index into the incoming data in order to force any data bit transitions to either end of the convolution thus minimizing any power loss due to fractional millisecond integration. This makes bit-edge detection (if required) easier due to the expected phase shift encountered at a bit transition being 180° with no intermediate points.
Estimating the code-phase of a signal before it has been processed cannot be done for the first signal to be detected in a given snapshot as the exact sub-millisecond offset the signal experiences is unknown (it is of course the very measurement the system is trying to make!). However, once a signal has been detected and the code-phase for that signal is measured, the code-phase for every other potential signal can be estimated based on assumed time and position. This was done during the research.
So, assuming code-phase is known, the algorithms would index into the data by the relevant number of samples (which will be different for each SV) and so the correlation peaks are then expected to occur close to the code's rollover point, i.e. sample 1.
The data bits will also be unknown and so the resulting polarity reversal will have a hugely negative effect on the observed signal strength. This is a major topic in many weak signal GPS applications. Designers often use mobile phone technology (Park et al, Reference Park, Jeongbok, Jaeseung and Yonserk2005) to aid acquisition of the GPS signals. Data Aiding whereby the actual GPS data bits are received from another source, can be used if time is known accurately enough; the data bit transitions can be applied to the incoming signal to aid coherent correlation. This option was not available to TrackTag at the time of this research.
Another option that is found in some texts (e.g. Lachapelle, Reference Lachapelle2004) on GPS is to integrate over two successive 10 ms windows. This means that you are guaranteed to have one 10 ms block free of a bit transition. This was actually implemented for some time during this research work and worked fairly well. The problem with it is that it limits the integration to 10 ms. 24 ms snapshots have been used almost exclusively thus far but it is anticipated that longer snapshots will be used in the future to provide additional sensitivity in weak signal environments. The two 10 ms integration window technique would not be able to make use of longer snapshots and, of course, there was also the potential to more than double the integration length even when limited to 24 ms.
Another issue with coherent integration is the fact that the length of coherent integration affects the processing bandwidth. With the non-coherent processing discussed earlier, the bandwidth was effectively fixed and had nulls at offsets of ±1 kHz due to the integration length always being 1 ms. With coherent processing these nulls, and consequently bandwidth, are pulled in rapidly as the coherent integration length increases. The result of this is that the estimate for Doppler offset has to be more accurate and/or more Doppler bins have to be taken to ensure the signal is not missed.
A new technique has been developed here for the TrackTag algorithm design. The All-Bit-Permutation accumulation technique basically calculates what the signal power would be given all possible bit patterns and selects the pattern with the highest correlation peak.
5.1. All-Bit-Permutation Accumulation Technique
The technique developed here is a novel approach to obtaining coherent integration without knowledge of the data bits. It was necessary to design this new algorithm in order to maximise the integration length over the relatively short snapshot TrackTag takes. With such a short snapshot and no chance of making the decision to re-attempt the processing, it was crucial to aim for full usage of the entire snapshot. Working out all permutations of bit patterns over a certain time interval requires a systematic approach. Not only are the data bit polarities not known, but the data bit phase (in ms) is unknown. This means that there has to be an intermediate accumulation stage as both bit polarity and phase are to be considered.
There are 3 levels of uncertainty of time;
1) BPSK Code-Phase. This is what is detected through measurement, i.e. the signal time-of-reception modulo 1 ms. This is also what is used in the navigation solution equations and works provided the assumed position is not in error by >300 km.
2) Navigation Data Epoch. If the BPSK code-phase is known, the location of the navigation data epoch will be at an integer number of milliseconds away from that and repeats every 20 ms (whether or not it actually results in a data bit inversion).
3) Navigation Data Pattern. If the navigation data were known (as with data-aided systems) the data pattern would be predictable and therefore the bit inversions could be accounted for during the integration.
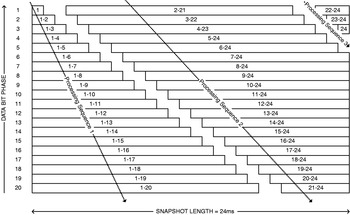
The navigation data bits can be any one of 20 phases due to the navigation data bit rate being 50 Hz and hence a 20 ms period. With TrackTag snapshots being so short (typically 24 ms) most of the bits recorded will actually be partial bits. Figure 5 illustrates how up to 3 bits (whole or partial) can be present in just 24 ms worth of usable snapshot.
Possible Bit-Snapshot Alignment.

If a data bit transition occurs exactly halfway through the 24 ms snapshot, no complete data bit will be present. Just as for correlation of 1 ms with a data bit inversion halfway through, an inversion halfway through a snapshot would give a signal power of zero even for a strong signal as both halves cancel out. The algorithm therefore has to calculate results for any possible bit phase. This means the first bit transition can occur anywhere between the 1st and 21st millisecond. If there are two transitions, the second would occur anywhere between the 22nd and 24th milliseconds. There would be 20 possible bit phases, every one of which would have to be attempted.
All of this assumes that the data has been indexed into in such a way that code-phase is near zero. With data bit epochs always occurring at zero code-phase, there should never be a bit transition within a (1 ms) convolution. This indexing means that we lose a little snapshot length as the data is basically truncated at the start to line up with millisecond boundaries.
An intermediate accumulation matrix is constructed of size 20∗(No. of possible bits)∗5000 (5000 samples/per millisecond as the data is sampled at 5 MHz). The number of possible bits depends on the snapshot length, i.e. a 24 ms snapshot could have 3 bits as seen previously. The other values refer to the number of bit phases possible (20) and the correlation length in samples (5000).
The objective for the coherent integration is to provide the 5000 element vector that will subsequently be used in the peak detection stage to determine whether (and where) a signal occurs. The intermediate accumulation matrix therefore holds a set of 5000 element vectors. With a 24 ms snapshot, there are potentially 3 (full or partial) bits present. There are 20 potential 5000 element vectors the first bit could take, depending on the length of that first bit as it could be anything between 1 and 20 ms long. The second bit vectors are calculated as being accumulated values assuming that second bit is positioned between 2–21 ms, 3–22 … .or 21–24 ms. Of course it is limited to the absolute length of the snapshot. The third bit's potential accumulator values are also calculated. This partial accumulation is described by Figure 6 and Equation (5).
Partial accumulations.

The intermediate matrix is generated in order to lessen the computational burden. It aims to minimize redundant calculation as described in Figure 6. The fact that accumulations are calculated sequentially by only adding to or subtracting from the previous result means there are no long summations to be performed and every vector addition and/or subtraction stage results in a required accumulator result. The accumulations for each bit (or partial bit) are calculated for all possible bit phases. This is done by adding only 1 millisecond (5000 complex numbers) at a time while storing the resulting accumulation for each data bit phase as shown as Processing Sequence 1. The next sequence runs through adding the next millisecond until it hits the end of the snapshot. However, it also starts to subtract milliseconds from the lower end when the effective accumulation length is equal to the GPS data bit period (20 ms). So, the outcome of performing this partial accumulation is a 20∗3∗5000 complex number matrix. It effectively provides the convolution results for all 20 possible bit phases.
If the convolution output vector for each 1 ms is zl (where l is the millisecond index), the next step is to multiply the partial accumulation matrix by a matrix with half of all possible bit patterns (half of the possible bit patterns are used as the other half is simply the inverse polarity and will provide the same result only inverted). Equation (5) shows the mathematical description of how the partial accumulations are used, together with the possible bit patterns, in order to generate a matrix containing vectors representing every permutation of accumulation possible.
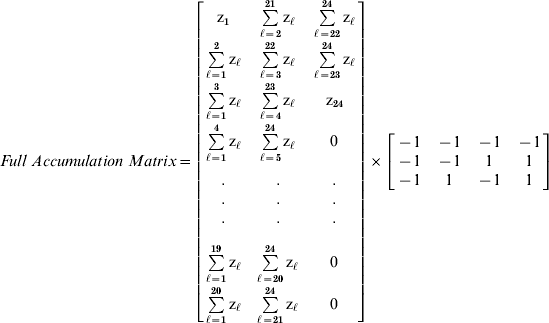
For the 24 ms case, the resultant matrix is 20∗4∗5000. This relates to 20 possible data bit phases, 4 possible bit patterns (23/2) and the 5000 samples. The highest value found in the entire matrix will indicate what the bit pattern and phase is as well as the code-phase of the signal. This is a fairly intensive number-crunching exercise and it should be noted that it must be performed for all Doppler bins required so minimising the uncertainty in the front-end oscillator offset and Satellite Doppler estimate is very important.
5.2. Coherent Carrier-to-Noise (C/N0) Calculation
The coherent integration sums the millisecond result without squaring. Any signal present will grow linearly with accumulation time as with the non-coherent case. The noise, however, tends to self-cancel. The trend for noise is observed to rise only with the square-root of accumulation length. Equation (6) is for calculating C/N0 when using coherent integration:

Where
β: Bandwidth
P s: Signal Power
N 0: Noise Power
A cc: Accumulation length (ms)
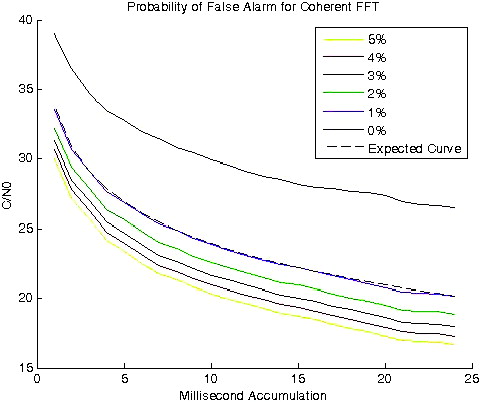
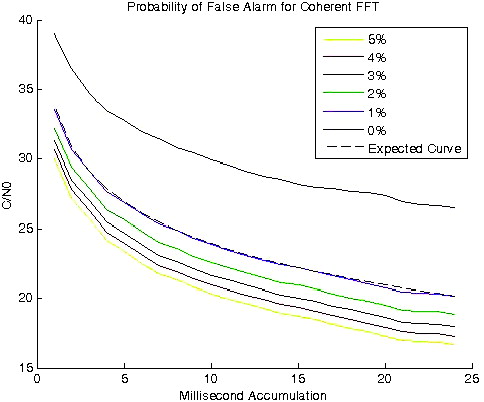
Sample data was acquired by obscuring the system's antenna in order to measure the noise level. Figure 7 shows how the noise floor drops as longer accumulation times are taken for PFA's of 1–5%. The expected curve is superimposed (at an arbitrary level) to show what −3 dB/octave looks like. All curves follow close to this. As expected, we see a drop of 3 dB per octave in the noise floor with coherent integration. This improvement over the non-coherent process is due to the fact that the noise does not grow as fast as a signal, it self-cancels.
Coherent PFA C/N0.
6. COHERENT & NON-COHERENT INTEGRATION BANDWIDTH
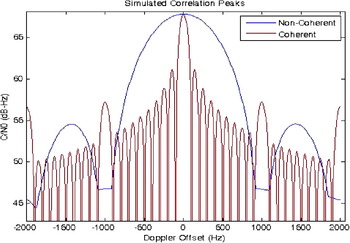
Figure 8 shows the expected sinc2 function (Parkinson et al, Reference Parkinson and Spilker1996) for both methods using a simulated waveform with no noise. The non-coherent and coherent (over 10 ms in this simulation) methods show their null locations at 100 Hz and 1 kHz respectively. This is also in line with theory. This highlights the need for accurate Doppler frequency estimation before a 76 ms integration is performed as, at that integration length, the nulls of the signal to be detected will occur at around 13 Hz from the centre.
Comparison between Coherent and Non-Coherent Bandwidth.

7. EXTENDED SNAPSHOT INTEGRATION
The research on weak signal detection up to this point used the standard TrackTag snapshot length of 24 ms. This was sufficient to demonstrate the performance advantages of coherent integration and the basic functionality of the All Bit Permutation technique developed to enable long coherent integration. However, the performance of the technique could only be realised with integrations spanning multiple GPS data bits.
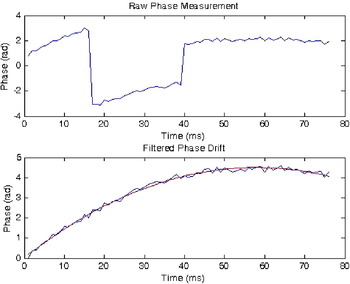
A 76 ms snapshot known to have a strong signal was used to produce the phase plots shown in Figure 9. The top plot shows the raw measurement acquired by taking the ratio of I and Q correlator outputs for each millisecond. The 2π measurement roll-over and π shift due to a bit transition were then removed in order to produce the observed phase drift shown in the lower plot. This level of phase drift is intolerable when trying to decipher BPSK. Also, the All-Bit-Permutation technique discussed in this paper will not work as planned due to the phase varying even without any bit transitions.
Raw and filtered phase drift.

The method for eliminating the phase drift is to firstly measure the drift and then apply an appropriate level of inverse phase on each millisecond in order to cancel-out the drift. This has to be done on the signal at the input to the correlation process as it is re-calculated. Of course, if the system holds the I and Q outputs for every millisecond for every signal at every Doppler Bin, the correction could be applied to those I and Q values.
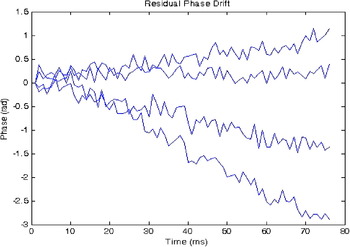
The inverse phase is therefore stored as a Look-Up-Table (LUT) to be applied to the subsequent signals. To show that this is a drift that is common to all satellite signals, three other satellite signals were processed using the same phase LUT. Figure 10 demonstrates that, with the phase correction in place, the resultant phase drift is linear. The corrected phase for the original signal (used to generate the phase LUT) is seen as the flat line. The other lines are for three other strong signals. The reason they have a slope is because their estimated frequency is slightly in error. The slope at this point can be used to improve the frequency estimate using the fact that phase is the integral of frequency.
Residual phase drift after Look-Up-Table correction.

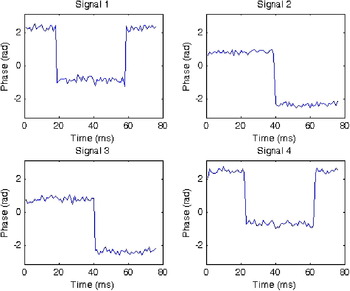
Once the frequencies were updated, the four signals' corrected phase could be plotted in Figure 11. With the phase correction the proposed All-Bit-Permutation long integration technique can be utilised. The corrected phase now follows the expected two discrete values with bit transitions 20 ms apart in each case.
Corrected phase on raw data.

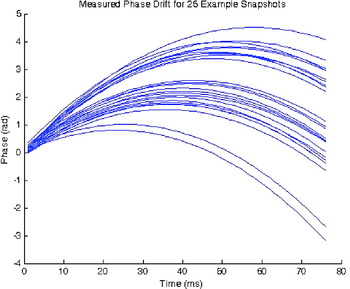
Twenty five snapshots, all with strong signals were taken and their correction phase LUTs calculated for comparison. These are shown in Figure 12. They may appear to be quite different but are, in fact, a very similar parabola only shifted depending on which Doppler Bin offered the highest power. The Doppler Bin with the highest power will be the best compromise frequency over the full snapshot and so, on average, should appear centred, at 37 ms in this case. The maximum point on these parabolas indicates at which point within the snapshot the actual frequency matches the frequency estimated by Doppler Bins. In these 25 example snapshots that point is often centred but can be as much as 20 ms either side.
Generated phase LUT for 25 snapshots.

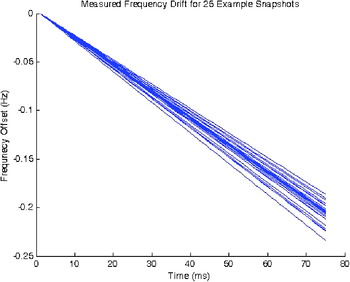
Figure 13 shows the derivative of the assumed phase LUTs (i.e. the frequency shift) over 25 snapshots. They are also normalised to start at zero in order to remove the effect of Doppler Bins estimation of the frequency having an error due to the very frequency drift we are looking for. The frequency shifts are all very linear and of approximately the same magnitude. It shows that the phase drift can be attributed to a small shift in frequency over the 76 ms. As discussed previously, this is due to the oscillator not having enough time to stabilise properly before the signal is recorded. It may appear to be a backward method for measuring frequency drift, but due to measurement inaccuracies involved the frequency of each 1 ms cannot be measured with the precision required to observe the 0·2 Hz shift over 76 ms.
Derivative of generated phase LUT for 25 snapshots.

8. TRIAL RESULTS
The TrackTag processing algorithms were adapted to perform 76 ms integrations. This involved implementation of the All-Bit-Permutation integration technique along with the phase drift mitigation as discussed in this paper. 400 snapshots of data were collected in a forest environment, at a fixed location, in order to compare the performance of the system when using the following three different integration lengths:
• 10 ms: To replicate common conventional acquisition whereby two blocks of 10 ms coherent integrations are calculated and the one giving highest power is used.
• 20 ms: To replicate the BACIX technique (Han, Reference Han2006) for coherent integration over one potential data bit transition.
• 76 ms: The maximum possible integration length possible while using TrackTag without making changes to the hardware.
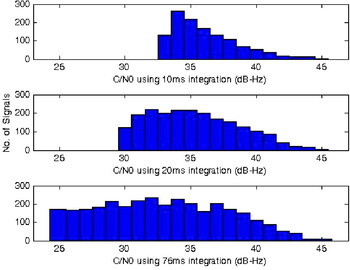
Figure 14 shows how additional signals are acquired through extending the integration length. The total number of signals detected over the 400 snapshots was 1228, 2100 and 3182 for the 10, 20 and 76 ms integration lengths respectively. This increase is achieved due to the ability to lower the detection threshold and this is also seen in the plot as the detection threshold falls from 33 to 30 dB-Hz between 10 and 20 ms integrations. The detection threshold for 76 ms integration looks close to the expected 24 dB-Hz although some signals at that level may have been discarded due to them being potentially cross-correlation artefacts from a strong signal. It is also worth noting that the benefit of moving to an integration length of over 76 ms may be negligible due to those signals being unusable due to the possibility of them being a cross-correlation product from a strong signal.
Forest data – signal strength.

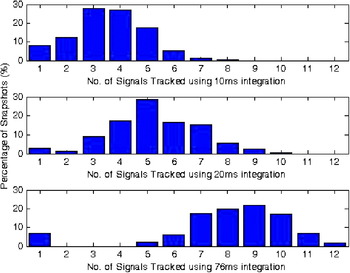
The result of having far more signals available overall is, of course, an increase in the number of signals detected for individual snapshots. The statistical distribution of the number of signals detected is shown in Figure 15.
No of signals detected.

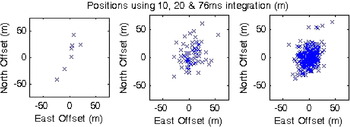
The minimal number of observed signals required to make a 3D position fix is four. However, the position calculation also depends on the Dilution Of Precision (DOP) which is related to the satellite geometry. For example, having the required four signals all coming from four satellites in close proximity to each other would offer a poor geometry, whereas four satellites spread evenly around the sky would offer better geometry and a good DOP. The more signals that are present, the more likely it will be that the overall DOP is good. The data presented illustrates that the numbers of observables rises dramatically from an average of around 3·5 to an average of 9 when moving from 10 to 76 ms integration. This makes a big difference to the navigation fixes calculated as seen in Figure 16. The overall number of 3D positions calculated is 7, 64 and 317 for the respective integration lengths.
Forest data – positions.

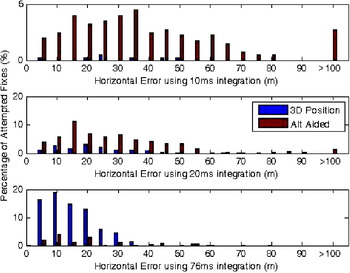
The accuracy of the positions is also an important factor. Figure 17 shows the distribution of horizontal error for both 3D solutions and 2D (altitude-aided) solutions. It is clear that as well as offering a far higher percentage of successful position calculations, the 76 ms integration improves the accuracy of the position fixes.
Forest data – position error.

9. SUMMARY
The results have shown that increasing the integration length to 76 ms provides significant performance improvement in the ability of the system to provide accurate position fixes in partially obscured environment – a forest in particular. This is of great significance to GPS systems, such as animal tags, where the environments in which the system is likely to be deployed has poor GPS reception.
The exhaustive processing approach to integration of all possible permutations of the received bit pattern and its bit-phase was proven to work. The additional requirement to correct for oscillator drift was necessary in order to make the phase integration work optimally without the need for additional delays to enable the oscillator to stabilise following its sleep mode. In an application so sensitive to power consumption as long-duration animal tags, everything must to done to minimise the power in order to maximise the battery life.
Following this study TrackTag™ has been successfully deployed in the Amazon and is considered to be the first GPS tag to operate under the Amazon Rainforest canopy (Tobler, Reference Tobler2008).