





The authors regret the inclusion of an error in the above article.
The numbers of controls and, consequently, the total sample sizes were incorrectly reported in the main article, although the corresponding numbers in Supplementary Table S4 were correct. The reported numbers of cases were correct and remained unchanged.
The correct female-specific GWAS meta-analysis included 85,042 cases and 142,038 controls (N = 227,080), and the correct male-specific meta-analysis included 36,732 cases and 124,011 controls (N = 160,743). The overall meta-analysis therefore included 387,823 participants, comprising 121,774 cases and 266,049 controls.
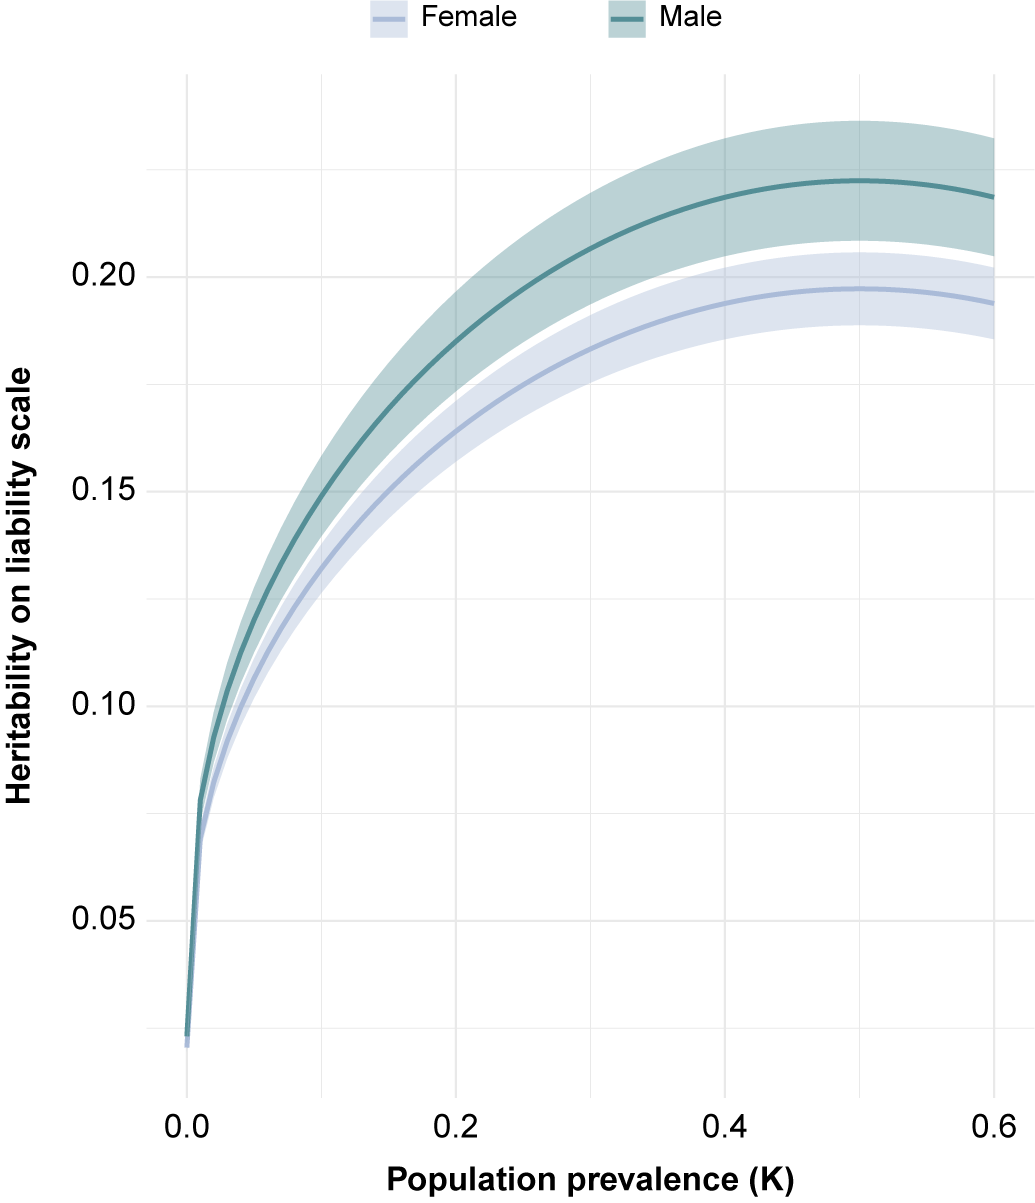
The GWAS analyses were conducted using the correct samples, and all downstream analyses based on the resulting summary statistics are therefore unaffected. However, the incorrect control numbers were used to calculate the sample proportions for the liability-scale heritability analysis. This analysis has therefore been recalculated using the correct sample prevalence. When assuming the same population prevalence for both sexes, liability-scale heritability was significantly higher in males (Z = 3.02, P = 2.5 × 10⁻³), rather than the previously reported Z = 1.77, P = 0.076. When assuming population prevalences of 0.30 in females and 0.15 in males, liability-scale heritability remained significantly higher in females (Z = 2.05, P = 0.040), compared with the previously reported (Z = 3.40, P = 6.8 × 10⁻⁴). An updated version of Figure 3B is included below. These corrections are consistent with the interpretation presented in the discussion and do not affect the overall conclusions of the study.

Figure 3B. Long description
The x-axis is labeled Population prevalence (K) with a scale from 0.0 to 0.6. The y-axis is labeled Heritability on liability scale with a scale from 0.05 to 0.20. Two curved lines with shaded confidence intervals represent the data.
* The Male line (teal) starts at approximately 0.02 heritability at 0.0 prevalence, rises steeply to 0.20 heritability at 0.3 prevalence, and peaks at approximately 0.22 heritability around 0.5 prevalence before slightly dipping.
* The Female line (light blue) follows a similar trajectory but remains consistently lower than the male line. It starts near 0.02, reaches 0.15 heritability at 0.2 prevalence, and peaks at approximately 0.19 heritability around 0.5 prevalence.
Both curves show a concave downward trend, where the rate of increase in heritability slows as population prevalence increases.

 Open access

