Introduction
Over the last 30 years robots have been actively developed in order to automate the harvesting process (Bac et al., Reference Bac, Eldert, Jochen and Edan2014). An agricultural robot must operate in the unstructured and dynamic environment (e.g., changing illumination, clouds), and deal with random and difficult locations of the fruit which are highly variable in size, shape and structure and obstructed by foliage (Edan et al., Reference Edan, Dima, Tamar and Gaines2000). A crucial task in a robotic selective harvester is maturity detection which is fruit dependent and therefore usually requires targeted research and development (Edan, Reference Edan1995). Maturity detection can be a big challenge for fruits like sweet pepper where parts of the fruit are not visible (Bac et al., Reference Bac, Eldert, Jochen and Edan2014) or must be examined from different views (Jachen et al., 2014). Research to date in sweet pepper harvesting focused mostly on fruit detection (Bac et al., Reference Bac, Eldert, Jochen and Edan2014; Kitamura et al., Reference Kitamura, Oka, Ikutomo, Kimura and Taniguchi2008; Kitamura and Oka, Reference Kitamura and Oka2005) with only a few works dealing with maturity evaluation (Jun et al., Reference Jun, Akira, Sakai and Naoshi2012).
Maturity at harvest is the most important factor that determines the fruit quality and storage life (Kader, Reference Kader1999). In order to determine the quality and the maturity level of a fruit or vegetable there are four categories: visual parameters (e.g. color, shape, size), firmness, soluble solids content and titratable acidity (Lorente et al., Reference Lorente, Aleixos, Gómez-Sanchis, Cubero, García-Navarrete and Blasco2012; Mitcham et al., Reference Mitcham, Marita and Adel1996). The visual aspects are commonly used since they can be extracted using machine vision systems by external nondestructive measurements (Brosnan and Sun, Reference Brosnan and Da-Wen2004). Most of the maturity detection research involve color as part of the detection (Bac et al., Reference Bac, Eldert, Jochen and Edan2014; Tantrakansakul and Khaorapapong, Reference Tantrakansakul and Thanate2014; Wang et al., Reference Wang, Hui, Lijuan and Qin2012) since it is an important fruit quality characteristic which represents the degree of maturity, sugar content, acidity and taste (Li et al., Reference Li, Qixin and Feng2009). It is also a main factor in customer’s selection of sweet peppers (Brosnan and Sun, Reference Brosnan and Da-Wen2004; Frank et al., Reference Frank, Nelson, Simonne, Behe and Simonne2001). In other machine vision investigations the morphological features are widely used in addition to the color features or as the main features (Jayas et al., Reference Jayas, Paliwal and Visen2000). Morphological features such as area, perimeter and circularity can by calculated from a binary image that can be derived from the processing of color image (Gomes and Leta, Reference Gomes and Fabiana2012).
In order to fulfill the development of selective harvester fruit maturity must be detected. The goal of this study was to determine the best features to derive the sweet pepper maturity level using machine vision.
Materials and Methods
Dataset
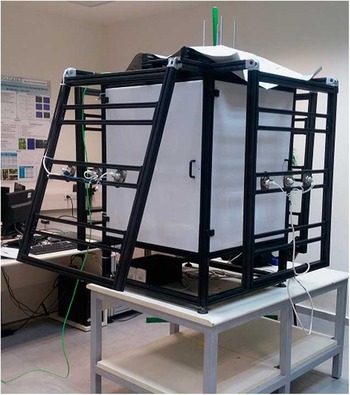
RGB images of 50 red sweet peppers (Cultivar: Banji Seed company: Efal) were acquired in a special designed illumination cubicle (Figure 1), this allowed to ensure that images were acquired under fixed and consistent illumination. The peppers were harvested from the 12th fruit harvesting cycle from a commercial greenhouse in southwest Israel, Camehin.
The illumination cubicle.

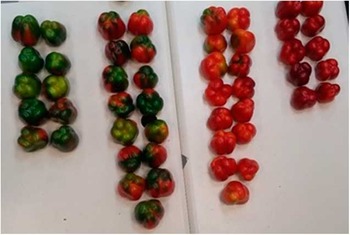
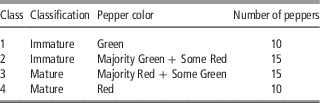
Four maturity classes were selected (Figure 2); classes 3 and 4 defined as the “mature” classes were selected from the packing house, based on visual evaluation of professional pickers; the fruit were harvested the same morning. Class 4 included peppers with mostly red color and class 3 included a mixture of green and red colors (with approximately 80% red). The “immature” classes, classes 1 and 2 were manually selected and harvested from the greenhouse after the commercial harvest. Class 1 included peppers with mostly green color and class 2 included a mixture of green and red colors (with approximately 30% red color, Table 1). Since it is more difficult to differentiate between classes 2 and 3 more peppers were selected from these classes (15 peppers as compared to 10 peppers from each of classes 1 and 4) as show table 1.
The four maturity classes left (class 1) to right (class 4).

Sweet pepper classes

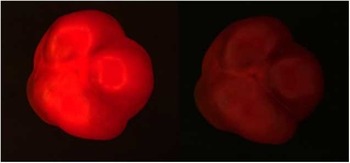
The sides of the special designed illumination cubicle were covered with acrylic glass and the top was covered with a grey non-reflective canvas to create diffused conditions and avoid reflections which caused glare on the fruit (example in Figure 3). Three led spots of 35 watts each were placed outside each of the four sides of the cubicle (Ram et al., Reference Ram, Zeev, Israel and Edan2010). The total illumination inside the photocell was 49 lux. Images were acquired using an IDS MOS, 35.6fps, 1600×1200 resolution RGB camera placed 38 cm above the cell floor which was colored black. Each pepper was photographed from the bottom and side views.
Example of images (a) with glare (b) without glare.

Algorithms
The image processing algorithms were developed in MatLab 2014b using the image processing library. The image processing routines developed included transformation to the HSV color space, segmentation using blob detection algorithm, and features extraction procedures. The segmentation was conducted on the HSV color space using the hue values of 0–35 and 345–360 degrees and saturation values of 240–255. These values were empirically selected. The extracted features are detailed below and included seven color and six morphological features, which were extracted using the binary mask, created by the segmentation algorithm. The bottom view and a random side view were selected for analysis of each pepper.
Color features
Mean – Pepper hue angle average.
Std – Standard deviation of the hue angle of the pepper.
Max value – The maximum hue angle in the pepper.
Min value – The minimum hue angle in the pepper.
Range – The difference between the Max value to the Min value.
Median – The hue values median.
Trimmed mean - Pepper hue angle average after removing the 5% smallest and largest values.
Morphological features
Number of pixels – The number of pixels identified as pepper.
Eccentricity – A scalar that specifies the eccentricity of the ellipse that has the same second-moments as the region. The eccentricity is the ratio of the distance between the foci of the ellipse and its major axis length. The value is between 0 and 1. (Eccentricity is 0 is actually a circle, while 1 is a line segment).
Extent – A scalar that specifies the ratio of pixels in the region to pixels in the total bounding box. Computed as the Area divided by the area of the bounding box.
Solidity – A scalar specifying the proportion of the pixels in the convex hull that are also in the region. Computed as Area/ConvexArea.
Equ2real – A scalar specifying the proportion of the perimeter of a circle with the same area as the region to the perimeter of the region. Computed as (π*EquivDiameter)/Perimeter
Peri2Area – A scalar specifying the proportion of the perimeter to the area of the region. Computed as Area\ Perimeter
Statistical analysis
The extracted data features of the bottom and the side view were recorded, analyzed and compared in Microsoft office Excel. In order to test which features can be used to classify the maturity status of the pepper a non-paired two independent samples t-test was created using R studio 3.2.3.
The two independent samples t-test was created for each of the features for both the bottom and side views in order to check if there is a difference in the feature average between the second and the third classes which are the most difficult to differentiate between; the test hypotheses for each feature were:
 $${\rm H}_{0}\!\! :\mu _{{2{\rm ed}{\vskip1pt\hbox -}{\rm class}}} =\mu _{{3{\rm ed}{\vskip1pt\hbox -}{\rm class}}} {\rm H}_{1}\!\! :\mu _{{2{\rm ed}{\vskip1pt\hbox -}{\rm class}}} \,\ne\,\mu _{{3{\rm ed}{\vskip1pt\hbox -}{\rm class}}} .$$
Results and discussion
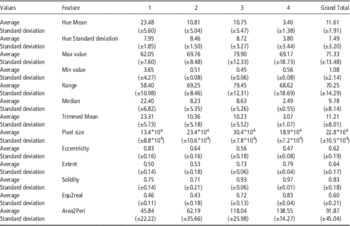
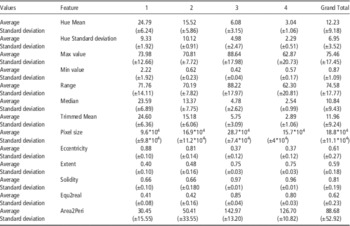
The results of the side view average and standard deviation of each feature within the class and bottom view are detailed in Tables 2 and 3 respectively.
Side view features average and standard deviation per class

Bottom view features average and standard deviation per class

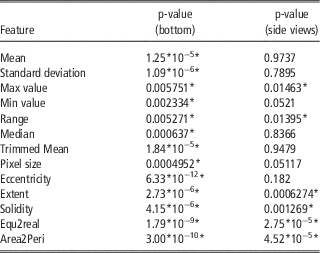
Results analyses indicates that as expected there is a significant difference in most of the features between the first (immature) and the forth (mature) classes and almost every feature can differentiate between them. The challenge is to find the features that will differentiate between the second (not to be harvested) and third (to be harvested) classes. The results of the hypothesis test for the similarity of the averages are detailed in Table 4. For example, the hue mean feature has significant difference in the bottom view (H1) but does not have significant difference in the side view (H0), which corresponds to the results in Tables 2 and 3.
Results of non-paired two independent samples t-test for each one of the extracted features between the second and third class. Results for both bottom and side views

*Indicates the null hypothesis was rejected at the 0.95 certainty level
The results (Table 4) reveal that there are several features with significant difference in the average between the second and the third classes. Considering both bottom and side views ‘Max value’, ‘Range’, ‘Extent’, ‘Solidity’, ‘Equ2real’ and ‘Area2Peri ‘ features can be used for classification between the second and third classes, while all the other features can be used only in the bottom view. From the bottom view all features can be used for differentiation between classes 2 and 3. This corresponds to previous results which indicated that the bottom view was the best viewpoint (Harel et al., Reference Harel, Kurtser, Van Herck, Parmet and Edan2016). The morphological features are obtained in both views and the color features are obtained mostly from the bottom view.
Conclusions
The research results reveals the best features used for classification between four sweet pepper maturity classes focusing on differentiation between classes 2 and 3. These features include both color (‘Hue range’ as the best feature) and morphological (‘Equ2Real’ and ‘Area2Peri’ as the best) features. In the bottom view all of features can be applied. Ongoing research is aimed to use these results to classify the maturity level of the peppers in a robotic harvesting process.
Acknowledgements
This work is supported by the European Union’s Horizon 2020 research and innovation program under Sweeper grant agreement No 644313 and partially supported by the Helmsley Charitable Trust through the Agricultural, Biological and Cognitive Robotics Initiative and the Rabbi W. Gunther Plaut Chair in Manufacturing Engineering, both at Ben-Gurion University of the Negev.