Introduction
During seed imbibition, the quiescent dry seeds rapidly resume metabolic activity, including respiration, which can be measured within a few minutes of hydration (Hourmant and Pradet, Reference Hourmant and Pradet1981). It is not, then, surprising that O2 supply has a major impact on germination, as has been reviewed previously (Al-Ani et al., Reference Al-Ani, Bruzau, Raymond, Saintges, Leblanc and Pradet1985; Corbineau and Côme, Reference Corbineau, Côme, Kigel and Galili1995). Sensitivity of seed germination to oxygen partial pressure (pO2) depends on the species (Corbineau and Côme, Reference Corbineau, Côme, Kigel and Galili1995). Al-Ani et al. (Reference Al-Ani, Bruzau, Raymond, Saintges, Leblanc and Pradet1985) identified two groups of seeds according to their responsiveness to low pO2: seeds with high lipid content (group I) are more sensitive to O2 deprivation than are seeds with high starch content (group II). Sensitivity to O2 has also been expressed in terms of mean germination rates (speed), which had linear relationships with the logarithm of pO2 (Al-Ani et al., Reference Al-Ani, Bruzau, Raymond, Saintges, Leblanc and Pradet1985), and the minimum O2 thresholds calculated by extrapolation of these linear relationships differed among species. Differences in sensitivity to O2 supply observed between carrot (Daucus carota) cultivars (Corbineau et al., Reference Corbineau, Picard, Bonnet and Côme1995) also suggest that there may be a genetic component in this variation. In addition, Finch-Savage et al. (Reference Finch-Savage, Rowse and Dent2005b) demonstrated that sensitivity of Brassica oleracea seeds to O2 deprivation varied among genotypes and segregated with a continuous distribution in a doubled haploid population. In addition, the differences observed between genotypes or seed batches might also result from the conditions of seed production. For example, in both carrot (Corbineau et al., Reference Corbineau, Picard, Bonnet and Côme1995) and B. oleracea (Finch-Savage et al., Reference Finch-Savage, Rowse and Dent2005b), the greater the mean seed weight, the higher the sensitivity of the seeds to hypoxia. Differences in seed weight in carrot are largely associated with the position of the seed on the mother plant (umbel order) even within the same genotype (Oliva et al., Reference Oliva, Tissaoui and Bradford1988).
The O2 requirement for seed germination is also strongly modulated by other environmental factors (e.g. temperature, water potential and light) (Corbineau and Côme, Reference Corbineau, Côme, Kigel and Galili1995, and references therein). Generally, the sensitivity of seeds to O2 deprivation decreases with decreasing temperature, because of reduced respiratory activity and the higher solubility of O2 in water (Côme and Tissaoui, Reference Côme, Tissaoui and Heydecker1973; Corbineau and Côme, Reference Corbineau, Côme, Kigel and Galili1995). The acquisition of responsiveness to light of Oldenlandia corymbosa seeds during imbibition requires at least 3.5% O2 (Corbineau and Côme, Reference Corbineau and Côme1985), while continuous white light reinforces the sensitivity to O2 deprivation of negatively photosensitive seeds (Corbineau et al., Reference Corbineau, Belaid and Côme1992; Gutterman et al., Reference Gutterman, Corbineau and Côme1992).
Seed physiological status also influences germination responses to O2. In different species, dormant seeds are more sensitive to O2 deprivation than are non-dormant ones. This has been clearly demonstrated with cereal (Corbineau and Côme, Reference Corbineau and Côme1980; Corbineau et al., Reference Corbineau, Sanchez, Côme and Chaussat1981; Benech-Arnold et al., Reference Benech-Arnold, Gualano, Leymarie, Côme and Corbineau2006), sunflower (Helianthus annuus) (Gay et al., Reference Gay, Corbineau and Côme1991; Corbineau and Côme, Reference Corbineau, Côme, Kigel and Galili1995) and Douglas fir (Pseudotsuga menziesii) seeds (Corbineau et al., Reference Corbineau, Bianco, Garello and Côme2002). Priming (hydration and dehydration) treatments also seem to improve germination of seeds in suboptimal O2. Osmoprimed seeds of tomato (Solanum lycopersicum, formerly Lycopersicon esculentum) (Özbingöl et al., Reference Özbingöl, Corbineau and Côme1998) and leek (Allium ampeloprasum var. porrum) (Corbineau et al., Reference Corbineau, Picard and Côme1994b) are less sensitive to O2 deprivation than are the control non-primed seeds.
A population-based threshold model has been applied to quantify seed germination responses to temperature, water potential, hormones, light, ageing, dormancy and after-ripening (Covell et al., Reference Covell, Ellis, Roberts and Summerfield1986; Gummerson, Reference Gummerson1986; Ni and Bradford, Reference Ni and Bradford1992, Reference Ni and Bradford1993; Bradford et al., Reference Bradford, Tarquis and Duran1993; Bradford, Reference Bradford, Kigel and Galili1995, Reference Bradford2005; Larsen et al., Reference Larsen, Bailly, Côme and Corbineau2004; Bair et al., Reference Bair, Meyer and Allen2006). The model is based upon the effects of these various factors on the time courses of germination across a range of factor levels. The model quantifies the median base or threshold level of the factor that allows germination, the variation in these threshold values among seeds in the population, and a time constant that relates the speed of germination to the factor level in relation to the thresholds. It has proven to be a robust method to quantify sensitivity thresholds for seed germination and to assess the effects of various influences on those thresholds, such as priming, alternating temperatures, dormancy and after-ripening (Dahal and Bradford, Reference Dahal and Bradford1990, Reference Dahal and Bradford1994; Alvarado and Bradford, Reference Alvarado and Bradford2005; Huarte and Benech-Arnold, Reference Huarte and Benech-Arnold2005; Bair et al., Reference Bair, Meyer and Allen2006). In addition to providing quantitative parameters that characterize germination responses, the model allows the prediction of germination time courses at any level of the quantitative factor and the possibility of modelling the outcomes of interactions among two or more factors (Ni and Bradford, Reference Ni and Bradford1992, Reference Ni and Bradford1993).
Despite the importance of O2 in regulating germination in many situations (Corbineau and Côme, Reference Corbineau, Côme, Kigel and Galili1995), the threshold model has not previously been applied to analyse seed germination responses to O2. We sought to test whether the threshold model was applicable to quantifying seed germination responses to O2 availability and, if so, whether new insights might be gained from its application. We have therefore utilized the threshold model to analyse a number of published and previously unpublished datasets representing 15 species and a number of temperature, priming and dormancy conditions. The results demonstrate that the threshold model can be extended to analyse germination responses to O2 and can provide new information about seed O2 requirements.
Methods
Germination at different O2 percentages
When data were obtained from published reports, details of the methods used are in the original citations (see Table 1). Unpublished experiments of Corbineau and colleagues of germination in different O2 percentages utilized the apparatus and methods described previously (Côme and Tissaoui, Reference Côme and Tissaoui1968). Gas mixtures containing from 0 (pure nitrogen) to 21% O2 (air) and from 21 to 100% O2 (pure O2) were obtained through capillary tubes from compressed air and nitrogen, or from compressed air and O2, respectively. The gaseous atmospheres thus obtained were passed continuously through germination chambers at a constant flow rate (4 l h− 1). Each assay was performed with two germination chambers (replicates) containing 30 (Araucaria), 100 (tobacco) or 50 seeds (all the other species) placed on a layer of cotton wool moistened with deionized water.
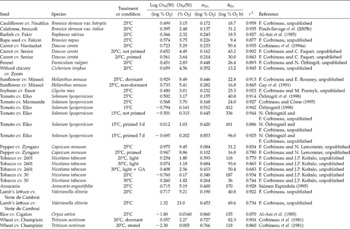
Oxygen response parameters of seed germination derived from the population-based threshold model

GA, gibberellic acid, 1 mM.
A seed was regarded as germinated when the radicle had pierced the seed-covering structures. Germination counts were made daily, up to 7, 14 or 21 d, depending on the species. The results presented are the means of the germination percentages obtained in the two replicates.
Seed treatments
For osmopriming, seeds were placed on a polyethylene glycol (PEG) 8000 solution at − 1.0 MPa at 15°C (tomato) (Özbingöl et al., Reference Özbingöl, Corbineau and Côme1998) or 20°C (carrot, pepper) for 3 or 7 d. After the osmotic treatments, seeds were rinsed with deionized water for 30 s and dried for 3 d at 20°C and 55% relative humidity prior to germination.
For wheat (Triticum aestivum) and sunflower, experiments were carried out with freshly harvested (dormant) seeds and seeds that were stored dry at ambient temperature for 1 year (wheat) or at 5°C for 9 months (sunflower) in order to release their dormancy.
The oxygen–time threshold model
The oxygen–time threshold model was adapted from the hydrotime model originally described by Gummerson (Reference Gummerson1986) and subsequently developed by Bradford and others (Bradford, Reference Bradford1990, Reference Bradford, Kigel and Galili1995; Finch-Savage, Reference Finch-Savage, Benech-Arnold and Sánchez2004; Allen et al., Reference Allen, Benech-Arnold, Batlla, Bradford, Bradford and Nonogaki2007). The model can be defined by the equation:

where θOx is the oxygen-time constant, Ox is the O2 percentage in the air surrounding the seed, Ox b(g) is the base or threshold value of Ox just allowing germination of percentage g of the viable seed population, and t g is the time to germination of percentage g. Since θOx is assumed to be constant, as the difference between Ox and Ox b(g) decreases, t g increases proportionately, and vice versa. In the case of O2 effects on germination, it was found that the response was proportional to the logarithm of the O2 percentage, so the actual model used was:

Since the value of Ox b(g) varies among seeds in the population, a probit regression method was used to estimate the median and standard deviation of what was assumed to be a normal distribution of O2 thresholds within the seed population (Bradford, Reference Bradford1990). This can be performed in a spreadsheet by regressing together the probit-transformed germination percentages at each observation time and Ox level on the values of logOx b(g) [calculated as logOx − (θOx/t g)] for each observation. The value of θOx is varied until the best fit is obtained (highest r 2 value for the regression). Linear relationships in this plot support the assumption of a normal distribution of thresholds. The median base O2 percentage [logOx b(50)] is the value of logOx b(g) when probit g = 0 (50%), and the inverse of the slope of the regression is the standard deviation of logOx b(g), or σOx. Together, the median and the standard deviation define the distribution of logOx b(g) values, which, along with θOx, allows the generation of predicted germination time courses at any value of logOx. Thus, the three parameters θOx, logOx b(50) and σOx can characterize the germination response at any value of Ox. More sophisticated weighted probit regression models can also be utilized if confidence limits or mean separations between treatments are required, but the parameter values obtained generally vary little from those obtained by the simple regression approach. Graphs and predicted time courses were generated using CoPlot software (www.cohort.com).
Results
Application of the threshold model to quantify germination sensitivity to oxygen
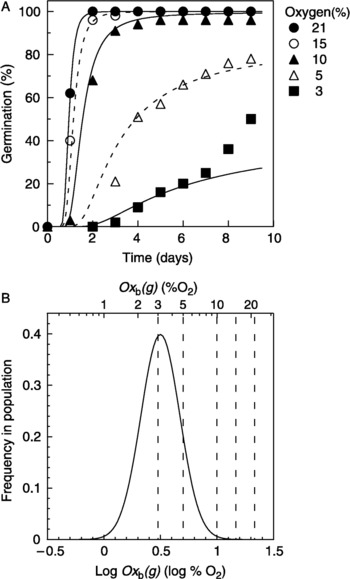
Data from germination of cauliflower (Brassica oleracea L. var. botrytis) illustrate the application of the population-based threshold model to quantify germination sensitivity to O2. Germination time courses were recorded at 25°C in 21, 15, 10, 5 and 3% O2. Reducing O2 percentage to 10% slightly delayed germination, but further reductions to 5 or 3% both delayed and reduced the final germination percentage (Fig. 1). The oxygen–time model fit these data well, based on the logarithm of the O2 percentage (r 2 = 0.96). The model indicated that germination would be reduced to 50% at 3.15% O2. Once the median base O2 percentage (logOx b(50)), the standard deviation of the base oxygen percentage (σOx), and the oxygen–time constant (θOx) were determined (Table 1), the model predicted initial germination time courses at all O2 percentages with good accuracy (Fig. 1). The distribution of Ox b(g) values in the seed population is shown in Fig. 1B, along with dashed lines indicating how different O2 percentages relate to the threshold distribution. The model predicts that only a few seeds would be able to germinate at 1% O2. Interestingly, seeds imbibed at low O2 percentages initially exhibited the germination time course predicted by the model, but after incubation for over a week at 3% O2, additional seeds apparently developed the capacity to germinate at this low pO2 (Fig. 1A). This pattern was observed in several of the datasets analysed, and may indicate that adaptation to low O2 availability can occur in seeds to shift their response thresholds to lower values (discussed further below). Additional datasets for other Brassicaceae species were also analysed and gave values similar to those shown in Fig. 1, with Ox b(50) values between 2.3 and 3.8% (Table 1).
Germination time courses of cauliflower (Brassica oleracea L. var. botrytis) seeds at 25°C in a range of O2 percentages. (A) Germination (symbols) at 21, 15, 10, 5 and 3% O2 and time courses (solid and dashed lines) predicted by the threshold model using the parameter values in Table 1. (B) The distribution of Ox b(g) values based upon the median and standard deviation of Ox b(g) values. The vertical dashed lines indicate the O2 percentages represented in panel A. As the difference between a given O2 percentage and the threshold for a particular seed fraction decreases, the time to germination increases. If the O2 percentage intercepts the distribution, the fraction of seeds represented by the relative area under the curve to the right of the O2 level will not be able to complete germination; so the final germination percentage also declines as pO2 decreases. (Previously unpublished data of F. Corbineau).

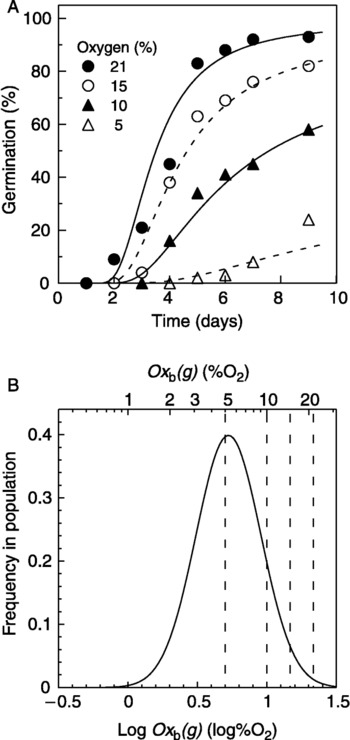
As a further example, carrot (Daucus carota) seed responses to O2 percentage were also described well by the threshold model (Fig. 2, Table 1) (Corbineau et al., Reference Corbineau, Picard and Côme1994a). Carrot seeds had a slightly higher median O2 threshold than did B. oleracea seeds, with Ox b(50) values of 4.5 to 5.3% (Table 1). Fennel (Foeniculum vulgare) seeds (also in the Apiaceae) were apparently somewhat more tolerant of low O2, with a Ox b(50) value of 2.8% (Table 1). Seeds of witloof chicory (Cichorium intybus), soybean (Glycine max), tomato, Araucaria angustifolia and lamb's lettuce (Valerianella olitoria) also had Ox b(50) values in the 3–5% O2 range (Table 1). Pepper (Capsicum annuum) seeds were much more sensitive to O2 limitation, with Ox b(50) values of c. 9%, while tobacco (Nicotiana tabacum) seeds were less sensitive, with median O2 thresholds of 1–2% (Table 1).
Germination time courses of carrot (Daucus carota) seeds at 20°C in a range of O2 percentages. (A) Germination (symbols) at 21, 15, 10, and 5% O2 and time courses (solid and dashed lines) predicted by the threshold model using the parameter values in Table 1. (B) The distribution of Ox b(g) values based upon the median and standard deviation of Ox b(g) values. Other details as in Fig. 1. (Data from Corbineau et al., Reference Corbineau, Picard and Côme1994a).

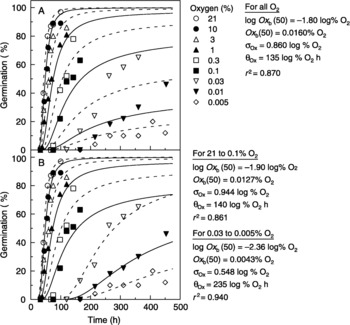
As might be expected from their ability to germinate under water, rice (Oryza sativa) seeds had very low O2 thresholds (Fig. 3A; Al-Ani et al., Reference Al-Ani, Bruzau, Raymond, Saintges, Leblanc and Pradet1985). Germination rates were only slightly delayed at O2 percentages down to 1%, and 10–15% of the seeds could germinate even in 0.005% O2. The Ox b(50) value using data from all tested O2 percentages was estimated to be 0.016% (Table 1). These data also exhibited the phenomenon mentioned above, where seeds incubated at very low O2 percentages (e.g. 0.03 and 0.01%) showed unexpectedly high germination after an initial period of low germination (Fig. 3A), suggesting the possibility of adaptation to low pO2. This was confirmed by separately modelling the time courses conducted in 0.1–21% O2 and in 0.005–0.03% O2. The parameters of the model changed relatively little for the higher pO2 range, with the Ox b(50) changing from 0.016 to 0.013% O2 (Fig. 3B). For the lowest O2 percentages, however, the model parameters exhibited a large increase in θOx from 140 to 235 log % O2 h, accounting for the initial delay in initiation of germination, and the Ox b(50) value decreased to 0.0043% O2, threefold lower than the median threshold for seeds incubated at the higher O2 range. The variation in O2 thresholds among the seeds in the population (σOx) also decreased from 0.86 to 0.55 log % O2. In both cases, this range of variation in the thresholds predicted that 16% of the seeds (one standard deviation below the median) would germinate at a pO2 of 0.0014%. Using these values, the predicted curves matched the germination time courses in both high and low pO2 regions very well (r 2 = 0.86 for higher percentages and 0.94 for lower percentages) (Fig. 3B).
Germination time courses of rice (Oryza sativa) seeds at 25°C in a range of O2 percentages. (A) Actual data (symbols) and predicted time courses (solid and dashed lines) and parameter values when data from all tested O2 percentages are included in the model. (B) Actual data (symbols) and predicted time courses (solid and dashed lines) and parameter values when data from the six highest O2 percentages and the three lowest O2 percentages are analysed separately in the model. The improvement in predicted fits in the latter case is associated with a shift of Ox b(50) to a lower value, and a reduction in σOx and increase in θOx of seeds incubated at the lowest oxygen percentages. (Data from Al-Ani et al., Reference Al-Ani, Bruzau, Raymond, Saintges, Leblanc and Pradet1985).

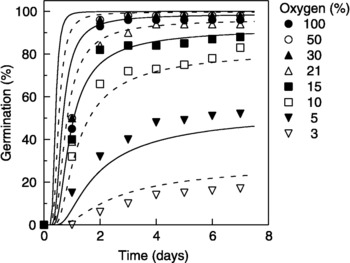
The threshold model was also capable of incorporating the effects on germination of O2 percentages above ambient (21%). Witloof chicory seeds did not achieve 100% germination in 21% O2, but did so when incubated in elevated pO2 (Fig. 4). Including the data from all of the O2 percentages resulted in poorer fits (r 2 = 0.80) than did including only the data from 21% and lower percentages (r 2 = 0.94). Both approaches predicted that O2 percentages above ambient would speed germination and allow additional seeds in the population to germinate, but the latter gave better fits to germination time courses at lower O2 percentages (Fig. 4). This model predicted the increase in total germination at higher pO2, but also predicted that germination would be much more rapid than was observed at O2 percentages above ambient (Fig. 4). However, the initiation of germination is also dependent upon the time required for imbibition and metabolic activation in these rapidly germinating seeds, so the minimum time to initiation of germination is likely limited by factors other than O2 in these early stages.
Germination time courses of witloof chicory (Cichorium intybus) seeds at 25°C in a range of O2 percentages. The threshold model was fit using only data (symbols) at or less than 21% O2, but time courses (solid and dashed lines) are predicted for all O2 percentages. The model predicts the increased total germination at O2 percentages greater than ambient, but underestimates the initial timing of germination. (Previously unpublished data of F. Corbineau).

Effects of temperature and priming on oxygen threshold values
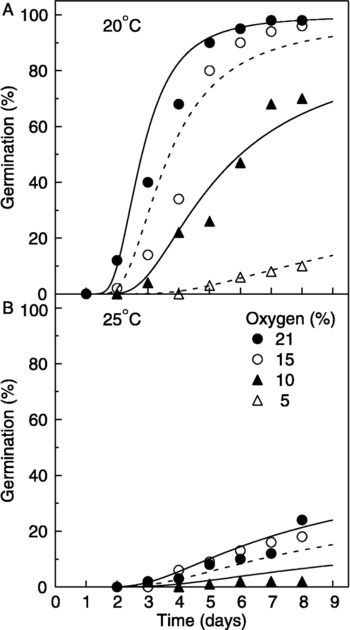
It might be expected that O2 requirements for germination would increase as temperature increased, due to higher respiration rates increasing the demand for O2 and to lower solubility of O2 in water. This was evident in data for lamb's lettuce seeds germinated at either 20 or 25°C (Fig. 5). At 20°C, germination was sensitive to O2 percentage, with an estimated Ox b(50) of 5.21% (Fig. 5A, Table 1). At 25°C, germination was largely inhibited, and Ox b(50) was estimated to be 21% (Fig. 5B). A change of this magnitude cannot be due to reduced solubility of O2 in water at the higher temperature, which changes only 10% between 20 and 25°C (from 0.031 to 0.028 ml O2 ml− 1). The failure to germinate at the higher temperature is likely due to the imposition of thermodormancy, which could not be overcome solely by increasing the O2 concentration, as the model predicts that only c. 80% of the seeds would complete germination even in 100% O2 (not shown).
Germination time courses of lamb's lettuce (Valerianella olitoria) seeds at (A) 20°C or (B) 25°C in a range of O2 percentages. Symbols are the actual data, and lines are the time courses predicted by the threshold model using parameter values in Table 1. (Previously unpublished data of F. Corbineau).

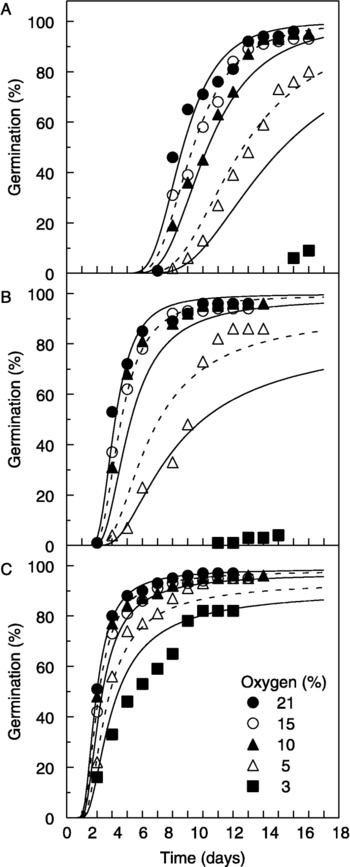
Tomato seeds, which are generally not subject to thermodormancy, also exhibited an increase in Ox b(50) values as temperature increased. At 15°C, tomato seeds germinated >80% at 5% O2, and the threshold model predicted an Ox b(50) value of 0.16% (Fig. 6A, Table 1). At 25°C, however, only c. 60% of seeds could complete germination at 5% O2, and an Ox b(50) value of 3.17% was estimated, or c. 20-fold greater than at 15°C (Table 1). The decrease in O2 solubility over this range would account for an increase of only 0.21-fold in O2 requirements. A similar increase in Ox b(50) with temperature was also evident in one variety of tobacco (cv. 30, Table 1). Thus, higher respiration rates at warmer temperatures, combined with limits to O2 diffusion through seed covering tissues, apparently result in higher O2 thresholds.
Germination time courses of tomato (Solanum lycopersicum) seeds at 15°C in a range of oxygen percentages. (A) Germination of untreated (control) tomato seeds. Note that the model does not predict the very low germination at 3% O2. (B) Germination of tomato seeds primed in − 1.0 MPa polyethylene glycol (PEG) for 3 d. Note that the model does not predict the very low germination at 3% O2. (C) Germination of tomato seeds primed in − 1.0 MPa PEG for 7 d. Note that the model does predict with reasonable accuracy the germination time course at 3% O2. Symbols are the actual data, and lines are the time courses predicted by the threshold model using parameter values in Table 1. (Data of Özbingnöl, Reference Özbingöl1998; Özbingnöl and Corbineau, unpublished).

The data for germination of tomato seeds at 15°C contain some anomalous responses at low pO2. While germination decreased regularly between 21 and 5% O2, germination was inhibited to a much greater extent at 3% O2 than was predicted (Fig. 6A). This suggests that the Ox b(50) estimated above (0.16%) is not actually achieved, and that tomato seeds exhibit a very sharp reduction in germination capacity between 5 and 3% O2. This same pattern was evident in tomato seeds that had been primed for 3 d in − 1 MPa PEG at 15°C (Fig. 6B). However, after 7 d of priming under these conditions, seeds incubated in 3% O2 germinated essentially as the model predicted, with only a slight delay (Fig. 6C). Thus, extended priming appeared to eliminate the sharp O2 requirement threshold between 3 and 5% O2. However, pepper seeds exhibited only a relatively small reduction in Ox b(50) after 5 d of priming (Table 1).
Effects of after-ripening on oxygen threshold values
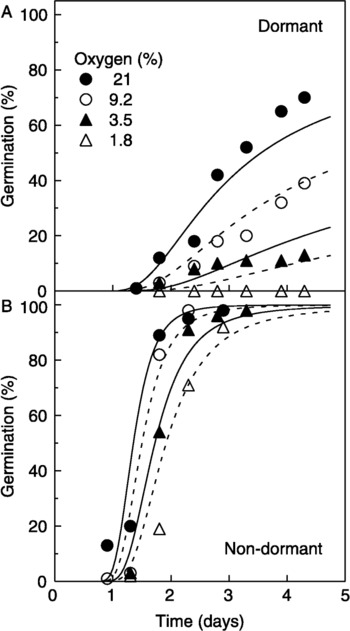
It is well known that the O2 requirements for cereal seed germination are dependent upon the dormancy status of the seeds (Lenoir et al., Reference Lenoir, Corbineau and Côme1986; Lecat et al., Reference Lecat, Corbineau and Côme1992). As illustrated here for dormant and non-dormant (after-ripened) wheat seeds (Corbineau et al., Reference Corbineau, Sanchez, Côme and Chaussat1981), the loss of dormancy shifted Ox b(50) values from 2.27% to 0.005% (Table 1, Fig. 7). Similar but less dramatic results were also evident for sunflower. Soon after harvest, sunflower seeds germinated rather slowly and only achieved about 85% final germination (data not shown). Germination was more rapid and to higher percentages in pO2 above ambient, and Ox b(50) values were relatively high (8.5%) (Table 1). Following after-ripening for 9 months at 5°C (Gay et al., Reference Gay, Corbineau and Côme1991), germination rates and percentages improved at all O2 percentages except 5%, and the estimated Ox b(50) value was reduced to 5.4% (Table 1). Thus, in both monocot and dicot seeds, loss of dormancy was associated with a reduction in the threshold oxygen percentage.
Germination time courses of wheat (Triticum aestivum) seeds at 20°C in a range of O2 percentages. (A) Dormant seeds tested soon after harvest. (B) Non-dormant seeds tested after 1 year of dry storage at ambient temperature (after-ripening). Symbols are the actual data, and lines are the time courses predicted by the threshold model using parameter values in Table 1. (Data from Corbineau et al., Reference Corbineau, Sanchez, Côme and Chaussat1981).

Discussion
The population-based threshold model has been applied to quantify seed germination responses to many environmental and physiological factors (Bradford, Reference Bradford, Kigel and Galili1995; Finch-Savage et al., Reference Finch-Savage, Côme, Lynn and Corbineau2005a; Bair et al., Reference Bair, Meyer and Allen2006). It has proven to be a robust model that is simple to apply, and requires only three parameters to characterize seed germination responses to levels of various environmental or physiological factors. The median base threshold indicates the sensitivity of the population to the factor, the standard deviation of thresholds among seeds in the population indicates the variance or uniformity of the population, and the time constant is related to the overall speed of germination. Here, we demonstrate that this model can also be applied to quantify and characterize the germination responses of seeds to O2 availability.
Using previously published data and our own unpublished results, the population-based threshold model was able to fit well to germination time courses across a range of pO2 from 100 to 0.005%. The model provides quantitative estimates of the median O2 sensitivity threshold [Ox b(50)] and of the variation among seeds in their threshold values (σOx). Seeds of a number of species have Ox b(50) values in the range of 2–5% O2 (Table 1). Others, including pepper and dormant sunflower seeds, have Ox b(50) values in the 8–9% range, while some, particularly cereals, can have threshold values as low as 0.005% (Table 1). Although generally in the range of values reported for many of these species by Al-Ani et al. (Reference Al-Ani, Bruzau, Raymond, Saintges, Leblanc and Pradet1985), the values calculated by the threshold model are often several percent lower, even when the same data are analysed. This may be due to the methods used to calculate the germination rates in that work. It is unclear, for example, whether the rates used were the times to germination of 50% of the entire population or the times to germination of 50% of the fraction of seeds that completed germination. Although often used, the latter approach is not a valid comparison among seed lots or conditions, and can skew estimates of germination parameters when final germination percentages vary widely. Nonetheless, the clear differences between most dicot seeds and the cereals are consistent between the two methods. Temperature, after-ripening and priming also affected O2 sensitivity thresholds, variances and time constants (Table 1).
Some data indicated that seeds could adapt to low O2 percentages after a period of incubation following imbibition. This was clearly demonstrated in the case of rice, where application of the model to all data resulted in an acceptable (but not excellent) fit to the data (Fig. 3A). However, separation of the data into those at O2 percentages above and below 0.1% resulted in good fits in both pO2 ranges (Fig. 3B). Seeds initially incubated at O2 percentages near the Ox b(50) value were delayed in initiating germination, but then germinated in a manner indicating that their Ox b(50) values had decreased 3- to 4-fold relative to seeds incubated at higher O2 percentages (Fig. 3B). This may result from a metabolic adaptation of energy metabolism in hypoxia (Al-Ani et al., Reference Al-Ani, Bruzau, Raymond, Saintges, Leblanc and Pradet1985), inhibition of different biosynthetic processes (Geigenberger, Reference Geigenberger2003) or a progressive increase in permeability of the covering tissues to O2 leading to better oxygenation of the embryo. Similar adaptive shifts after extended incubation were reported for tomato seeds in relation to water potential and abscisic acid thresholds for germination (Ni and Bradford, Reference Ni and Bradford1992; Dahal and Bradford, Reference Dahal and Bradford1994). The threshold model provides a method to identify such shifts, as relatively poorer fits of the model are obtained when such adaptation occurs and all data are combined. Splitting the data into distinct subsets and fitting each factor range separately can identify such shifts and the factor levels at which adaptation is induced. It is difficult to distinguish such adaptation without a model to identify consistent patterns in the germination data.
An interesting feature of the threshold modelling approach is that it quantifies the variation among seeds in their sensitivities to various factors influencing germination. In the case of rice, for example, while the median O2 threshold was quite low (0.013–0.016% O2), the standard deviation of the thresholds in the population was 0.86–0.94 log % O2 units, or a range of 3.44–3.76 log units (four standard deviations) between the 2nd and 98th percentiles of the population. Thus, some seeds required c. 3000-fold higher percentages of O2 to germinate than did other seeds within the same seed population. Even a σOx value of 0.25 log % O2, near the lower end of those observed (Table 1), implies a tenfold range in O2 sensitivity within the seed population.
The threshold model also assumes that there is an oxygen–time constant (θOx) that is the same for all seeds in the population. That is, the product of the difference between the seed O2 thresholds and the actual O2 percentage, multiplied by the time to germination, is a constant for all seeds. Thus, at a given O2 percentage, the higher the O2 threshold value, the longer the time to germination. Alternatively, the time to germination increases as the O2 percentage decreases relative to a fixed threshold distribution. This explains why the rate of germination decreases as O2 percentage decreases, even for those seeds that will eventually germinate. Seeds whose thresholds are above the ambient O2 percentage, on the other hand, will not complete germination (unless adaptation occurs to lower their thresholds below the ambient O2 level).
In summary, a wide range of data for germination responses to O2 availability could be analysed by the population-based threshold model approach. As has been reported previously (e.g. Al-Ani et al., Reference Al-Ani, Bruzau, Raymond, Saintges, Leblanc and Pradet1985), the response to O2 percentage was logarithmic, and seeds exhibited a wide range of O2 thresholds for germination, both between and within species. Temperature, after-ripening and priming can influence the estimated O2 thresholds. This approach provides a consistent method for quantifying O2 response thresholds for germination and for predicting germination rates and percentages at any O2 level.
Acknowledgements
K.J.B. gratefully acknowledges the Université Pierre et Marie Curie for providing him a fellowship as invited professor during which this work was conducted in the laboratory of his co-authors in Paris.