 .
I. INTRODUCTION
Al-based quasicrystals (QCs) and related complex metallic alloys (CMAs) are characterized by a combination of properties, such as low friction, elevated hardness, and low surface energy compared to normal metals.Reference Sordelet and Dubois1 Such attractive properties have driven interest in QCs as new functional coating materials for technological applications.Reference Dubois, Kang and von Stebut2
It is well known that residual (or internal) stress in deposited films can strongly affect their physical properties and their mechanical behavior.Reference Tsui and Clyne3, Reference Vaz, Rebouta, Goudeau, Rivière, Schäffer, Kleer and Bodmann4 Residual stress in physical vapor deposited (PVD) films can be either tensile or compressive. Excessive tensile stress may produce cracking of the film and/or substrate, while compressive stresses can cause interfacial decohesion, buckling, and delamination.Reference Zhao, Hershberger, Yalison and Bilello5 Hence, determination and control of residual stress is crucial to optimize thin film properties.
Residual stress in thin films generally arises from two main sources: thermal stress and the so-called intrinsic stress.Reference Clyne6 Thermal stress appears in films bonded to substrates possessing different thermal expansion coefficients when used at a temperature different from the deposition temperature. Intrinsic stress refers to internal stress related to nonequilibrium growth conditions. It often results from an accumulation of crystallographic flaws in the coating, incorporation of excess vacancies, and/or presence of impurities. Residual stress may also be the consequence of external treatments, like bombardment by energetic particles for instance.Reference Tsui and Clyne3, Reference Ganne, Crépin, Serror and Zaoui7 The magnitude of intrinsic stresses in PVD films is related to their microstructures, i.e., morphology, texture, and grain size as depicted by the structure–zone diagram.Reference Pauleau8 In the case of Al–Cu–Fe–B quasicrystalline thin films deposited at a substrate temperature T S of 560 °C, the ratio T S/T m = 0.7 (with T m the material melting point) corresponds to the so-called structural zone 2 for which columnar-like structure is typically observed.Reference Anders9 Such a microstructure is believed to be the result of surface diffusion–controlled growth.Reference Ohring10
In this article, we present a study of the residual stress in as-deposited quasicrystalline Al–Cu–Fe–B films and try to improve our understanding of possible damaging mechanisms of the films resulting from residual stress. We use two complementary experimental approaches. One relies on the analysis of peak shifts in x-ray diffraction (XRD) patterns using the sin2ψ method. A difficulty arises in the case of Al–Cu–Fe–B films because of the possible formation of the so-called approximant phases along with (or even instead of) the quasicrystalline phase in the film.Reference Joulaud, Diot, Donnadieu, Janot and Mosseri11 These approximant phases are crystalline phases with large unit cells that are structurally very close to the QC parent phase, exhibiting diffraction patterns resembling that of the QC. Such an artifact may hamper essentially the interpretation of the diffraction peak shifts. Hence, we have used a second method for the measurement of residual stress: the curvature method. In addition, we have used QC films of different thicknesses (namely 0.55, 1.2, 1.95, and 2.6 μm) to clarify the dependence of the stress amplitude on the film thickness. Experimental details are provided in Section II. The results are presented in Section III and discussed in Section IV.
II. EXPERIMENTAL DETAILS
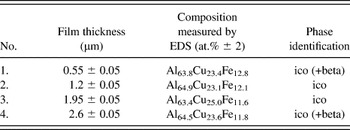
A target with composition Al58.4Cu24.8Fe12.1B4.7 was produced by hot pressing quasicrystalline powders at 810 °C under an Ar atmosphere and a pressure of 30 MPa. The target was 50 mm in diameter and 3 mm in thickness. All Al–Cu–Fe–B films were prepared by d.c. magnetron sputtering of the target on Si(100) substrates maintained at a temperature of 560 °C. The base pressure was 10−6 mbar at room temperature and up to 10−5 mbar at a substrate temperature of 560 °C. Films were deposited at a pressure of 10−2 mbar of working gas containing 90 at.%Ar–10 at.%H2. The sputtering system is equipped with three independent magnetrons focused at the center of the substrate holder and inclined by 30° with respect to the substrate surface normal.Reference Duguet, Fournée, Dubois and Belmonte12 The distance between the substrate and the target was 10 cm, and the sample was rotated at 30 rpm during deposition to ensure homogeneity. The substrates were cleaned with acetone and methanol before loading in the sputtering system. A presputtering of the target for 5 min with closed shutters was used to clean the target surface before deposition. The sputtering power was 80 W. The deposition rate for all films was about 14 nm/min. Four Al–Cu–Fe–B films with different thicknesses were deposited on 180-μm-thick Si substrates (Table I).
Characteristics of deposited films.

The chemical compositions of the initial target and of the deposited films were investigated using both energy-dispersive x-ray spectrometry (EDS) in a Philips XL30 scanning electron microscope (SEM; Eindhoven, Netherlands) and secondary-ion mass spectrometry (SIMS). Elemental depth profile distributions were measured using a CAMECA IMS 7F apparatus (Gennevillers, France) with an O+-ion primary beam (10 keV, 100–200 nA) sputtering an area of about 250 × 250 μm2. Thus, the oxygen content could not be detected. The nominal chemical composition of the initial target was used as a standard for SIMS calibration to determine the content and the distribution of Al, Cu, Fe, and B elements in the films.
The phase structure determination of the deposited films was achieved by grazing-incidence XRD (Co-Kα radiation) using a position sensitive detector. The incidence angle for all samples was 5°, the step size was 0.029° (2θ), and total acquisition time was 60 min for each spectrum. Microstructure and film thicknesses were characterized using SEM in secondary electron imaging mode.
The residual stress was determined by a modified XRD sin2ψ method adapted for the grazing-incidence geometry to increase the surface sensitivity.Reference Ma, Huang and Chen13 In the case of an isotropic material (Ehkl = E, νhkl = ν) and assuming that stress in the film is biaxial and furthermore that σ11 = σ22, σ12 = 0, the strain originating from the residual stress in the plane (hkl) can be determined byReference Ma, Huang and Chen13:
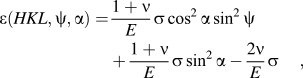
where E and ν are Young’s modulus and Poisson’s ratio of the film material, respectively, α = θ 0 − γ, with θ 0 the Bragg angle of the analyzed peak at ψ = 0, and γ is the grazing angle. The stress σ was obtained by determining the slope of ε(HKL,ψ,α) versus cos2αsin2ψ, which is equal to  .
In the case of QCs, the strain ε(HKL,ψ,α) along the direction (HKL) (where according to Ref. Reference Cahn, Shechtman and Gratias14: H = h + h′τ ; K = k + k′τ ; L = l + l′τ in which h, h′, k, k′, l, and l′ are all integers, τ = (1 + √5)/2) was calculated according to

from the determined 6D lattice parameterReference Cahn, Shechtman and Gratias14a 6D(ψ,α) in the presence of residual stresses, which is different from strain-free parameter a 6D0(α).
The values of a 6D were determined using Eq. (3)Reference Cahn, Shechtman and Gratias14 for (18,29), (20,32), and (52,84) reflections, which corresponds to directions along 5-fold [for (18,29) peak] and 2-fold [for both (20,32) and (52,84) peaks] axes of the icosahedral structure.
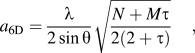
where λ is the wavelength and θ is the Bragg angle of the (N,M) reflection according to indexing system of Cahn et al.Reference Cahn, Shechtman and Gratias14
All XRD scans were carried out using a D8 Discover diffractometer (Bruker AXS GmbH, Karlsruhe, Germany) equipped with an Eulerian cradle. The operating voltage and current were 40 kV and 35 mA, respectively. The diameter of the beam-defining collimating slit was 1 mm. The samples were mounted on a four-circle goniometer where the angle ψ could be varied between 0° and 80°. A rotating device allowed the sample to rotate further around the surface normal during the measurements. The incidence angle γ was set to 5° for all the experiments. The detector scanned in the 2θ range from 47° to 55° to measure positions for both (18,29) and (20,32) peaks of the icosahedral phase.Reference Cahn, Shechtman and Gratias14 The center of each Bragg peak was identified using a Voigt function analysis. A defocusing effect in the measurement of the peak positions as a function of tilt angles ψ of the sample with respect to the scattering plane was taken into account. For this purpose, XRD measurements were performed as a function of ψ on stress-free powders of the icosahedral Al–Cu–Fe–B quasicrystalline phase (Cristome F1 from Saint-Gobain, Cavaillon, France).
Residual stress was further investigated using the curvature method, which relies on the relation existing between the change in curvature radius R of the substrate after thin film deposition and the average biaxial stress in the film. The residual stress is determined through Stoney’s formulaReference Mézin15:
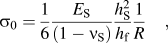
where E S and ν S are the Young’s modulus and the Poisson’s ratio of the substrate and h S and h f are the thicknesses of substrate and film, respectively. The curvature was measured optically along a line parallel to the sample length. The radius R was derived from a least-square fit of recorded profiles. Substrate samples used for these measurements had a rectangular shape of approximately 30 × 8 mm2, i.e., with a relatively small width to avoid possible geometrical nonlinear effects.Reference Mézin15
Finally, thermal expansion coefficients were measured using a Netzsch dilatometer DIL 402C (resolution ± 0.125 mm; Selb, Germany). A polycrystalline sample (14 × 3 × 3 mm3) with composition Al59.5Cu25.5Fe12B3 was submitted to temperature cycles in an argon atmosphere at a rate of 5 K/min in the range 25–700 °C. All measurements used a constant loading force of 0.45 N and were corrected using standard procedures.
III. RESULTS
A. Characterization of the Al–Cu–Fe–B films
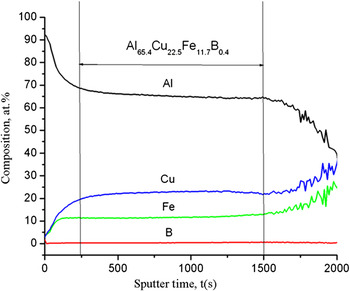
Chemical compositions of the films as determined by EDS are listed in Table I. They are all very close to Al63Cu24Fe13, the canonical composition of the icosahedral phase. No boron can be detected by EDS due to the weak sensitivity of the technique to light elements. Typical composition profiles across the film thickness as determined by SIMS are shown in Fig. 1. Three different zones can be distinguished. The first zone corresponds to an aluminum-enriched near-surface layer. The formation of a thin amorphous aluminum oxide layer at the surface of the Al-based quasicrystalline phases is well documented,Reference Pinhero, Chang, Anderegg and Thiel16, Reference Gil-Gavatz, Rouxel, Pigeat, Weber and Dubois17 and, therefore, we hypothesize that this first zone corresponds to this surface aluminum oxide. The second one corresponds to the main part of the film. The concentration profiles in this zone are almost uniform. The average composition is Al65.4Cu22.5Fe11.7B0.4, i.e., close to that measured by EDS. The low boron content compared to the target nominal composition is probably a consequence of the increased scattering of light B atoms during transport of sputtered atoms from target to substrate. A third zone in which the concentrations of Al decrease while those of Fe and Cu increase might correspond to a diffusion interface layer between the film and the substrate. The Si concentration profile has not been measured, and we cannot exclude that some Si diffuse from the substrate into the film at this stage. Previous studies have shown that the addition of Si may even stabilize the formation of the quasicrystalline phase in Al–Cu–Fe alloys.Reference Tsai, Inoue and Masumoto18 However, the Si content should stay at a relatively low level as, above a critical value of 7–10 at.%, the Si addition destabilizes the quasicrystalline phase, leading to the formation of other crystalline phases.Reference Wang, Zhang, Geng and Yang19 Thus, we can suppose that the diffusion of Si in the Al–Cu–Fe–B film during the deposition process may lead to a partial substitution of Si for Al while preserving the quasicrystalline structure as revealed by XRD. Investigation of oxygen concentration of the films by using x-ray photoelectron spectroscopy (after several sputtering and annealing cycles) showed that the main parts of the films contain less than 2 at.% of oxygen. This value corresponds to the oxygen content in the initial target.
Elemental concentration profiles (at.%) as a function of sputtering time obtained by secondary-ion mass spectrometry on deposited Al–Cu–Fe–B thin film (sample 1).

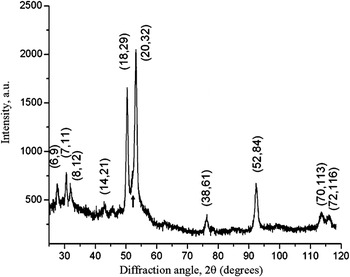
Figure 2 shows a typical XRD pattern recorded at grazing incidence for a film deposited at a substrate temperature of 560 °C. Most diffraction peaks can be indexed using the icosahedral structure. Small additional peaks can also be observed in the XRD pattern, which are attributed to the presence of a β phase. Its amount is estimated from XRD patterns at 5–10 vol%. The grain size can be estimated (neglecting other contributions to peak broadening like microstrains and phason disorder) and is found to be in the range of 50–60 nm.Reference Cheary, Coelho and Cline20 To summarize this section, the measured chemical composition and the XRD pattern are both consistent with a film containing mainly the quasicrystalline phase. As mentioned in the introduction, other CMAs closely related to the quasicrystalline phase exist in the phase diagram and present very similar XRD patterns. A more precise structural investigation of the film would be needed to detect the presence of such approximant phases in the film, using transmission electron microscopy for example. In spite of these limitations, the structure of the film can be considered sufficiently close to that of the quasicrystalline phase to expect the desired physical properties.
x-ray diffraction (XRD) pattern of the deposited Al–Cu–Fe–B films deposited on Si(100) substrate at 560 °C. The indexation scheme proposed by Cahn has been used for the icosahedral phase.Reference Cahn, Shechtman and Gratias14 The arrow indicates the presence of additional β phase.

B. Residual stress in QC films determined with XRD analysis
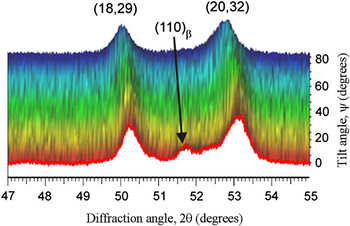
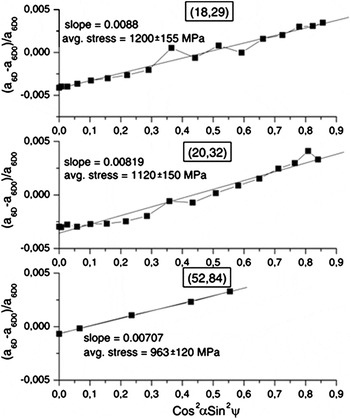
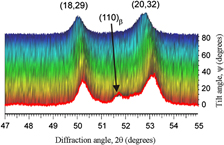
Figure 3 shows a set of diffraction patterns in the range of the main reflections [(18,29) and (20,32) peaks] as a function of the tilt angle ψ for sample 2. A clear shift of the peaks to lower 2θ angles is observed as the tilt angle ψ increases. A similar behavior is observed for all films under study. Figure 4 presents variations of 6D quasicrystalline lattice parameters for the most intense peaks (18,29), (20,32), and (52,84) of the quasicrystalline phase for the 0.55-μm-thick film (sample 1) as a function of cos2αsin2ψ. Each data set can be fitted by a linear function with a good correlation factor. All curves exhibit the same tendency: the strain increases linearly with cos2αsin2ψ, which corresponds to tensile stress in the film. For the estimation of the stress level in the films, the following elastic constants were used: E AlCuFeB = 168 GPa, ν AlCuFe = 0.23.Reference Takeuchi, Dubois, Thiel, Tsai and Urban21 The stress values determined using (18,29), (20,32), and (52,84) peaks equals 1.2 ± 0.15, 1.12 ± 0.15, and 0.96 ± 0.12 GPa, respectively. These values are close to each other, and the small discrepancy observed may be related to a small anisotropy of the elastic constants of the diffracting QC phase in the films, induced by the presence of a small amount of impurity phases (Al(Fe) borides, oxides, approximant phases, β-phase)Reference Gnaupel-Herold, Prask, Biancaniello and Gdoutos22 or due to a texture of the film.Reference Birkholz, Fewster and Genzel23 Indeed, we have performed pole figures and found that the film exhibits a weak texture. The average value of the residual stress in the film is 1.09 ± 0.12 GPa, i.e., close to the σ value derived from the (20,32) peak. In the following, the dependence of σ on the film thickness is analyzed using the (20,32) peak alone.
Example of three-dimensional plot of XRD patterns recorded as a function of the tilt angle ψ for sample 2.

Plots of (a 6D − a 6D0)/a 6D0 versus (cos2αsin2ψ) derived from (18,29), (20,32), and (52,84) reflections of quasicrystalline phase in 0.55-μm-thick Al–Cu–Fe–B film (sample 1).

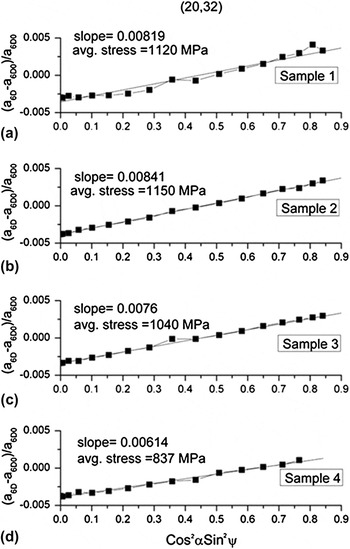
Figure 5 presents the relative variations of the 6D quasicrystalline lattice parameters (a 6D − a 6D0)/a 6D0 for (20,32) peak as a function of cos2αsin2ψ for films with different thicknesses. The σ values remain almost constant for film thicknesses up to 1.2 μm and then start to decrease for thicker films.
Plots of (a 6D − a 6D0)/a 6D0 versus (cos2αsin2ψ) derived from XRD patterns for Al–Cu–Fe–B films of different thicknesses h f: (a) h f = 0.55 μm; (b) h f = 1.2 μm; (c) h f = 1.95 μm; (d) h f = 2.6 μm.

C. Residual stress determined by the curvature method
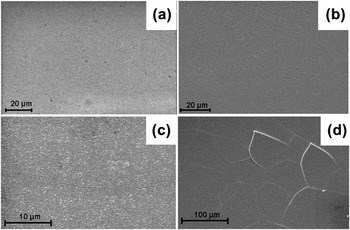
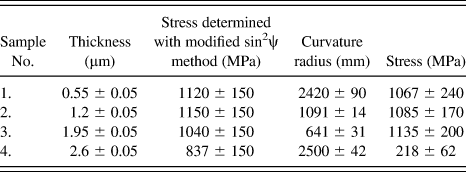
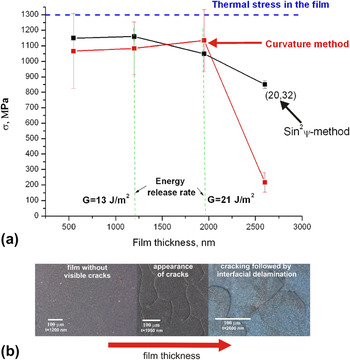
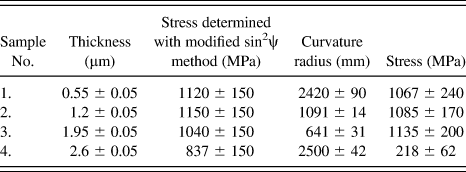
The curvature radius measured and the calculated values of film internal stress are listed in Table II. The following elastic constants for Si(100) substrate were used for the calculation: E Si = 179.4 GPa and ν = 0.28.Reference Hopcroft, Nix and Kenny24 The initial curvature radius of the bare silicon substrate after heating to 560 °C and subsequent cooling was found to be as large as 22 m, at least an order of magnitude larger than the curvature radius measured after thin film deposition. It can thus be concluded that the substrates are flat enough for this initial curvature to be neglected. We see that films with thickness up to 1.95 μm exhibit about the same level of stress σ ∼ 1.0 GPa. The stress measured for the 2.6-μm-thick film is significantly reduced to about 200 MPa. This result is correlated with the appearance of a high density of cracks and partial delamination of the film as seen in SEM images shown in Fig. 6. The surfaces of the 0.55- and 1.2-μm-thick films are homogeneous. First, cracks appear at the surface of the 1.95-μm-thick film. A significant increase in the crack density is observed for the 2.6-μm-thick film [Fig. 6(d)], together with partial delamination.
Scanning electron microscope images of the surface of Al–Cu–Fe–B films with thickness of (a) 0.55 μm, (b) 1.2 μm, (c) 1.95 μm, and (d) 2.6 μm. Cracks appear in (c) and lead to partial delamination in (d).

Summary of stress measurements with both x-ray diffraction analysis and the curvature method.
IV. DISCUSSION
As mentioned above, one of the most important sources of residual stress in thin films is thermal stress.Reference Clyne6 Due to the difference in thickness between the film and substrate, almost all of the thermal strains occur in the film, and the thermal stress can be expressed by

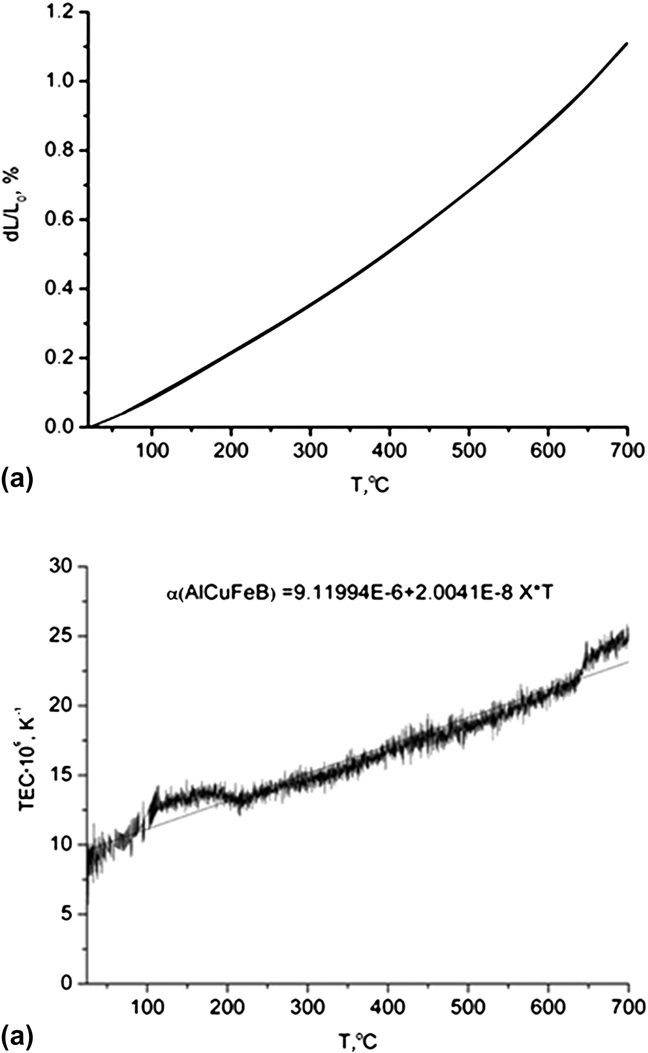
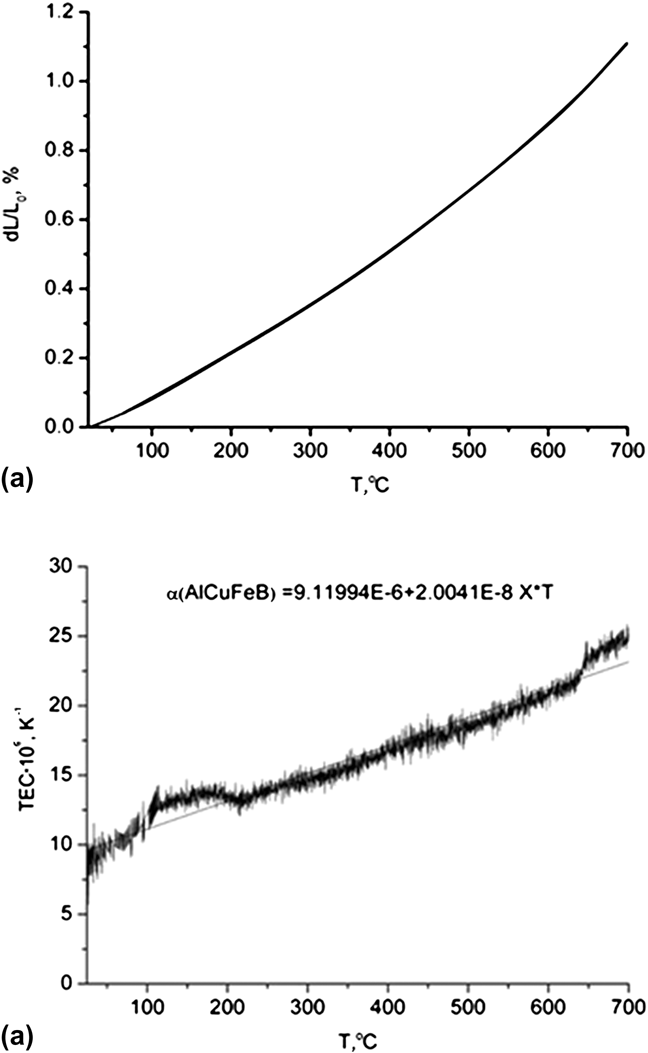
where α f, E f, ν f are the thermal expansion coefficient (TEC), Young’s modulus, and the Poisson’s ratio of the film, respectively, α S is the substrate TEC, and ΔT is the difference between deposition temperature (560 °C) and room temperature (20 °C). The following data were used for the calculation: α Si = 4 × 10⁻⁶K−1,Reference Mazur and Gasik25E AlCuFeB = 168 GPa, and ν AlCuFe = 0.23.Reference Takeuchi, Dubois, Thiel, Tsai and Urban21 Here, we have determined the TEC of an Al59.5Cu25.5Fe12B3 sample, similar to the initial target. Figure 7(a) shows the standard linear expansion dL/L 0 of the sample during heating. No hysteresis of the thermal expansion was observed. The first derivative of the linear expansion with respect to the temperature gives TEC values as a function of T (in units of 10−6 K−1), which are shown in Fig. 7(b). The TEC increases almost linearly from 10−5K−1 at 20 °C to 2×10⁻⁵K−1 at 560 °C. An average value of α AlCuFeB = 15×10−6K−1 has been used for the calculation of σ f. This value is close to that of the TEC of the related Al–Cu–Fe quasicrystalline phase α AlCuFe = 12.6×10⁻⁶K−1.Reference Quivy, Lefebvre, Soubeyroux, Filhol, Bellisent and Ibberson26
(a) Linear thermal expansion and (b) thermal expansion coefficient values of an Al59.5Cu25.5Fe12B3 sample measured by dilatometry.
Thus, for the Al–Cu–Fe–B films deposited on silicon at 560 °C, the thermal stress is tensile and equals about 1.3 GPa according to Eq. (5). Note that the value of stress in the film may differ from this calculated value due to the presence of a diffusion zone at the film/substrate interface (with presumably different chemical composition and thermal expansion coefficient).
Figure 8(a) summarizes the dependence of the residual stress in Al–Cu–Fe–B films with film thickness determined by both XRD and curvature methods. The stress values determined by XRD analysis are found to be close to 1.1 GPa for both films with thickness of 0.55 and 1.2 μm. Further increase of the film thickness leads to a slow decrease of the stress. The tendency becomes more pronounced for 2.6-μm-thick film. Such a behavior can be due to partial relaxation resulting from crack formation in the film.Reference Mézin27 At the same time, the curvature method seems to be insensitive to the development of cracks in this range of film thicknesses between 1.2 and 1.95 μm. This may be caused by the relatively low crack density in this thickness range and by the absence of delamination of the film. Also, the XRD method provides in-grain information, whereas the curvature method averages over both crystallites and grain boundaries. For films with h f ≤ 1.95 μm, the value of the tensile stress determined by the curvature method is close to that measured by the modified sin2ψ method and corresponds approximately to 1.1 GPa, i.e., close to the thermal stress estimated using Eq. (3) (1.3 GPa). This suggests that the main source of residual stress is the mismatch between the TEC of the film and substrate. It is worth mentioning that the estimated value of thermal stress in thin films is larger than the yield stress of bulk AlCuFe QCs. However, mechanical behavior of thin films can differ significantly from that of bulk materials due to smaller grain size, increased concentration of vacancies, etc.Reference Milman, Lotsko, Dub, Ustinov, Polishchuk and Ulshin28 As an example, the value of fracture strength for 2.55-μm-thick AlCuFe film on Si substrate estimated using white-beam synchrotron radiography was found to be 954 MPa.Reference French, Daniels and Bilello29 Further increase of h f results in a drastic decrease of σ as measured by the curvature method, which is correlated with partial interfacial delamination of the film.
(a) Internal stress values measured in Al–Cu–Fe–B thin films of different thickness using both sin2ψ and curvature methods. The horizontal dotted line indicates the estimated value of the thermal stress component in the film. Estimated values of the critical energy release rate necessary for cracking are also reported. (b) Optical microscope images showing the corresponding surface microstructures of the films.

Figure 8(b) shows SEM images of the film surfaces for different h f. As already mentioned, first cracks form in the range 1.2 ≤ h f ≤ 1.95 μm. It is known that through-thickness cracking (channeling) is usually the primary mode of failure for brittle films under tensile stress. Indeed, since a brittle crack propagates perpendicular to the main normal stress, stresses parallel to the interface naturally lead to through-thickness cracking.Reference Beuth and Klingbeil30, Reference Vlassak31 In the case of low interfacial adherence, the modification of the stress field resulting from the formation of the initial through-thickness crack may lead to the subsequent propagation of an interfacial crack.
The energy release rate G associated with through-thickness cracking (the energy needed for the crack propagation) is given byReference Beuth and Klingbeil30:
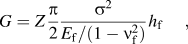
where Z is a constraint factor that depends on the geometry as well as differences in mechanical properties between film and substrate. In the case of Al–Cu–Fe–B films on Si substrate, Z is close to 1.Reference French, Daniels and Bilello29 Thus, for 1.2 ≤ h f ≤ 1.95 μm, the critical energy release rate can be bracketed by

Using the relation  ,Reference Strawbridge and Evans32 the same result can be written in terms of film fracture toughness K 1C:

Note that this range of values for K 1C is in agreement with earlier reports for bulk Al63Cu25Fe12 QCs (K 1C = 1.64 MPa )Reference Köster, Liu, Liebertz and Michel33 as well as for Al–Cu–Fe thin films deposited on Si substrate at room temperature and postannealed at 600 °C (K 1C = 1.9 MPa
 ).Reference French, Daniels and Bilello29 It should be noted also that the values of fracture toughness are rather comparable with the ones obtained for ceramic (about 2 MPa
 Reference Zhang, Sun, Fu and Du34) and intermetallic NiAl (2.2–2.9 MPa
 Reference Wellner, Kraft, Dehm, Andersons and Arzt35) films on silicon substrate, which reflects the substantial brittleness of the quasicrystalline film at ambient temperature.
V. CONCLUSION
We have investigated the residual stress in Al–Cu–Fe–B quasicrystalline thin films deposited by PVD on a Si(100) substrate at 560 °C using both XRD and curvature methods. We found that films are under tensile stress, leading to the formation of cracks and subsequent partial delamination of the film with increasing film thickness. The stress value determined by the curvature method before the appearance of cracks is close to those measured by the modified sin2ψ method and amount approximately to 1.1 GPa. An estimation of the thermal stress component induced by the mismatch of TEC between substrate and film suggests that thermal stress is the dominant component of internal stress. Finally, the energy release rate of the channeling crack was estimated corresponding to a fracture toughness of the quasicrystalline film of about 1.7 ± 0.4 MPa . This work suggests that other substrates having a TEC close to that of the Al–Cu–Fe–B quasicrystalline phase should be preferred in the future to reduce the internal stress in the films. Stainless steel substrate is an attractive candidate in this respect if interfacial diffusion can be overcome.
ACKNOWLEDGMENT
We acknowledge support from EU FP7-NMP-2007-SMALL-1 project AppliCMA, Grant CP-FP 214407-2.