Introduction
Silage corn is a fodder with high starch content, organic matter and digestible fibre, and low nitrogen. From an environmental perspective, its use helps to reduce the volume of manure and N (Salcedo, Reference Salcedo2011), emissions of NH3 (Merino et al., Reference Merino, Arriaga, Salcedo, Pinto and Calsamiglia2008), N2O (Arriaga et al., Reference Arriaga, Salcedo, Calsamiglia and Merino2010), enteric CH4 (Vellinga and Hovingy, Reference Vellinga and Hoving2010), carbon footprint (Nguyen et al., Reference Nguyen, Doreau, Corson, Eugène, Delaby, Chesneau, Gallard and van der Werf2013) and increases nitrogen recovered in milk with respect to intake (Arriaga et al., Reference Arriaga, Pinto, Calsamiglia and Merino2009; Dewhurst, Reference Dewhurst2013). The aim of this study was to estimate whether the partial substitution of pasture (surface) and grass (feed) by forages with known production and nutritive potential (maize or maize and Lolium multiflorum) and higher input needs (seeds, fertilizers, etc.) can contribute to reducing emissions of CO2-eq/kg of milk, using the simulation model DairyCant 1.0 (Salcedo and Perez, Reference Salcedo and Pérez2014).
Material and methods
This study was based on information from 49 dairy farms in Cantabria (Spain) derived from the research projects RTA2006-00132-C02-1 and 2012-0006512-05, funded by the National Institute for Agricultural Research (Spain) and project 05-640.02-2174, funded by the Ministry of Environment of the Government of Cantabria (Spain). Farms were classified according to their dedication to forage: 100% grassland (G), 20 farms; between 65% min to 89% max pasture and 10% to 35% maize (GM), seven farms; 19% to 88% pasture, 11% to 80%, 7% to 80% of maize and winter forage crops (GMWf), 22 farms. The information from each farm was obtained by individual survey, extrapolating the surface (total and dedication to forage); milk (quota year/kg cow, fat and protein); animals (dairy cows, dry heifers < or > 1 year); feed (kg/head and day); forage production and chemical composition of food (Salcedo, 2006 and 2011); and purchases (fertilizers, chemicals, concentrates, fodder, fuel, animals, seeds). The information collected was introduced into the dairy cattle simulation model DairyCant 1.0 (Salcedo and Perez, Reference Salcedo and Pérez2014) to estimate the CO2-eq kg milk, corrected for fat. The functional units used in this work are 1 kg energy corrected milk (ECM). The results were subjected to analysis of variance, including as fixed value the percentage of maize grown on the farm.
Results and discussion
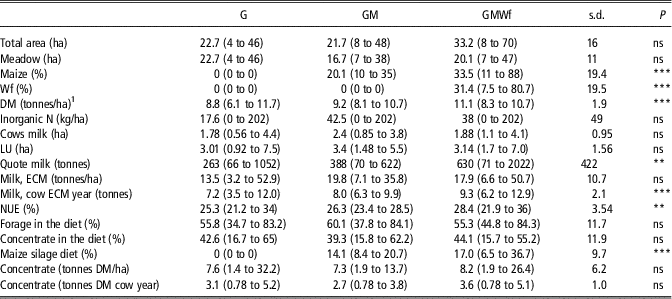
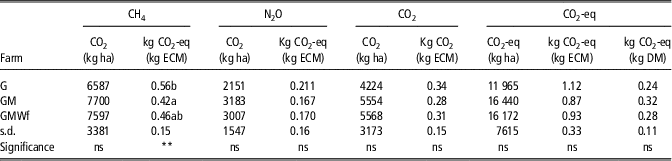
The most relevant characteristics of the farms of different forage dedication are indicated in Table 1. The supply of dry matter (DM) per hectare, cow milk production per year and nitrogen use efficiency (NUE) increased 70.3 kg milk solid (r 2=0.46, P<0.001); 63.7 kg milk production/cow per year (r 2=0.34, P<0.001) and 0.094 percentage units NUE (r 2=0.26, P<0.001), respectively, with increasing corn acreage. The percentages of CH4 (enteric and manure) by kg ECM estimated by DairyCant 1.0 are 50%, 48.2% and 49.6% for G, GM and GMWf, respectively, similar to the 50% indicated by Nguyen et al. (Reference Nguyen, Doreau, Corson, Eugène, Delaby, Chesneau, Gallard and van der Werf2013) for French dairy farmers who grow maize for silage. The CO2-eq/kg of DM forage produced did not differ between farms growing maize or not (Table 2), with mean values of 0.27±0.11 kg for a variable range from 0.09 to 0.52 kg. van Middelaar et al. (Reference van Middelaar, Berentsen, Dijkstra and de Boer2013) report emissions of 0.21 kg CO2-eq kg DM for maize silage, up slightly from 0.32±0.09 in GM and 0.28±0.09 in GMWf in the conditions of Cantabria. Fodder production represents 25.0±17% in G, 37.9±13% in GM and 31.3±12% in GMWf per kg ECM, less than the values of 40% and 58% in GM and G reported by Nguyen et al. (Reference Nguyen, Doreau, Corson, Eugène, Delaby, Chesneau, Gallard and van der Werf2013), attributed to increased milk production (16.4±10.7 v. 1.86 tonnes/ha), more cows per hectare (1.91±0.95 v. 0.64) and not to the production of milk per cow year (8.2±2.1 v. 7.8 tonnes).
Farm characteristics (means (minimum to maximum in parentheses))

DM=dry matter; ECM=energy corrected milk; NUE=nitrogen use efficiency.
1 Includes grass, maize and winter crops.
**P<0.01; ***P<0.001.
Contribution of different gases per hectare per litre ECM

ECM=energy corrected milk; DM=dry matter.
**P<0.01.
The average proportion of forage and concentrate included in the diet is similar between farms in Table 1, but not the CH4/kg ECM (Table 2), with a minimum of 0.31 and maximum of 1.05 kg CO2 kg ECM observed in 100% G. For all systems, the mean value is 0.49±0.14, slightly <0.54 kg reported by del Prado and Scholefield (Reference del Prado and Scholefield2008) on dairy farms in the United Kingdom. Individual milk production per cow (r=−0.69, P<0.01), the percentage of maize grown (r=−0.38, P<0.01) and included in the diet (r=−0.29, P<0.05) were negatively related to CH4/kg ECM in this study; with no significant relationship with the concentration of starch in the diet. The high starch content of corn silage promotes increased production of propionate at the expense of acetate, thus reducing the formation of CH4 per unit of fermented substrate (Beauchemin et al., Reference Beauchemin, Kreuzer, O’Mara and McAllister2008). Bypass starch fermentation does not produce CH4, whereas the digestion of fibre in the rumen does (Dijkstra et al., Reference Dijkstra, Oenema and Bannink2011). In this work the percentage of neutral fibre in diet was positively related to the CH4/kg ECM (r=0.29, P<0.05).
N2O production in kg CO2-eq per hectare and per kg ECM (Table 2), represented for the latter parameter 18.7%, 20.6% and 18.2% of the total CO2-eq for G, GM and GMWf, respectively, without differences between farms of different forage dedication. Most emissions were observed in G, agreeing with Nguyen et al. (Reference Nguyen, Doreau, Corson, Eugène, Delaby, Chesneau, Gallard and van der Werf2013), but the percentage difference relative to G is 14.2% and 19.0% for GM and GMWf, far below the 36.2%, possibly owing to the lower contribution inorganic nitrogen fertilizer on the farms in Cantabria (Table 2).
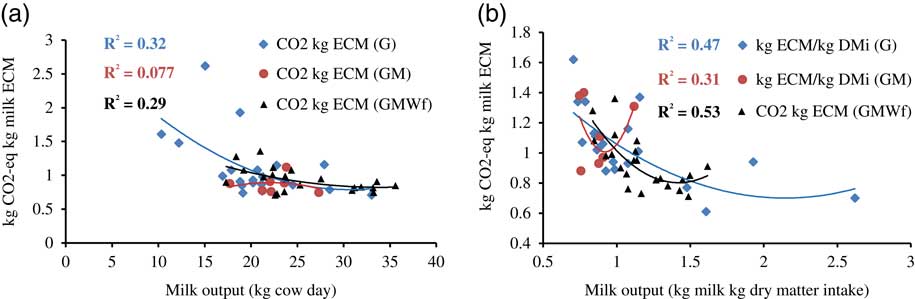
The kilos of CO2-eq/kg ECM vary from 0.71 to 2.62, with an average value of 1.0±0.3 kg/kg, the largest values seen in G (Table 2), attributable partly to production factors (Figure 1a) and gross efficiency (kg milk/kg DM intake, Figure 1b). The values obtained here are similar to the 1.03±0.14 kg CO2/kg ECM indicated by de Vries and de Boer (Reference de Vries and de Boer2010). As estimated by DairyCant 1.0 emissions fell by 22.3% and 16.9% in GM and GMWf with respect to G, higher than the 11.1% reported by Nguyen et al. (Reference Nguyen, Doreau, Corson, Eugène, Delaby, Chesneau, Gallard and van der Werf2013).
Relationship between milk production (a) and gross efficiency with CO2 kg ECM (b).

Conclusions
The highest values of CO2-eq/kg ECM were observed in the pasture-based systems. The culture of maize crop has an interesting potential for mitigating CH4/kg ECM. From an environmental perspective, the planting of winter forage crops does not improve CO2-eq. Information that defines the minimum percentage of maize cultivation that maximizes the mitigation of greenhouse gases in the soil and climate of Cantabria (Spain) is required.
Acknowledgement
The authors wish to thank the National Institute of Agricultural Research of Spain RTA project financing 2012-0006512-05.
Further information
The LiveM International Livestock Modelling and Research Colloquium was hosted by the Basque Centre for Climate Change (BC3) at the Maritime Museum in Bilbao, Spain between 14 and 16 October 2014. LiveM is the livestock and grassland modelling theme of the EU knowledge hub Modelling European Agriculture with Climate Change for Food Security (MACSUR). The MACSUR project is a pilot knowledge hub started by FACCE-JPI in 2012. It provides an opportunity to explore the role and potential of multi-disciplinary networking structures to address complex regional and global issues. More information on MACSUR and the LiveM theme can be found at www.macsur.eu, with PDFs of slides from conference presentations available through the conference website (http://www.livem2014bilbao.com/).