Introduction
A major 7.1-Richter earthquake struck nine km southeast of Darfield, 37 km from Christchurch, New Zealand at 4:35 am on Saturday September 4, 2010. It caused widespread damage to buildings, infrastructure, and to the economy of Christchurch city and surrounding areas. The city of Christchurch is home to 375,000 people1 but despite this magnitude of earthquake, only two Christchurch residents were seriously injured. There was an increase in cardiac-related admissions to Christchurch Hospital, with 18 more Cardiology patients than the 50 available Cardiology beds, but the number of patients in General Medicine was surprisingly stable. The hospital suffered relatively minor structural damage, and routine surgery was cancelled, but all emergency patient services remained open.
Nearly six months after the September earthquake, a magnitude 6.3 earthquake (the February earthquake) struck in the Port Hills, 10 km southeast of Christchurch, at a depth of only five km at 12:51 pm on Tuesday, February 22, 2011, causing 181 deaths,2 and more extensive damage to the city itself. Between 1,500 and 2,000 people were treated for minor injuries, and Christchurch Hospital alone treated 220 major trauma cases connected to the quake.
These effects contrast to a similar magnitude earthquake in Haiti measuring 7.0 on January 12, 2010, where the official death toll was set at 230,000 and local authorities estimated that many more were injured or homeless.3
Most earthquake medical literature focuses on the early response management or the psychological impact on first responders after disasters with mass casualties.Reference Alexander and Klein4, Reference Kreiss, Merin and Peleg5 Other reports look at how hospital services were maintained.Reference Bonomini, Stuard and Dal Canton6, Reference McIntyre, Hughes and Pauyo7 However, to date there have been no published data assessing the general impact on hospital staff of a natural disaster that did not cause such severe loss of life, but was large enough to cause significant damage and disruption to infrastructure and daily living. This questionnaire aimed to assess how the Christchurch earthquakes affected the staff in the General Medicine Department at Christchurch Hospital in different aspects of their lives, and to compare their responses after these two major events.
Methods
A cross-sectional questionnaire was used. It was divided into seven domains: (1) demographics; (2) personal impact; (3) psychological impact; (4) emotional impact; (5) impact on care for patients; (6) work impact; and (7) coping strategies. The psychological impact section was based on the Impact of Event ScaleReference Sundin and Horowitz8 and the emotional impact was modified from the Hamilton Rating Scale for Depression.Reference Hedlund and Viewig9 These tools were chosen as they have been used in many comparable psychological research studies and have been clinically validated.Reference Eid, Larsson and Johnsen10-Reference Olden, Rosenfeld, Pessin and Breitbart13 The questionnaires were handed out to General Medicine staff and students who attended the morning hand-over meeting on Monday, September 13, 2010, nine days after the earthquake. It was then repeated 14 days after the second major earthquake, on February 22, 2011. All responses were collected at the end of the meeting. The results were analyzed using an online survey application, Zoomerang (a SurveyMonkey business, PaloAlto, California, USA, available from www.zoomerang.com) and an Excel 2007 spreadsheet (version 12.0.6214.1000, Microsoft Corporation, Redmond, Washington, USA). Where apparent difference existed, these differences were tested using a chi-square test, with P < .05 taken as reaching statistical significance.
This project was part of the internal audit process undertaken in the Department of General Medicine, contained only anonymized data, and did not require ethics committee approval.
Results
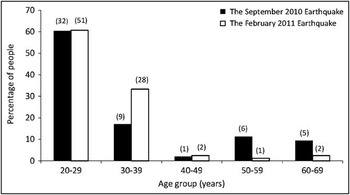
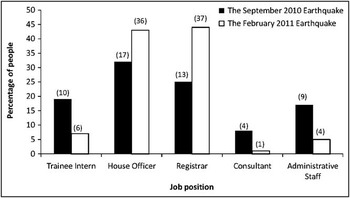
The total number of responses received was 53 (100% response rate) following the September earthquake and 84 out of 85 (99% response rate) following the February earthquake. The Questionnaire is detailed in the Appendix1. Approximately 60% of the cohort were in the age group below 30 years in both studies (Figure 1) and the majority of responders were female (62% in September vs 54% in February). Over 50% (30 out of 53) were either house officers or registrars in the September earthquake but there were significantly more people in these groups following the February earthquake (73 out of 84; Figure 2). In both surveys, most people had been working or studying in the hospital for at least two to three years.
Age distribution among staff/students who responded to the questionnaires. Numbers above each bar indicate numbers of respondents in age group. N = 53 for the September 2010 earthquake; N = 84 for the February 2011 earthquake.

Job position distribution among staff/students who responded to the questionnaire. Numbers above each bar indicate numbers of respondents in job position group. N = 53 for the September 2010 earthquake; N = 84 for the February 2011 earthquake.

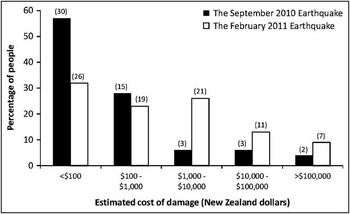
The financial damage was generally considered to be mild following the September earthquake. Over half of responders (30 out of 53) reported having less than NZ $100 worth of financial impact from the September earthquake, compared with 31% (26 out of 84) after the February event (P < .01). In September, 15% (8 out of 53) reported damage over NZ $1,000, compared with 46% (39 out of 84) in February (P < .001). There was a trend to more extensive damage in the February earthquake with 10% (7 out of 84) having over NZ $100,000 worth of financial loss compared with 4% (2 out of 53) in the September earthquake (P = .07, Figure 3). Within nine days of the September earthquake, a quarter of responders had already contacted their insurance companies to make a claim, compared with 50% within 14 days of the February earthquake. Approximately 80% knew somebody who had been affected majorly in the September earthquake. Families of almost one in 10 responders (8%) had to move to another place, city or town as result of the September earthquake but this rose to more than one in three (35%) following the February earthquake (P < .001). A fifth of staff/students (11 out of 53) had to find an alternative route of transport to get to work after the September earthquake compared with 38% (32 out of 84) after the February earthquake (P < .05). Only 8% and 18% took time off work due to these two earthquakes, respectively. None of the responders were physically ill as a result of the first event but 2% had a gastrointestinal illness following the February earthquake.
Personal financial impact among staff/students who responded to the questionnaire. Numbers above each bar indicate numbers of respondents in estimated cost of damage group. N = 53 for the September 2010 earthquake; N = 84 for the February 2011 earthquake.

Sixty-two percent (33 out of 53) of responders reported that they realized what was happening within 10 seconds compared with 81% (69 out of 84) following the February earthquake (P < .02). Approximately 90% responded initially by getting out of bed and standing under a door frame. Two people managed to sleep through it during the September earthquake with it occurring at 4:35 am.
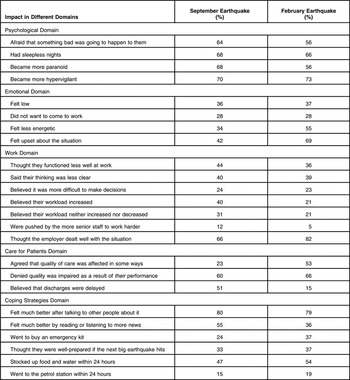
The impact that these earthquakes had on emotions, psychology, work, and quality of patient care is shown in Table 1. Most aspects of the psychological impact assessed were similar in the September and February earthquakes. People become subjectively more hypervigilant and paranoid following the earthquake and subsequent aftershocks, with 40% of people thinking less clearly and a quarter finding it difficult to make decisions. There was a trend towards less staff feeling paranoid following the February earthquake (56% vs 68%, P = .11). Significantly more people felt upset about the situation following the February earthquake compared with the September earthquake (69% vs 42%, P < .001). After each event, 80% felt much better talking to other people about the situation.
Percentage of Reported Impacts of Earthquakes in Various Domains

In this study, up to 28% reported they did not want to come to work. When they were at work, 40% thought their workload increased after the September earthquake but only 21% thought their workload increased after the February quake. With regard to health care delivery, the perceived delay in discharges dropped from 51% to 15% from the September to February earthquake. Two-thirds of staff denied quality of care was impaired as a result of their performance, but some agreed that the quality of care was affected in some ways.
Responders were also invited to express any comments concerning the situation, and these included:
● “Too many house surgeons and not enough registrars to cover out-of-hours.”
● “As a result of illness/stress of others/covered night shifts, employer did not find cover for the night Specialties Registrar and I covered both.”
● “Med school & Hospital seemed to have poor communication. Being a Trainee Intern it was very ambiguous as to whether we were wanted or needed and made it difficult to know whether we were expected or not.”
● “I think we should have a thank you dinner or drinks from the bosses for working hard throughout.”
Discussion
This questionnaire is a snapshot of the self-reported reactions and the broad impact of these earthquakes upon the General Medicine staff and students in two major earthquake incidents. The strengths of this study include the high response rate and that the questionnaire was conducted quickly after the earthquakes. This survey also assesses the impact of an earthquake with substantial damage but relatively few fatalities, on hospital staff in a developed country, as opposed to the majority of current literature which mainly relates to events causing mass casualties and high death toll and often involves developing countries.
Christchurch did not have to deal with mass casualties nor face huge infrastructure damage following the September earthquake but it did have to deal with this scenario following the February earthquake. The impacts were, however, relatively modest for 6.3 and 7.1 magnitude earthquakes striking close to a modern city. The financial damage of the September earthquake was small compared with the many billions of dollars lost in Haiti.3 The financial cost of the February Christchurch earthquake has yet to be established, but the New Zealand Treasury has estimated the total earthquake cost to be in the region of NZ $15 billion.14 The proportion of staff that contacted the New Zealand Earthquake Commission or their insurance companies for claims rose significantly following the February earthquake, highlighting the difference in damage resulting from the two events.
The psychological effect and consequent effects on quality of patient care were perhaps not unexpected. This compares to the effects seen in adolescents in the six months after the 2008 Wenchuan earthquake in China, where 16%, 41%, and 25% of participants reported clinical symptoms of post-traumatic stress disorder, anxiety, and depression, respectively.Reference Fan, Zhang and Yang15 The trend towards fewer staff feeling paranoid following the February earthquake may be due to the population getting used to aftershocks and becoming desensitized by them; also, some staff members affected by the September earthquake may have left the area prior to the February event. Significantly more people felt upset about the situation following the February earthquake, likely due to the substantial loss of life and the greater extent of damage to personal property and the city.
In the current study, for the 28% who did not want to come to work, their reasons included having trouble with transport, feeling low in energy or feeling upset about the situation. A comparable study is a survey of St John hospital staffReference Irvin, Cindrich, Patterson and Southall16 during an avian influenza pandemic in Michigan. Of these people, 8% reported they did not want to come to work if there were patients being treated for avian influenza at the hospital, although this study also has the possible effect of perceived personal health risk from the avian influenza. With regard to health care delivery, the perceived delay in discharges dropped following the February earthquake, possibly due to the discharge planning process which became more efficient as a result of the lessons learned during the first event.
Limitations
This study is a cross-sectional and retrospective survey. Its selection bias can be seen by the fact that most people in this survey are doctors below 30 years of age and are female.
Conclusion
This survey provides a measure of the general impact upon General Medicine staff at Christchurch Hospital following two major earthquakes. The effect was widespread, and included financial, personal, emotional, psychological and work aspects. The financial impact was relatively minor during the September earthquake, but was much greater in the February earthquake. The psychological effects and the perceived effects on quality of care were similar in both earthquakes. These data may be useful in measuring the effect of such events on hospital staff, which may help prepare plans for future natural disasters and help maintain delivery of health care services.
Appendix 1 . Earthquake Questionnaire
Impact of the Christchurch Earthquakes on Hospital Staff
Following the recent earthquake, please answer these questions honestly based on your own experience. The questionnaire should take <5 minutes of your time.
1) Demographics
1) Age ------------------------------
2) Gender ------------------------------
3) Nationality ------------------------------
4) Ethnicity ------------------------------
5) Current job (eg. 1st yr H/O, GM reg, TI, admin) ------------------------------
6) Time in this hospital (years, answer in months if <2 years) ------------------------------
2) Personal impact (Please write Yes or No in the spaces provided)
1) You, your house/flat or your belongings have been affected in some ways. ______
If yes, please circle the estimated amount of damage in financial terms
<$100 $100-$1,000 $1,000-$10,000 $10,000-$100,000 >$100,000
2) Your family or relatives have been majorly affected. ______
3) You know someone who has been majorly affected. ______
4) You had to contact your insurance company to make claims. ______
5) You were ill as a result of drinking contaminated water. ______
6) You had to find alternative transport to get to work. ______
7) You took some time off work to recover from this event. ______
8) Your family had to shift to stay at another place/ city/ town as a result. ______
9) How long did it take you to react and work out what was going on? ______Seconds_________Minutes________Hours_________Days
10) What was the first thing you do to react to the situation?______________________________________________________________________________________________________________________________________________________
For the following statements please rate your answers from 1 to 5 as follows:
I completely disagree I somewhat disagree Neutral I agree I strongly agree
1 2 3 4 5
3) Fright
1) You were afraid that something bad was going to happen to you. ▯
2) You were afraid that something bad was going to happen to your loved ones. ▯
3) You had a few sleepless nights. ▯
4) You felt more paranoid as a result. ▯
5) You felt more alert or hypervigilant. ▯
4) Mood
1) You felt low in spirits during the week. ▯
2) You felt helpless and in despair. ▯
3) You preferred to stay at home than coming to work. ▯
4) You did not feel like going out and doing new things. ▯
For the following statements please rate your answers from 1 to 5 as follows:
I completely disagree I somewhat disagree Neutral I agree I strongly agree
1 2 3 4 5
5) You felt less energetic. ▯
6) You felt bored because your workload was less than usual. ▯
7) You felt restless and fidgety. ▯
8) You felt upset about the situation. ▯
5) Care for patients
1) The quality of care was affected in some ways. ▯
2) The quality of care was impaired as a result of your performance. ▯
3) Discharges were delayed as a result. ▯
6) Work
1) You functioned less well at work due to lack of sleep. ▯
2) Your workload was increased. ▯
3) Your workload was decreased. ▯
4) You were pushed to perform harder than usual by the more senior staff. ▯
5) Your thinking was less clear than usual. ▯
6) It was more difficult for you to make any decision. ▯
7) Your employer dealt with the situation well. ▯
If not please comment on how it could be dealt better ____________________________________________________________________________________ ____________________________________________________________________________________ ____________________________________________________________________________________
7) Coping strategies
1) You felt much better talking to others about the event. ▯
2) You felt much better by reading more news from the paper/internet. ▯
3) You were well equipped with emergency kit at home. ▯
4) You are now well prepared if the next severe earthquake happens. ▯
5) You received constant support from family and friends. ▯
6) You stocked up plenty of food, water and essential items. ▯
7) You went to the petrol station within 24 hours to stock up on petrol. ▯
Thank you very much for taking time to fill in this survey. Your response will be analysed anonymously. This project is part of a General Medicine audit. Please place this in a box at the end of this meeting.