INTRODUCTION
The main purpose of most wheat (Triticum aestivum) breeding programmes is the development of high-yielding cultivars that possess good end-use quality acceptable to producers, processors and consumers. With an increasing concern for better end-use quality, wheat lines need to be tested for end-use quality from early generations to avoid the loss of time and additional cost associated with evaluation of undesirable advanced lines in replicated experiments. Efficiency in producing wheat cultivars with specific and desirable quality attributes depends greatly on the selection pressure applied and the availability of simple and reliable tests (Axford et al., Reference Axford, Mcdermott and Redman1979; Carter et al., Reference Carter, Morris and Anderson1999; Morris et al., Reference Morris, Paszczynska, Bettge and King2007).
Several small-scale testing methods, such as the sodium dodecyl sulfate (SDS) sedimentation test, the Pelshenke dough ball test and the Zeleny sedimentation test, have been developed for predicting the end-use quality of wheat. The SDS sedimentation test is reported to be one of the simplest and most effective small-scale tests for end-use quality assessment among early generation progenies of wheat breeding programmes (Axford et al., Reference Axford, Mcdermott and Redman1979; Carter et al., Reference Carter, Morris and Anderson1999). However, Ayoub et al. (Reference Ayoub, Fregeau-Reid and Smith1993) and Graybosch et al. (Reference Graybosch, Peterson, Shelton and Baenziger1996) found that the SDS sedimentation volume was influenced by protein concentration as well as environment, crop year and their interactions with cultivar. Some reports showed that the accuracy of the SDS sedimentation test in verifying quality differences between wheat genotypes and predicting the loaf volume might be improved by prolonged-swelling (soaking) time (Silvela et al., Reference Silvela, Ayuso, Gil–Delgado and Salaices1993; Takata et al., Reference Takata, Yamauchi, Iriki and Kuwabara1999).
In the past, the priority of wheat breeding programmes in the hot irrigated environment of Sudan was the introduction and optimization of wheat production in the marginal areas of the central clay plain of Sudan. Little attention was therefore given to the assessment of end-use quality of early generation lines in the breeding programmes. Hence, there is no information on the suitability of the known small-scale tests in predicting the bread-making quality of wheat genotypes in these environments. Many studies reported significant increases in flour protein content under heat stress conditions that were associated with decreases in SDS sedimentation volumes and dough mixing characteristics (Corbellini et al., Reference Corbellini, Canevar, Mazza, Ciaffi, Lafiandra and Borghi1997; Daniel and Triboi, Reference Daniel and Triboi2000). In contrast, Tahir et al. (Reference Tahir, Nakata, Ali, Mustafa, Saad, Takata, Ishikawa and Abdalla2006) found that the increase in protein content under a hot irrigated environment was associated with increases in SDS sedimentation volume and mixograph peak height. This suggested the uniqueness of the latter environment where heat stresses with temperatures higher than 35 °C repeatedly occur throughout the growing period (Tahir et al., Reference Tahir, Elahmadi, Abdalla, Ibrahim, Mohammed and Nakata2005; Reference Tahir, Nakata, Ali, Mustafa, Saad, Takata, Ishikawa and Abdalla2006). In the light of these contradictory reports, the evaluation of the traditional SDS sedimentation test for its ability to predict bread-making quality under such hot and irrigated environment is essential.
The objectives of this study were to examine the suitability of the conventional SDS sedimentation test in predicting bread-making quality and to investigate the effectiveness of a prolonged-swelling SDS sedimentation test in increasing the predictability of bread-making quality under heat stress conditions.
MATERIALS AND METHODS
Plant materials and experimental conditions
A set of 15 genetically diverse bread wheat genotypes was selected to include 40 years of genetic improvement from the breeding programme in the hot, dry but irrigated environment of Sudan. The materials were grown for two seasons (2000/01 and 2002/03) at the Gezira Research Farm (GRF), Agricultural Research Corporation (ARC), Wad Medani. The GRF is located on the heavy cracking clay plain of central Sudan (14°24′N, 33°29′E, 407 m asl). Two sowing dates, optimum and late (third week of November and second week of December, respectively), were used during both seasons. Even optimally sown wheat in the clay plain of central Sudan is subjected to sporadic heat stress during most of growth stages, and a late sown crop experiences very high temperatures during the grain-filling period (Tahir et al., Reference Tahir, Elahmadi, Abdalla, Ibrahim, Mohammed and Nakata2005; Reference Tahir, Nakata, Ali, Mustafa, Saad, Takata, Ishikawa and Abdalla2006). The experiment was arranged in a randomized complete block design with three replications in both seasons. For more details on genotypes used, experimental site, climatic conditions and cultural practices refer to Tahir et al. (Reference Tahir, Nakata, Ali, Mustafa, Saad, Takata, Ishikawa and Abdalla2006).
Measurements of grain quality parameters
Cleaned wheat grains were milled to whole meal in a UDY Cyclone Sample Mill (Udy Corp., Fort Collins, CO, USA) with a 1.00 mm sieve, and to flour in a Brabender Quadrumat Jr. Laboratory Mill (Brabender Inc., Germany) following method 26–50 (American Association of Cereal Chemists, 2000). Milled samples were stored in airtight containers until analyses were carried out. Flour protein content (PC) and insoluble protein content (IPC) were measured photometrically using the indophenol method (Tahir et al., Reference Tahir, Nakata, Ali, Mustafa, Saad, Takata, Ishikawa and Abdalla2006). Mixograph peak height (MPH), mixograph peak time (MPT), mixograph descending slope 2 min past peak (MDS) and mixograph curve width 2 min past peak (MCW) were carried out following method 54–40A (American Association of Cereal Chemists, 2000) as described in Tahir et al. (Reference Tahir, Nakata, Ali, Mustafa, Saad, Takata, Ishikawa and Abdalla2006).
The conventional SDS and the prolonged-swelling sedimentation tests were carried out following methods described by Carter et al. (Reference Carter, Morris and Anderson1999) and Takata et al. (Reference Takata, Yamauchi, Iriki and Kuwabara1999), respectively, with minor modifications. In brief, 20 g of SDS was dissolved in 1 l of distilled water and 20 ml of stock dilute lactic acid solution was added (one part lactic acid plus eight parts distilled water by volume) to prepare the SDS/lactic acid reagent. A 1 g whole meal sample was placed in a stoppered graduated cylinder (25 ml × 16 mm), 4 ml water was added, and the cylinders were then vortexed at 0 and 5 min. Five min after the last vortexing, 12 ml SDS/lactic acid reagent was added and the cylinders were inverted 10 times, rested for 2 min and inverted again 10 times. SDS sedimentation volumes were taken after 10 (SDSS10) and 30 (SDSS30) min of settle time.
For the prolonged-swelling SDS sedimentation test, samples were left in the graduated cylinders for 24 h. Two SDS sedimentation volume readings were taken for the extended swell time samples. The first reading was taken after 24 h (SDSS24BI) from the SDSS30 reading without inversion of the cylinders. Then the cylinders were inverted 20 times and the second sedimentation reading (SDSS24AI) was taken after 40 min from inversion.
Standard analysis of variance was performed for the combined data from each sowing date across seasons after testing the homogeneity of variance using GenStat Discovery Edition (GenStat- Seventh Edition (DE3). 2008. VSN International Ltd, Hemel Hempstead, UK). Simple correlation coefficients of SDS sedimentation volumes at different times with various quality attributes were calculated. The relationships between SDS sedimentation volumes at various times were evaluated by linearly regressing them with each other.
RESULTS
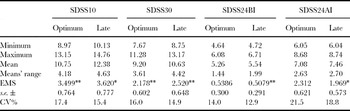
For the combined data from each sowing date across the two seasons, the SDS sedimentation volume after 10 min of settlement (SDSS10) detected significant differences among the genotypes studied at p ≤ 0.05 and p ≤ 0.01 under late and optimum sowing dates, respectively (Table 1). The SDS sedimentation volume after 30 min of settlement (SDSS30) also discriminated genotypes significantly (p ≤ 0.01) under both the optimum and late sowing dates. The SDS sedimentation volumes after a prolonged soaking of the samples for 24 h (before and after inversion) failed to detect differences among genotypes under the optimum sowing conditions. However, both SDS sedimentation volumes after (SDSS24AI) and before (SDSS24BI) inversion discriminated genotypes significantly at p ≤ 0.05 and p< 0.01, respectively, under the late sowing conditions (Table 1). The range of SDS sedimentation volumes at various times was always higher under the late sowing date than that under the optimum sowing date. The ranges of SDSS10 and SDSS30 volumes were higher than that of SDSS24BI and SDSS24AI under both sowing conditions (Table 1).
Minimum, maximum, mean and range of SDS sedimentation volumes (ml) at 10 min (SDSS10), 30 min (SDSS30), 24 h before inversion (SDSS24BI) and 24 h after inversion (SDSS24AI) of 15 bread wheat genotypes grown at two sowing dates for two seasons at the Gezira Research Farm, Wad Medani, Sudan.

EMS: error mean square.*, **: significant at p ≤ 0.05 and 0.01, respectively.
CV: coefficient of variance.
Highly significant (p ≤ 0.001) positive correlation coefficients were found between PC and SDS sedimentation volumes at various times for the wheat genotypes grown under optimum as well as late sowing conditions (Table 2). Similar, but relatively weaker, relationships were also found with IPC under both sowing conditions. For the mixograph parameters, only MPH showed highly significant (p ≤ 0.001) positive correlation coefficients with all SDSS volumes at various times under optimum sowing conditions. Under late sowing conditions, MPH was also the only mixograph parameter that showed significant positive correlation coefficients with all SDSS values at various times. Nevertheless, the correlation coefficients were lower than those for the optimum sowing date (Table 2). On the other hand, the MDS under late sowing conditions showed significant but negative correlation coefficients with SDSS10, SDSS24BI and SDSS24AI. MCW showed significant negative correlation coefficients only with SDSS10 under late sowing conditions (Table 2).
Correlation coefficients of SDS sedimentation volumes at various times with different bread-making quality attributes of 15 bread wheat genotypes grown at two sowing dates for two seasons at Gezira Research Farm, Wad Medani, Sudan.

PC = protein content, IPC = insoluble protein content, MPH = Mixograph peak height, MPT = Mixograph peak time, MDS = Mixograph descending slope 2 min past peak, MCW = Mixograph curve width 2 min past peak. *, ** and *** significant at p ≤ 0.05, 0.01 and 0.001, respectively. n = 30 for optimum and late sowings, and n = 60 for the combined data.
The correlation coefficients of total PC were always higher with SDSS10 than with other SDSS volumes under both sowing conditions except SDSS24AI under late sowing. In contrast, SDSS24AI and SDSS24BI had higher correlation coefficients with IPC, MPH and MDS under both sowing conditions than SDSS10 and SDSS30 (Table 2).
When the combined data of the two sowing dates across the two seasons were used, the relationship of SDSS volumes at various times with different quality attributes showed similar trends in most cases. The only apparent exception was that MDS showed highly significant (p ≤ 0.001) negative correlation coefficients with all SDSS volumes at various times (Table 2). In addition, MCW showed significant (p ≤ 0.05) negative correlation coefficients with SDSS10 and SDSS30 of the combined data for both sowing dates.
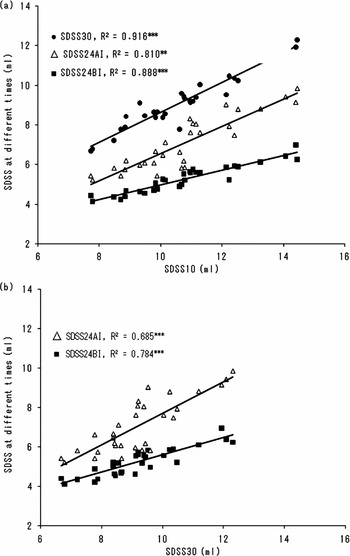
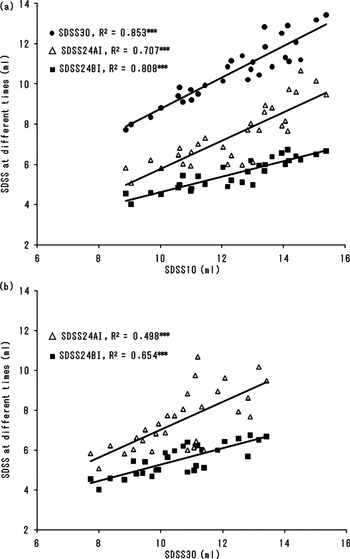
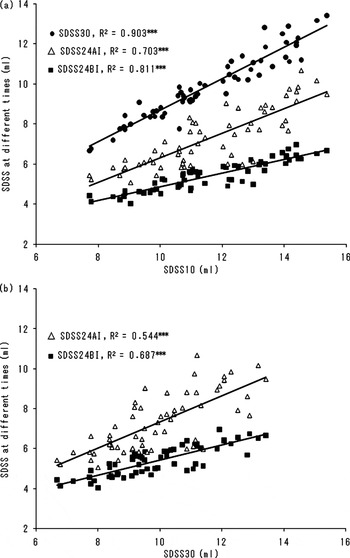
The relationships between the SDSS volumes at various times are presented graphically in Figures 1, 2 and 3. When SDSS10 was plotted against SDSS30, SDSS24AI and SDSS24BI volumes under optimum sowing conditions, highly significant (p < 0.001) coefficients of determination (R 2) were found. However, SDSS10 always showed a stronger relationship with SDSS30 followed by SDSS24BI (Figure 1). Similarly, SDSS30 showed highly significant (p < 0.001) associations with both prolonged-swelling SDSS volumes, and the relationship was stronger with SDSS24BI than with SDSS24AI. The relationships between various SDSS volumes at different times were not different under late sowing from that under optimum sowing conditions. However, the relationship among the different SDSS volumes was relatively weaker under late sowing conditions (Figure 2). The same trends of association between various SDSS volumes were also maintained when the combined data from the optimum and late sowings were used (Figure 3).
Relationship among various SDS sedimentation volumes under optimum sowing conditions, (a) relationship of SDSS10 with SDSS30, SDSS24BI and SDSS24AI, (b) relationship of SDSS30 with SDSS24BI and SDSS24AI.***Significant at p < 0.001, n = 30.

Relationship among various SDS sedimentation volumes under late sowing conditions, (a) relationship of SDSS10 with SDSS30, SDSS24BI and SDSS24AI, (b) relationship of SDSS30 with SDSS24BI and SDSS24AI.***Significant at p < 0.001, n = 30.

Relationship among various SDS sedimentation volumes for the combined data of optimum and late sowing dates, (a) relationship of SDSS10 with SDSS30, SDSS24BI and SDSS24AI, (b) relationship of SDSS30 with SDSS24BI and SDSS24AI. ***Significant at P < 0.001, n = 60.

DISCUSSION
The strong correlations of different SDSS volumes with most of the quality attributes measured in this study indicated the usefulness of the SDSS test in predicting bread-making quality under dry heat stress environments. This is in agreement with the well-documented relationship between SDSS volume and end-use quality under various growing conditions (Axford et al., Reference Axford, Mcdermott and Redman1979; Carter et al., Reference Carter, Morris and Anderson1999; Silvela et al., Reference Silvela, Ayuso, Gil–Delgado and Salaices1993). However, the absence of significant correlations with some of the quality attributes like MPT and MCW demonstrated the non-exclusiveness of the SDSS test for predicting all bread-making quality attributes. Some recently developed small-scale testing methods, such as the glutenin swelling index test (Wang and Kovacs, Reference Wang and Kovacs2002) and vital gluten swelling index test (Hu and Shang, Reference Hu and Shang2007), need to be evaluated for their suitability in predicting bread-making quality under heat stress conditions.
The analysis of variance results clearly showed that SDSS10 and SDSS30 significantly discriminated genotypes under both optimum and late sowing conditions. The two parameters also showed significant correlations with total PC, IPC and MPH under both sowing conditions. On the other hand, despite the significant correlation of SDSS24BI and SDSS24AI with PC, IPC and MPH, they could not identify significant differences between genotypes under optimum sowing conditions. Therefore, the prolonged-swelling SDSS tests did not improve the identification of differences among genotypes under heat stress condition over the conventional SDSS test. This was apparent also when the ranges of the SDSS volumes obtained by the prolonged-swelling test were compared with that of the conventional method. Our results in this respect partially disagreed with those of Silvela et al. (Reference Silvela, Ayuso, Gil–Delgado and Salaices1993) and Takata et al. (Reference Takata, Yamauchi, Iriki and Kuwabara1999). Nevertheless, though they might not be statistically different, the slightly higher magnitudes of correlation coefficients of SDSS24AI with IPC, MPH and MDS under both sowing conditions suggested a relatively small increase in the predictability of bread-making quality by prolonged-swelling. The improvement in the relationship of SDSS volume and some bread-making quality attributes, especially loaf volume, by prolonged-swelling was attributed to the increase of extracted solubilized protein during the swelling period (Takata et al., Reference Takata, Yamauchi, Iriki and Kuwabara1999). However, when the time required by the prolonged-swelling is considered and weighed against the slight increase in the predictability of some bread-making quality attributes, it can be concluded that the results obtained by the conventional SDSS test could be satisfactory and dependable.
The SDSS10 correlations with most of the quality attributes were always higher than that of SDSS30 under both sowing conditions. Similarly, the correlations of SSDS10 with all other SDSS volumes at various times were stronger than for SDSS30. These results suggested that SDSS10 will be suitable for evaluation of bread-making quality of early generation wheat lines in the hot irrigated conditions of Sudan and similar environments. However, SDSS30 can also be used for its better discrimination between genotypes under both sowing conditions and the relatively low coefficient of variation of the sedimentation data.
Heat stress is known to result in deterioration of some bread-making quality attributes (Daniel and Triboi, Reference Daniel and Triboi2000; Irmak et al., Reference Irmak, Naeem, Lookhart and MacRitchie2008; Tahir et al., Reference Tahir, Nakata, Ali, Mustafa, Saad, Takata, Ishikawa and Abdalla2006). However, the SDSS volumes measured at various times in this study significantly increased under late sowing conditions while other bread-making quality attributes like MPT, MDS and MCW showed significant decrease due to the heat stress during the late sowing period (Tahir et al., Reference Tahir, Nakata, Ali, Mustafa, Saad, Takata, Ishikawa and Abdalla2006). Therefore, despite the usefulness of SDS sedimentation volume as a simple test in predicting the bread-making quality of the early generation wheat breeding lines, it might not be recommended for the evaluation of the negative effects of heat stress on quality attributes. Instead, it has been suggested that MPT, MDS and MCW could be used as indicators of the negative effects of heat stress on end-use quality and to discriminate genotypes according to their ability to tolerate the effect of heat stress on the end-use quality (Tahir et al., Reference Tahir, Nakata, Ali, Mustafa, Saad, Takata, Ishikawa and Abdalla2006). Because of its relatively better association with MDS, SDSS24AI could be used for selecting wheat lines with better, and less adversely affected, grain quality under heat stress conditions; however, more investigations are needed.
The similarity in the trend of relationship of various SDSS volumes with different quality attributes under both optimum and late sowing conditions indicated genetic involvement in controlling these traits, and the possibility of further improvement by different breeding methods. However, the differences in magnitude of the relationship under optimum sowing from that under late sowing could be attributed to the environmental effects and their interaction with genetic effects and hence the continued need to evaluate materials under different environments.