

1 Introduction
Previous discussions about the consonant cluster /stɹ/ in English (Shapiro Reference Shapiro1995, Lawrence Reference Lawrence2000, Labov Reference Labov2001, Phillips Reference Phillips, Bybee and Hopper2001, Altendorf Reference Altendorf2003, Janda & Joseph Reference Janda, Joseph, Blake and Burridge2003, Durian Reference Durian2007, Bass Reference Bass2009) suggest that there is a sound change in progress involving the palatalization of /s/ to [ʃ], with the realization of /t/ as [tʃ] as a possibly related factor. The sound change seems to be led by the occurrence of the cluster when in the word-initial, syllable-initial position (e.g. string), although casual observations suggest that it may be spreading to the within-word (e.g. Australia) and across word (e.g. last road) positions as well. There have also been suggestions that a palatalized variant of /s/ is now occurring in other contexts, such as skill and school (Janda & Joseph Reference Janda, Joseph, Blake and Burridge2003). The putative change is spreading at different rates across speaker groups and regions, but in some parts of the USA /s/ palatalization in /stɹ/ could be considered to be the dominant form. Although most of the discussion so far has focused on American English, reports of this phenomenon have also attested its use in British English (Altendorf Reference Altendorf2003, Bass Reference Bass2009) and New Zealand English (Lawrence Reference Lawrence2000).
The majority of work on this sound change can be considered to be broadly sociolinguistic, and has therefore tended to formalize /stɹ/ as a sociolinguistic variable.Footnote 1 It has generally been stated as having two variants, although Labov (Reference Labov2001) and Durian (Reference Durian2007) acknowledge the possibility of at least one intermediate variant (see Section 2 below for further discussion). With this finite set of variants established, the social stratification (Labov Reference Labov2001, Durian Reference Durian2007, Bass Reference Bass2009) or diffusion patterns (Phillips Reference Phillips, Bybee and Hopper2001, Janda & Joseph Reference Janda, Joseph, Blake and Burridge2003) have been quantified and expressed. What has not yet been fully explored, however, is the precise phonetic nature of this sound change. Is it the case that the fricative used in the novel variant is identical to the [ʃ] found in other contexts in English? If there is an intermediate form, falling somewhere between a typical [s] and a typical [ʃ], might there in fact be multiple intermediate forms? The purpose of this paper is to explore these questions and present the results from a pilot study carried out in Southwest Louisiana, an area in which /s/ palatalization is extremely common. Of particular interest was the realization of the variable in four different phonological contexts (differing according to the proceeding vowel) and the acoustic similarities to other onsets involving alveolar or postalveolar fricatives. Comparisons are made with previous work on /stɹ/.
The paper is organized as follows. Section 2 below reviews the literature on this sound change and looks particularly at the methods employed to categorize its phonetic realization. Section 3 discusses some phonetic, phonological and acoustic properties of the cluster /stɹ/ as well as the /s/–/ʃ/ distinction. The observations made here form, in part, speculation as to the motivation behind this sound change. Section 4 details the methodology of this current study with the results being presented in Section 5. Section 6 discusses the implications of the results and Section 7 summarizes our current knowledge regarding this sound change and proposes future avenues of investigation.
2 Previous research on /stɹ/
Although the literature is still sparse, discussions of a sound change affecting the realization of the onset cluster /stɹ/ in certain varieties of spoken English are appearing with increasing frequency. Labov (Reference Labov, Baugh and Schezer1984) seems to be the earliest report of a palatalized fricative in words like street and strong, discussing its use in Philadelphia, Pennsylvania. Shapiro (Reference Shapiro1995) has suggested that this variability constitutes a sound change in progress, and one being caused by ‘distant assimilation’. He argues that this change is not found in clusters of the type /st/, as in stock or stake (see Janda & Joseph Reference Janda, Joseph, Blake and Burridge2003), and hence must be related to the presence of the liquid /ɹ/. In a response to Shapiro's assessment of the change, Lawrence (Reference Lawrence2000) argues that the change affecting the onset should be conflated with another sound change; that of the use of the postalveolar /ʃ/ in place of /s/ when before the affricate /tʃ/ at a word boundary. Lawrence (Reference Lawrence2000: 83) claims to have observed that ‘/t/ is always affricated in cases where /ʃtɹ/ is used’, and hence asserts that the change is not operating at a distance, but rather is a three-step change, incorporating the affrication of /t/.
The majority of the literature following Lawrence's discussion is more concerned with how the variable is patterning socially than with its phonetic realization or cause. Phillips (Reference Phillips, Bybee and Hopper2001), for example, mentions the sound change in a discussion of the role of lexical diffusion in the spread of new pronunciations, and suggests that the change is affecting words of high frequency before those of a lower frequency.Footnote 2 She reports that the majority of her thirty subjects, from the US state of Georgia, ‘had either all [s]s or all [ʃ]s but the two who had distinctly different pronunciations of straight vs. strait tended toward [ʃ] in straight and [s] in strait’ (Phillips Reference Phillips, Bybee and Hopper2001: 126). Phillips’ explanation is that the high frequency of straight within the lexicon would have made it the more likely candidate to be affected by the sound change. Phillips reports the use of some acoustic analysis to distinguish between the two variants, citing the fact that [s] is usually associated with higher spectral peaks than [ʃ].
Labov (Reference Labov2001), Janda & Joseph (Reference Janda, Joseph, Blake and Burridge2003), Durian (Reference Durian2007) and Bass (Reference Bass2009) all look at the social spread and stratification of the variable. Labov's discussion of the phonetic status of the variable is brief, but he notes that its realizations range from ‘a hissing [s], used only by cultivated speakers, to a normal sibilant with considerable hushing quality, to a fully hushing sibilant equivalent to the [sˇ] in sheet, and an even more extreme form with distinct rounding of the fricative’ (Labov Reference Labov2001: 206). In short, Labov is suggesting that this variable may have four variants. These seem to be [s], an intermediate from between [s] and [ʃ], a form of [ʃ] similar to that found in sheet and a form of [ʃ] presumably similar to that found in shoe. Labov's research found this particular variant to carry negative prestige. Interestingly, Janda & Joseph (Reference Janda, Joseph, Blake and Burridge2003) and Bass (Reference Bass2009) still treat the variable as being binary, with [s] and [ʃ] as its variants. Durian (Reference Durian2007) discusses the sociolinguistic patterning of the variable in the area of Columbus, Ohio, and notes that ‘the alveopalatal [ʃtr] is treated as the prototypical vernacular variant and alveolar [str] as the standard’ (p. 65). However, he later suggests that Columbus may in fact have a third realization of the variable, one which is neither [s] nor [ʃ] but is ‘an intermittent variant that is typified by an /s/ that shows retroflexion without pronounced rounding’ (p. 66). Like Phillips (Reference Phillips, Bybee and Hopper2001), Durian reports the use of some acoustic analysis to decipher between the three variants, but only in the case of ‘borderline tokens’. His method involves looking at the location of energy on a spectrum, and categorizing as [s] those tokens with energy above 4 kHz, categorizing as [ʃ] those tokens with energy at or below 2.5 kHz, and categorizing as the intermediate variant those tokens with energy between 3 kHz and 3.5 kHz. It is unclear whether the location of energy on the spectrum (Durian Reference Durian2007) was determined by measuring the spectral peak, the slope of the spectrum, or some other method.
In sum, the literature on this sound change in progress is limited, but evidence does suggest that the onset cluster /stɹ/ may now be functioning as a linguistic variable in many varieties of spoken English. The majority of information gathered is concerned with the social stratification of the sound change; how it is spreading through the lexicon and through the English-speaking world. Phonetically, there seems to be some disagreement as to how many variants of this variable exist. Is it a binary distinction, with [s] and [ʃ] being the only variants? Is it ternary with a single intermediate form (as suggested by Durian), or could there be multiple intermediate forms, as suggested by Labov? The remainder of this paper will explore these questions, beginning with some relevant phonological, phonetic, and acoustic considerations.
3 Some phonological, phonetic and acoustic considerations
The following discussion presents (i) an account of some phonological facts about the cluster /stɹ/, (ii) some phonetic characteristics of the onset itself and the fricatives /s/ and /ʃ/ in particular, and (iii) details of the acoustic nature of the /s/–/ʃ/ distinction. It is speculated that the phonological context of /s/ in /stɹ/ onsets may be facilitating a phonetically motivated harmonizing process.
3.1 Phonological aspects of /stɹ/
Two observations can be made about the status of /stɹ/ in the phonology of English that could be related to this sound change:
(i) /s/ in the C1 position of ternary onsets is in a single-item system;
(ii) while English has numerous words with an /ʃɹ/ onset, /sɹ/ onsets are ill-formed.
Regarding (i), the onset of a syllable in English has the potential to be a branching structure. Words such as pray exhibit a binary branching onset, whereas words such as string exhibit a ternary branching onset. The phonotactic constraints of English are such that an onset may contain a maximum of three consonants. In binary onsets, and where C1 is a plosive, C2 is always an approximant. Therefore, one possible combination is C/r/, where C can be realized as any member of the system {/p b t d k g f Ɵ ʃ/}. This yields words such as as pray, bright, trend, drone, cruel, groan, frost, threat, and shrill. Importantly, /s/ does not occur in this set and onsets of the type /sɹ/ are ill-formed in English. It is likely that for this reason, many speakers of English will pronounce word-initial orthographic 〈sr〉 as [ʃɹ] (e.g. Sri Lanka).
Ternary branching onsets are formed by adding /s/ to the beginning of the binary onset types C/ɹ/ and C/l/. When /s/ is added to the type C/ɹ/ the contrast between the voiced and voiceless plosives that usually occurs in C/ɹ/ is neutralized. The means the C in /s/C;/ɹ/ onsets can only be filled by /p/, /t/, or /k/, as shown below.

Within a polysystemic model of phonology, as in Prosodic Analysis (see Firth Reference Firth1948; Henderson Reference Henderson1949; Lass Reference Lass1984: 163–166; Local Reference Local2003), the fact that /s/ is not in a system of contrast with any other English phoneme in the position of C1 is important. In polysystemic phonology, a sound's behavior is interpreted according to the system of contrasts it appears in. The fricative /s/ would be expected to exhibit different phonetic exponents in different sub-systems based on the other sounds in that system. In the case of /stɹ/, the production and perception of the phonetic parameters associated with /s/ may be different when it occurs in a multi-item system. For example, the perceptual identification of words like strict may rely less on the acoustic information associated with C1 than in words like sock. It is quite possible that the mere presence of high-frequency frication would be sufficient to contrast strict from tricked. This may also help explain why many speakers do not easily perceive the difference between [stɹ] and [ʃtɹ] (Janda & Joseph Reference Janda, Joseph, Blake and Burridge2003). However, the contrast between sock and shock relies on the precise acoustic nature of the initial frication. It has been suggested by Blevins (Reference Blevins2005) that sound changes are more likely to occur in items where acoustic detail is less important for successful retrieval from the lexicon. This may be the case with this sound change where speakers are not required to use contrast-enhancing articulatory characteristics, but can in fact vary the production of the C1 quite considerably. This would also mean that the need to produce a canonical /s/ or /ʃ/ is eliminated, allowing intermediate forms falling somewhere between the two.
3.2 Phonetic aspects of /stɹ/
The cluster /stɹ/ is typically produced with initial frication at the alveolar ridge followed by a momentary occlusion at the alveolar ridge which is released into the approximant /ɹ/. Speakers of American English vary in how they produce /ɹ/ with some using tongue bunching and some using retroflexion (Delattre & Freeman Reference Delattre and Freeman1968). The bunched variety involves raising the tongue body to the velum, while the retroflex, or ‘curled r’, involves curling the tongue tip back toward the palate. There is also a certain amount of lip-rounding associated with /ɹ/. In these cases a transcription of [ɹʷ] is often used, where in extreme cases puckering of the lips can occur (Ogden Reference Ogden2009: 91). This can, in turn, cause lip-rounding in preceding plosives due to anticipatory coarticulation, or gestural overlap (Ladefoged Reference Ladefoged2006: 69). There is also some variability associated with the constriction degree of /t/ which can be affricated ([tʃ]) (see Laver Reference Laver1994: 366).Footnote 3 Until reports of the current sound change in progress emerged, little variation was thought to be associated with the /s/.
If /s/ is moving toward [ʃ], it is important to fully explicate the phonetic changes that would be involved. It is proposed that they involve at least three phonetic parameters. Firstly, [s] is created with the tongue tip or body near the alveolar ridge while [ʃ] involves a tongue position that is slightly more posterior, at either the anterior portion of the hard palate or the posterior portion of the alveolar ridge. For this reason, it is usually called either postalveolar or palatoalveolar. This parameter is concerned with tongue placement. The second difference between the two sounds is in tongue shape. The fricative [s] is a ‘grooved’ fricative, where air is directed down a very narrow, central path. The fricative [ʃ], on the other hand, is a ‘slit’ fricative, with a flatter, broader quality to the tongue (Ball & Müller Reference Ball and Müller2005). This parameter can be considered a difference in tongue shape. Finally, in most dialects of English the two sounds differ according to the amount of lip-rounding that is typically involved in their production. Unless followed by a rounded vowel, [s] only involves slight labialization, whereas [ʃ] is considered to be ‘strongly labialized’ (Ladefoged Reference Ladefoged2006: 65). This can be considered a difference in lip shape.
Taking these three parameters into account, it can be seen that there is a greater similarity between /ɹ/ and /ʃ/ than between /ɹ/ and /s/. Both /ɹ/ and /ʃ/ share the feature of pronounced lip-rounding, which /s/ lacks this in its neutral form. Also, for many speakers, both /ɹ/ and /ʃ/ share a tongue position that is further back than /s/, closer to the posterior alveolar ridge or anterior palate. A change from /s/ to /ʃ/, then, in the context /ɹ/ could be seen as a harmonizing process, possibly incorporating rounding and retraction of the /t/.
It is also worth noting that changes in one of the phonetic parameters discussed above may not necessarily co-occur with changes in the other two. This is particularly true of the parameter lip-rounding, whose variance is likely to be quite independent from the activities of the tongue. If intermediate forms do exist, it may well be because the parameters associated with [s] are shifting toward [ʃ] at differing rates. If tongue shape and position adopt the articulatory settings of [ʃ] before lip shape, an intermediate, palatalized but non-labialized allophone would occur.
3.3 Acoustic properties of the /s/–/ʃ/ distinction
The set of sibilant fricatives (which both /s/ and /ʃ/ are members of) is characterized by high frequency, high amplitude spectral energy owing to the presence of the teeth anterior to the critical constriction. It has been suggested that properties such as duration or amplitude are not particularly helpful in distinguishing between sibilant fricatives (LaRiviere, Winitz & Herriman Reference LaRiviere, Winitz and Herriman1975); however, Maniwa, Jongman & Wade (Reference Maniwa, Jongman and Wade2008) report that /ʃ/ is often produced with greater overall amplitude.Footnote 4 Therefore, in order to consistently distinguish /s/ from /ʃ/, it is generally acknowledged that spectral analysis is the most reliable approach. Because the spectral energy of fricatives is largely determined by the size and shape of the cavity in front of the constriction (Pickett Reference Pickett1999: 119), /s/ is usually associated with high spectral energy, above 4 kHz, whereas /ʃ/, which has a larger anterior cavity size, is associated with lower spectral energy, below 3.5 kHz (Reetz & Jongman Reference Reetz and Jongman2009). If lip-rounding is present in the production of [ʃ], this serves to further lengthen the anterior cavity and hence lowers frequency values even more. As a result, the additional parameter of lip-rounding further enhances the acoustic difference between /s/ and /ʃ/ (Johnson Reference Johnson2003: 127). A study by Jongman, Wayland & Wong (Reference Jongman, Wayland and Wong2000) considered various acoustic measurements (temporal, amplitudinal, and spectral) that can be used to classify fricatives. The authors found that among the spectral measures, the use of either spectral peak or spectral moments alone was sufficient to consistently distinguish between /f v/, /Ɵ ð/, /s z/, and /ʃ ʒ/.
4 Experimental study
4.1 Research questions
There is an increasing amount of sociolinguistic research looking at the variable /stɹ/ in English. While acoustic analysis has been used to aid in the categorization of the variable as one of several variants, there has been no reported comparison between speakers’ productions of /stɹ/ and their productions of /s/ and /ʃ/ in other onsets. Equally, there have been suggestions of intermediate forms, falling between /s/ and /ʃ/, of which there seems to be only limited experimental evidence.
In this study the relationship between /stɹ/ and the onsets /s/, /ʃ/, and /ʃɹ/ will be considered in ten speakers from Southwest Louisiana. As discussed above, this is an area where the sound change is in a very advanced stage, particularly among younger speakers. The specific research questions of this study are:
(i) How does the fricative in the variable /stɹ/ compare to the same speakers’ productions of the fricatives in the onsets /s/, /ʃ/, and /ʃɹ/?
(ii) Is there evidence of fricative productions in /stɹ/ that are atypical of /s/, /ʃ/, or /ʃɹ/, therefore supporting previous claims for intermediate forms of this sound change?
The method adopted to answer these questions is discussed in next section.
4.2 Method
4.2.1 Subjects
Ten female subjects aged between 18 and 19 were recruited from the University of Louisiana at Lafayette campus. Subjects were native speakers of Southwest Louisiana American English. Female subjects were used because the frequency range of fricative spectra has been shown to differ according to vocal tract length (Munson, McDonald, DeBoe & White Reference Munson, McDonald, DeBoe and White2006). Subjects reported normal hearing and no history of speech or language disorders. They had not received any formal education in linguistics or phonetics. They volunteered for the experiment without monetary compensation. Subjects will be referred to throughout using two-letter subject identifiers (e.g. MC). No form of sociolinguistic profiling was carried out in advance to discern the speech patterns of the subjects. However, because this particular sound change is extremely widespread among young, university-aged speakers in the Southwest Louisiana area, it was anticipated that a large proportion of the subjects would exhibit at least some evidence of its use.
4.2.2 Materials
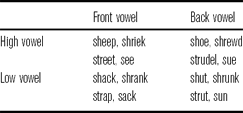
Sixteen target words were selected that exhibited the use of the four onset types /s/, /ʃ/, /ʃɹ/, and /stɹ/ occurring before the four vowels /ɪ/, /æ/, /ʌ/, and /u/, as shown in Table 1. These vowels were chosen because they represent the four possible combinations of the two parameters: height: high or low and anteriority: front or back.Footnote 5
Target words used in the study.

The sixteen target words were mixed with 64 dummy filler words (all one- or two- syllable words) and embedded in the carrier phrase Say X again, where X becomes the target word. The same carrier phrase was used for all target words to reduce the possibility of contextual factors like stress or utterance type (e.g. statement vs. question) affecting the variable under investigation.
The sentences containing the target words were pseudorandomly distributed amongst the filler sentences so as to maintain a maximal distance between target words themselves (appearing every four sentences), the onset types (each appearing every sixteen sentences), and the vowel contexts (each appearing every sixteen sentences). In addition to this, four different orders were generated and these were randomly assigned to subjects.
4.2.3 Procedure
The subjects were seated alone in a sound-attenuated booth (ordinarily used for hearing tests) with the sentences on paper in front of them. Subjects were instructed to read the sentences as if they were engaged in a normal conversation with another speaker and were given the opportunity to practice the first sentence a few times before proceeding with the rest. Subjects were also instructed to try and maintain a stable mouth-to-microphone distance in order to facilitate intensity measurements.
Recordings were made at a sampling rate of 22 kHz using a Sony Hi-MD field recorder (Sony MZM200) and a Sony ECM-MS957 microphone. The recordings were then transferred to a laptop computer running Windows XP and converted to WAV files for analysis. The sixteen sentences containing the target words were then extracted from the matrix file using Praat (Boersma & Weenink Reference Boersma and Weenink2010) and saved as individual files.
4.2.4 Acoustic analysis
Durian's (Reference Durian2007) method of acoustic analysis draws on the fact that retraction of the constriction location in a fricative tends to lower the spectral peak associated with the fricative noise. However, Durian does not report any comparison between speakers’ production of canonical /ʃ/ or /s/ in similar phonological environments (in a prevocalic position, for example). Instead, analysis of absolute values for the variable /stɹ/ were used and methods of categorization were speaker-invariant. In this present investigation, a comparative method was adopted in order to investigate how spectral peak in /stɹ/ compared to the same speaker's production of /ʃ/, /ʃɹ/, and /s/. As noted in Section 3.3 above, spectral peak has been found to be a stable method for consistently distinguishing place in English fricatives (Jongman et al. Reference Jongman, Wayland and Wong2000).
The frequency of the major spectral peak of the fricatives was calculated using the method discussed in Jongman et al. (Reference Jongman, Wayland and Wong2000). To summarize, a 40 ms Hamming window was placed in the center and/or steady state of the fricative noise. If the center was not deemed to be in a steady state, based on visual inspection of the spectrogram, the leftmost steady state was chosen. The left side was used to avoid anticipatory coarticulation affects. Generally speaking, however, the center of the fricative noise was found to be steady and suitable for placement of the Hamming window. Both FFT (fast Fourier transform) and LPC (linear predictive coding) were used to generate the fricative spectra. The major spectral peak was measured on the FFT spectra and was defined as the frequency location of the peak with the highest amplitude.
4.2.5 Statistical analysis
All statistical analysis was carried out using SPSS. The two-way repeated measures analysis of variance (ANOVA) with the factors onset-type and vowel did not include the onset /stɹ/ because it could not be assumed that the phonetic target for this onset was the same for all speakers, and was therefore unlikely to be a normal distribution.
5 Results
5.1 Preliminary observations
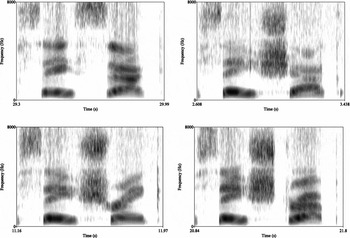
Auditory analysis and transcription of the recordings revealed what seemed to be a variety of /ʃ/ like fricatives in the onset /stɹ/ as well as some more /s/-like productions. However, repeated listening of isolated fricatives using Praat suggested that tokens that were impressionistically transcribed as /s/ were in fact acoustically more like /ʃ/. This was supported by visual inspection of the spectrograms, which revealed that for the majority of subjects the onset /stɹ/ was being produced with high amplitude frication extending to the lower frequency ranges. In most cases this was very similar to both the /ʃ/ and /ʃɹ/ onsets. The four spectrograms in Figure 1 are MC's productions of the four target onsets before the vowel /æ/: sack, shack, shrank, and strap. The word say from the carrier phrase has been included in all four spectrograms. Note that in the final spectrogram, say strap, the fricative in strap has a low frequency cut-off point very similar to the other /ʃ/ onsets.
Spectrograms for MC's productions of ‘say sack’ (top left), ‘say shack’ (top right), ‘say shrank’ (bottom left), and ‘say strap’ (bottom right).

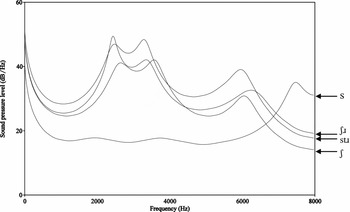
Figure 2 shows the four spectra extracted from the steady state of the fricatives shown in the spectrograms above. Linear predictive coding (LPC) to three peaks has been used to smooth the spectra for visualization. The four onset types are marked on the right of the figure. As with the spectrograms in Figure 1, the onset /stɹ/ can be seen to pattern with both /ʃ/ and /ʃɹ/, exhibiting a major spectral peak between 2000 Hz and 4000 Hz and a gradual loss of energy in the higher frequencies. The alveolar fricative, on the other hand, exhibits its major peak between 6000 Hz and 8000 Hz. There is a noticeable difference in amplitude, with the three palatalized spectra exhibiting higher overall amplitude in the 0–8000 Hz range.
LPC spectra for MC's productions of /s/, /ʃ/, /ʃɹ/, and /stɹ/.

5.2 Categorization of /stɹ/
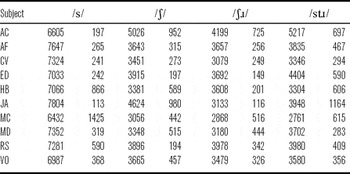
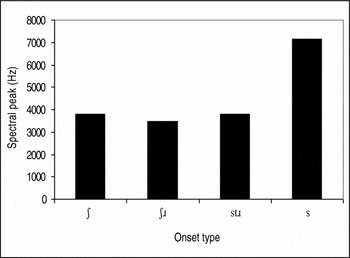
As discussed above, spectral peak location was measured using a 40 ms Hamming window to generate an FFT spectrum of the central and/or steady state of the frication in all four vowel contexts for all four onsets for the ten subjects. This totaled 160 tokens (4 vowels × 4 onsets × 10 subjects). Table 2 shows the mean values for spectral peak location across all vowels for each speaker (left column) and the standard deviation of the distribution (right column). Figure 3 displays mean spectral peak of all ten subjects vs. onset type.
Mean spectral peak measurements (Hz) across all four vowel contexts for each speaker (left) and the standard deviation of the distribution (right).

Mean spectral peak location for each onset type across all ten subjects.

To test the extent to which spectral peak location could be successfully used as a method of distinguishing /s/ from /ʃ/, a two-way repeated measures ANOVA with the factors onset type (/ʃ/, /ʃɹ/, /s/) and vowel (/i/, /æ/, /ʌ/, /u/) was carried out. This revealed that the effect of onset on spectral peak was significant (F(2,18) = 215.533, p < .001) as was the effect of vowel (F(3,27) = 4.597, p = .010). However, the interaction of onset × vowel (F(6,54) = 1.568, p = .174) was insignificant. Bonferroni post hoc tests indicated that there were significant differences between the onsets /ʃ/ and /s/ (p < .001) and /ʃɹ/ and /s/ (p = < .001) but that the difference between /ʃ/ and /ʃɹ/ was not significant (p = .106).
Based on the statistical analysis, speaker ranges for /ʃ/ were calculated by conflating their realizations of /ʃ/ and /ʃɹ/. Tokens of /stɹ/ were then categorized as /s/, /ʃ/, or intermediate based on whether they fell within a speaker's range for /s/, /ʃ/, or between the two. The analysis revealed that for four of the ten subjects all four realizations of /stɹ/ fell within the range of measures recorded for /ʃ/. This suggests that their productions of /stɹ/ could be categorized as being typical of their canonical /ʃ/ based on measurement of spectral peak. For five of the ten subjects, three of the four realizations of /stɹ/ fell within the range of /ʃ/, with a single production falling outside the range. For these five subjects, two had a production of /stɹ/ that fell below their range for /ʃ/ and four had a production that fell above their range of /ʃ/. However, none of these measures fell within the same subject's range for /s/. For one speaker, ED, three of her /stɹ/ productions fell above the range for /ʃ/. These were strap, struck, and strudel, with strudel falling 1011 Hz above her /ʃ/ range.
The greatest deviation from the range for /ʃ/ was subject ED, who had a range of 3573–4145 Hz for /ʃ/ and a production of strap that was 5156 Hz (1011 Hz above her range for /ʃ/). ED's lowest production of /s/ was 6692 Hz so her production of strap falls between the two ranges although closer to /ʃ/. The highest spectral peak measured for /stɹ/ was 5634 Hz for subject JA. However, JA had a measurement of 5615 Hz for sheep and her lowest spectral peak for /s/ was 7750 Hz for sue. The lowest spectral peak measurement for /stɹ/ was MC's production of strudel, which had a peak of 2159 Hz. This is 225 Hz lower than her production of shrewd, at 2384 Hz.
A comparison of the ranges associated with each onset revealed that /stɹ/ exhibited a greater range across all speakers than /ʃ/ or /ʃɹ/ but slightly lower than /s/ (/ʃ/ = 3371 Hz, /ʃɹ/ = 2884 Hz, /stɹ/ = 3503 Hz, /s/ = 3593 Hz). Individual speaker standard deviations were calculated and compared across onset types. The mean of the individual speaker standard deviation was highest for /stɹ/ (/ʃ/ = 491.47 Hz, /ʃɹ/ = 332.29 Hz, /stɹ/ = 548.22 Hz, /s/ = 462.43 Hz). However, a one-way ANOVA (F(3,36) = 215.533, p < .417) found this difference to be non-significant.
5.3 Analysis of intermediate forms
Previous reports have suggested that the /ʃ/ in the onset /stɹ/ varies in the extent to which it exhibits lip-rounding. This has resulted in three or more variants being posited for the sociolinguistic variable /stɹ/. Considering the data analyzed for this study, there is some, albeit limited, evidence of such variability in the subjects’ productions. Two subjects in particular, MC and ED, seemed to exhibit two different types of /ʃ/ in /stɹ/: one with a very low spectral peak, and one with a very high spectral peak.
The subject MC, for example, had a very low spectral peak measurement for strudel (2159 Hz). This is likely related to extreme rounding of the lips, further increasing the size of the cavity anterior to the constriction point and thus emphasizing lower frequencies. However, MC also had a very low spectral peak measurement for shrewd (2384 Hz). It should be noted that both these tokens involve the high back rounded vowel /u/, which commonly causes anticipatory lip-rounding. MC's production of struck was also low, 2478 Hz, and was actually lower than any of her other measurements for /ʃ/ besides shrewd. Her productions of street and strap fell within the range of her normal /ʃ/.
An example of a variant of /stɹ/ that seemed to fall above the range of measures for /ʃ/ was ED's production of strap. This had a spectral peak of 5156 Hz. Impressionistically, this sounded very much like an alveolar fricative; however, it fell considerably lower than her lowest /s/ production (6692 Hz for sue). Again, it should be noted that the vocalic context seems to be affecting the spectral peak measurement, with /u/ causing a lowering of the peak. In ED's production of strap it may be the case that tongue position and tongue shape are approximating /ʃ/ but that there is a complete absence of lip-rounding. The vowel /æ/ in strap would facilitate this, with no anticipatory lip-rounding occurring. ED's productions of struck and strudel were also above her /ʃ/ range, recorded as 4388 Hz and 4360 Hz, respectively, although her highest /ʃ/ was 4145 Hz for sheep.
6 Discussion
The two-way repeated measures ANOVA demonstrated that the measurement of spectral peak successfully distinguishes the sibilant fricatives /ʃ/ and /s/ (thus supporting the findings of Jongman et al. Reference Jongman, Wayland and Wong2000). The onsets /ʃ/ and /ʃɹ/ were not found to be significantly different. This may be because the measurement of the spectral peak was taken from the steady state and/or central portion of the fricative noise. If a peak location was taken from the final 20 ms of the same noise, the influence of lip-rounding from the /ɹ/ may be more likely to be found. Regardless, it seems that the measurement of spectral peak using the method discussed above and in Jongman et al. (Reference Jongman, Wayland and Wong2000) is a viable method for analyzing future data related to this sound change. However, it is important to stress that the spectral peak measures for the variable in individual speakers must be compared to their productions of /ʃ/ and /s/. In the research reported by Phillips (Reference Phillips, Bybee and Hopper2001) and Durian (Reference Durian2007), spectral analysis was carried out without any reported comparison to the subjects’ other fricative productions. If Durian's cut-off points (discussed above) had been used for the data reported in this study, several of the tokens of /stɹ/ would have been categorized as /s/ when in fact they were typical of the subject's productions of /ʃ/. This was the case for AC in particular, who had a range of 4182–5662 Hz for /stɹ/ but a range of 3684–5905 Hz for /ʃ/.
Analysis of spectral peak measurements for subjects’ productions of /stɹ/ found that only six out of forty tokens (15%) did not fall within the range for that individual speaker's productions of /ʃ/ (where /ʃ/ had been conflated with /ʃɹ/). This indicates that for these ten subjects the vast majority of fricatives in the onset /stɹ/ are typical of their production of a canonical /ʃ/. For the six tokens that fell outside the range of /ʃ/, none were within the range of /s/, with the greatest deviation being 1011 Hz. One possible explanation of this seemingly intermediate form, and possibly some of the other tokens that fell above the speakers' ranges for /ʃ/, is that there do exist variants of the variable /stɹ/ that involve palatalization but lack lip-rounding (as suggested by Labov Reference Labov2001 and Durian Reference Durian2007). These forms may appear as speakers gradually move from something that is very /s/-like in nature to something that is very /ʃ/-like. This would meld with previous observations of sound changes being phonetically gradual, as opposed to phonetically abrupt (e.g. Zuraw Reference Zuraw, Bod, Hay and Jannedy2003, Bybee Reference Bybee2007). It was also observed, however, that lower spectral peak measures tended to occur with the rounded vowel /u/. MC, for example, had the lowest spectral peak measurement in the word strudel. Therefore, we should entertain the possibility that previous researchers investigating this sound change have heard varying realizations of /ʃ/ in /stɹ/ not because of intermediate variants but because of the differing coarticulatory effects of the following vowel.
The variability of the subjects’ productions of /stɹ/ was higher than both /ʃ/ and /ʃɹ/, with the tokens that fell outside the ranges for /ʃ/ causing a greater range for /stɹ/ and one that was more comparable to /s/. The mean standard deviations for individual speakers were higher for /stɹ/ than any of the three other onset types. This suggests that individual speakers are less consistent in how they produce /stɹ/ than the other onset types. This would support a hypothesis that this sound change is phonetically gradual, both across and within speakers. It may also be the case that the inconsistency in production of the fricative in /stɹ/ is related to the phonological context. As discussed in Section 3 above, /s/ does not contrast with any other phoneme in this system, and there is therefore no potential for the loss of contrast if articulation is inaccurate. This may indeed also be a motivating factor for the sound change. That is, whether a speaker produces [s] or [ʃ], or anything in between, there is no potential for the loss of contrast. Consistent, categorical distinctions, on the other hand, are required in systems where contrasts need to be maintained in order to convey lexical distinctions.
7 Conclusions
The research presented in this paper adds to the growing body of knowledge about a current sound change affecting the consonant cluster /stɹ/ in English. It has been suggested that a combination of phonetic and phonological factors is motivating this change, with a harmonizing process being allowed to spread due to the phonological environment of the initial fricative. The acoustic analysis conducted categorized the majority of /stɹ/ variants as falling within individual speakers’ normal ranges for /ʃ/. Suggestions of intermediate form by previous research in sociolinguistics (e.g. Labov Reference Labov2001, Durian Reference Durian2007) is supported in part; however, it is suggested that the possibility of coarticulatory effects causing the perceived variability observed by these authors should be explored.
Future work on /stɹ/ should employ a more extensive array of acoustic measures (e.g. spectral moments) or use instrumental analysis such as electropalatography (EPG). This may shed light on the perceived intermediate forms as well as the relationship between speakers’ productions of /ɹ/ and their pronunciation of the fricative in /stɹ/. EPG, for example, could provide more detailed information about tongue contact position in tokens that have up until now been categorized simply as /ʃ/. The present study has not fully answered the question of whether this sound change involves a continuum of phonetic changes or is instead a phonological merger. A larger study, involving a greater number of subjects and incorporating a broader range of ages would have a greater chance of catching speakers at earlier stages of the sound change and could therefore reveal a great deal more about the course of this change.
Acknowledgements
I would like to thank Martin J. Ball, Sarah Buckingham, Andrew John, Valerie Skaggs and three anonymous reviewers for assistance, guidance and helpful discussion. Any mistakes, errors, or weaknesses, of course, remain my own.