Introduction
The kidney is a relative newcomer among the organ systems for which relevance of the developmental origins hypothesis has been explored. Nephrology is a young discipline, to which epidemiologic principles have only been recently applied, and although the availability of renal replacement therapy in westernized countries has created a large group of people with end stage renal disease who can be studied in retrospect, attention has only recently focused on the vastly greater numbers of people with earlier stages of chronic kidney disease, and their accentuated cardiovascular risk. Development of the human kidney is influenced by genetic and epigenetic factors, by maternal nutritional status, maternal stature and the intrauterine environment, the length of gestation, the neonatal course and by postnatal nutrition. Many factors that influence kidney development also influence other developing organ systems. This paper summarizes some of the current knowledge and the implications of kidney development for future health, much of which have also been described in other recent reviews.Reference Hoy, Hughson, Douglas-Denton, Bertram and Amman1–Reference Dotsch, Plank, Amann and Ingelfinger5
Development of the human kidney
Renal development in mammals occurs during fetal life through three pairs of excretory organs, the pronephroi, mesonephroi and metanephroi, in a well-understood temporospatial pattern. The pronephroi, which are transient and without excretory activity, appear in the cervical region in the 4th week of human gestation, and give rise to the (meso) nephric or Wolffian duct. Development of the mesonephroi begins late in the 4th week of gestation in humans and proceeds in a cervical to caudal direction; as new glomeruli are formed at the caudal ends of the mesonephroi, glomeruli at the cranial end disappear through apoptosis. Human mesonephroi contain up to 40–42 glomeruli (with tubules) at any one time and function both as an excretory organ and as a source of circulating hormones and enzymes. They largely regress during the first trimester, but give rise to components of the female and male reproductive tracts. Finally, a ureteric bud grows from each Wolffian duct toward a mass of undifferentiated metanephric mesenchyme. Subsequent inter-actions between the ureteric bud and the metanephric mesenchyme give rise to the metanephroi, the permanent adult kidneys. Metanephric development commences in the 5th week of human gestation and urine is produced from approximately week 10. Nephrogenesis is generally said to be completed in the 36th week of human gestation, although few studies apart from those of Hinchliffe et al.Reference Hinchliffe, Sargent, Howard, Chan and van Velzen6 have analyzed this in detail. However, it is generally agreed that the formation of new nephrons is completed before term birth, and that the intrauterine environment and gestational age are the critical determinants of nephron endowment potential. Babies born at term have their full complement of nephrons. For comprehensive reports of kidney development, see Ekblom,Reference Ekblom7 Saxen,Reference Saxen8 Woolf et al.Reference Woolf9 and Vize et al.Reference Vize, Woolf and Bard10
Adult humans cannot generate new nephrons, even if nephrons are subsequently lost. However, nephrons and kidneys continue to grow after birth, through enlargement of glomeruli, tubules, the collecting duct system and supporting structures. Kidney weight in adult men ranges from approximately 125–170 g, whereas in adult women kidney weight ranges from 115–155 g.Reference Madsen and Tisher11 The male/female difference reflects, in part, a lower number of nephrons in females than males.Reference Hoy, Douglas-Denton and Hughson12
Kidney morphogenesis
Molecular interactions between cells of the ureteric epithelium and metanephric mesenchyme are required for metanephric development. If the ureteric bud fails to invade the metanephric mesenchyme, the mesenchyme undergoes apoptosis, resulting in unilateral or bilateral renal agenesis. If the ureteric bud emerges slightly early or late, then some of the metanephric mesenchymal cells may die and a hypoplastic kidney will form. Once the ureteric bud has invaded the metanephric mesenchyme, the bud undergoes ureteric branching morphogenesis, critical for establishment of renal histoarchitecture and an important determinant of final nephron number. At the same time, signals from epithelial cells at the tips of the ureteric branches induce adjacent mesenchymal cells to form a cellular condensate. This condensate then undergoes a mesenchymal-to-epithelial conversion to form an epithelial vesicle (‘renal vesicle’), which subsequently forms a structure descriptively termed the ‘comma-shaped body’ and from that the ‘S-shaped body’. Capillaries invade a cleft in the S-shaped body, anastamose and form the glomerular capillary tuft. The small number of epithelial cells in the original epithelial vesicle ultimately gives rise to all epithelial cell types of the nephron. Development of the renal interstitium and vasculature occurs in concert with these events. The ureteric bud gives rise to the collecting ducts, major and minor calyces, renal pelvis and ureter. In contrast, the metanephric mesenchyme gives rise to the epithelial cells of the nephron, namely the cells of the glomerulus, proximal convoluted tubule, loop of Henle, and distal convoluted tubule.Reference Ekblom7–Reference Vize, Woolf and Bard10
Prematurity and kidney development
The final waves of nephrogenesis occur during late gestation. Thus, the effects of prematurity on kidney development are potentially important, especially when we consider that the incidence of preterm birth is increasing in many countries (currently, 13% in the United States, and 8% in Australia.Reference Goldenberg, Culhane, Iams and Romero13, Reference Laws, Abeywardana, Walker and Sullivan14). As the survival of preterm infants continues to improve, increasing numbers of persons born prior to the completion of nephrogenesis will grow to adulthood.
Surprizingly, there have been few studies of the effects of preterm birth on nephrogenesis. Rodriguez et al.Reference Rodriguez, Gomez and Abitbol15 identified S-shaped bodies in the kidneys of very preterm infants born before the cessation of nephrogenesis, and concluded that nephrogenesis can continue postnatally for up to 40 days in such premature infants. Recently, Gubhaju et al.Reference Gubhaju, Sutherland and Yoder16 analyzed the kidneys of baboons that were delivered by Cesarean section at 125 days (equivalent to ∼27 weeks of human gestation; baboon gestation is 175 days) and subsequently cared for in a simian neonatal intensive care unit. These animals were compared with gestational controls. One group of preterm animals was exposed to 6 mg/kg of betamethasone on days 123 and 124 of gestation, whereas another premature group received no steroids. Kidneys from the premature animals were analyzed at 125 days (at delivery), at 131 days (6 days post-delivery) and 146 days (after 21 days of extrauterine care) and were compared with gestational controls and with kidneys from animals at late gestation. The nephrogenic zone, as well as glomerular number and volume, were estimated in fixed tissue. The authors concluded that nephrogenesis continued postnatally in premature animals, that a nephrogenic zone was present, and that the number of glomerular generations and total glomerular (and thereby nephron) numbers were within the normal range. However, in the kidneys of preterm baboons, whether steroid exposed or not, up to 20% of all glomeruli were morphologically abnormal, with dilated urinary spaces and shrunken glomerular tufts. That study could not determine whether the abnormal glomerular development contributed to an ultimate deficit in nephron endowment.
Genetic regulation of kidney development
In the past 15 years, a great deal has been learned about the genetic regulation of kidney development, particularly that of ureteric budding, ureteric branching morphogenesis and nephron induction. Much less is known about the processes of nephron differentiation (segmentation), including glomerular differentiation.
For overviews of the molecular regulation of kidney development, see Clark and Bertram,Reference Clark and Bertram17 DresslerReference Dressler18 and Moritz et al.Reference Moritz, Wintour, Black, Bertram and Caruana19 Most studies have been carried out in rodents, especially mice, using a variety of strategies. In the early years, rat or mouse whole metanephroi were cultured in the presence of specific exogenous growth factors or growth inhibitors (e.g. neutralizing antibodies), and the effects on kidney development analyzed. More recently, kidney development has been analyzed in homozygous null (knockout) or heterozygous null mutant mice. Nowadays, the effects of more targeted (conditional) gene knockout or knockdown on kidney development can be studied.Reference Kobayashi, Valerius and Mugford20, Reference Sims-Lucas, Cullen-McEwen and Eswarakumar21
Genome-wide approaches have also been used. Several investigators have conducted gene microarray studies on whole rat or mouse kidneys at different stages of development,Reference Stuart, Bush and Nigam22–Reference Martinez, Georgas and Challen25 and gene array approaches have been applied to describe global gene expression in different compartments of the developing kidney, including the metanephric mesenchyme (whole, induced and uninduced) and ureteric epithelium (whole, tip epithelial cells and trunk epithelial cells).Reference Stuart, Bush and Nigam22–Reference Challen, Gardiner and Caruana24, Reference Valerius, Patterson, Witte and Potter26–Reference Caruana, Young and Bertram29 Although these approaches do not per se reveal the roles of specific genes, they indicate which genes are expressed and which gene pathways are active, when and where, in kidney development. Recently, Brunskill et al.Reference Brunskill, Aronow and Georgas30 published the first exhaustive atlas of gene expression in the developing mouse kidney.
DresslerReference Dressler18 and Moritz et al.Reference Moritz, Wintour, Black, Bertram and Caruana19 present comprehensive analyses of genes shown to play important roles in kidney development, either through studies of mice with gene mutations or deletions. A number of gene deletions (full or partial) in mice lead to hypoplastic kidneys. These genes include glial cell line-derived neurotrophic factor (Gdnf),Reference Moore, Klein and Farinas31–Reference Cullen-McEwen, Drago and Bertram34 a fibroblast growth factor receptor (fgfr2IIIb),Reference Revest, Spencer-Dene and Kerr35 a fibroblast growth factor (Fgf10),Reference Ohuchi, Hori and Yamasaki36 a Gdnf co-receptor (Gfra1),Reference Cacalano, Farinas and Wang37Notch2 b,Reference McCright, Gao and Shen38 Sonic hedgehog (Shh),Reference Yu, Carroll and McMahon39Slit3,Reference Liu, Zhang and Wang40 and Wnt-11.Reference Majumdar, Vainio, Kispert, McMahon and McMahon41 Several genes have been shown to regulate nephron endowment, including Gdnf,Reference Cullen-McEwen, Drago and Bertram34Ret,Reference Clarke, Patel and Raymond42Pax2 Reference Dziarmaga, Eccles and Goodyer43 and Wnt-11.Reference Majumdar, Vainio, Kispert, McMahon and McMahon41 In contrast, transforming growth factor β2 (TGFβ2) heterozygous mice have augmented nephron endowment, with 60% more glomeruli (∼20,000 nephrons) than wild type littermates (∼12,000 nephrons).Reference Sims-Lucas, Caruana, Dowling, Kett and Bertram44
No study to date has linked gene mutations in humans with direct measures of nephron endowment. However, Zhang et al.Reference Zhang, Quinlan and Hoy45 recently reported that a polymorphic variant of the human Ret receptor was associated with a 10% reduction in newborn kidney volume. They also showed a strong direct correlation between newborn kidney volume and nephron endowment, suggesting that the findings with the Ret variant were associated with reduced nephron endowment. A common polymorphic variant of the transcription factor Pax2 has also been associated with reduced human newborn kidney size.Reference Quinlan, Lemire and Hudson46
The fetal–maternal environment and kidney development
A range of fetal–maternal environmental factors have been shown to influence kidney development, including nephron endowment. Most evidence has come from animal studies, although some human studies are available. Both indicate that, in a suboptimal intrauterine environment, growth of the brain and heart are typically prioritized at the expense of the kidneys, other organs and general somatic growth. These findings support the hypothesis of the fetal origins of health and disease proposed by Barker and OsmondReference Barker and Osmond47 and Barker et al. Reference Barker, Bull, Osmond and Simmonds48 The effect on the kidneys is mediated, at least in part, through reduced nephron endowment, which was proposed by Brenner and ChertowReference Brenner and Chertow49 to be a risk factor for the subsequent development of elevated blood pressure.
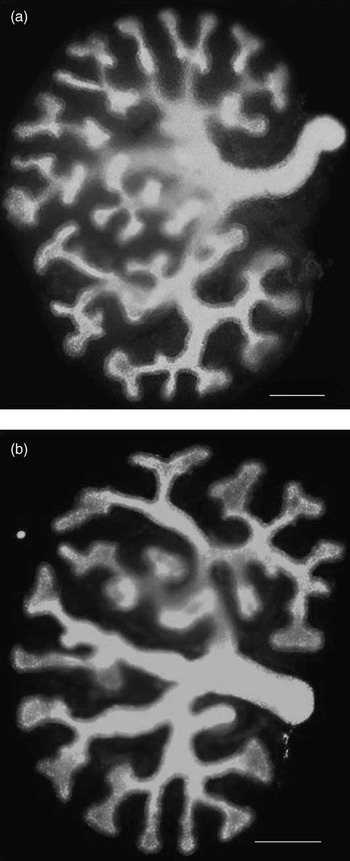
A range of animal models have been used to assess the effects of fetal–maternal environmental perturbations on kidney development. Strategies have included global food restriction during part or all of pregnancy, the feeding of a maternal low protein or high-fat diet, various models of placental insufficiency, vitamin A deficiency, vitamin D deficiency, exposure to natural and synthetic glucocorticoids (Fig. 1),Reference Singh, Moritz, Bertram and Cullen-McEwen50 and exposure to ethanol and antibiotics. The majority of studies have been conducted in rats or sheep, with some recent studies in miceReference Hoppe51 and Spiny mice,Reference Dickinson52 and several recent reviews have summarized many of these.Reference Moritz, Wintour, Black, Bertram and Caruana19, Reference Moritz and Cullen-McEwen53, Reference Nijland and Nathanielsz54 Recent findings of a renal programming effect of prenatal ethanol exposure are worth noting. Gray et al.Reference Gray, Kenna and Bertram55 gave pregnant ewes daily intravenous infusions of ethanol (0.75 g/kg) or saline from 95 to 133 days of gestation (term is ∼147 days). Offspring exposed to the chronic ethanol regime had an 11% deficit in nephron number. In studies of acute ethanol exposure (embryonic days: E13.5 and E14.5) in pregnant rats, Gray et al.Reference Gray, Denton, Bertram and Moritz56 reported a 20% deficit in nephron number at postnatal day 30. At 6 months of age, ethanol exposed male and female offspring had a 10 mm Hg elevation in mean arterial pressure.
Reduced ureteric tip budding in metanephroi of cultured developing rat kidneys in the presence of dexamethasone, in (a) Control medium and (b) Medium containing dexamethasone (10−5 M) (Singh et al.Reference Singh, Moritz, Bertram and Cullen-McEwen50). Scale: bar = 500 μm.

Most studies of renal developmental programming have reported reduced nephron endowment and elevated blood pressure in offspring, but remarkably few have investigated renal function in offspring. However, perturbation of the fetal–maternal environment does not automatically result in reduced nephron endowment and elevated blood pressure in offspring. Nephron endowment is influenced by the nature, timing (particularly in relation to the stages of kidney development), severity and duration of the perturbation, as well as the sex of the fetus. Moreover, while most animal models of reduced nephron endowment are associated with reduced birth weight, birth weight is normal in some of those models.Reference Dodic, May, Wintour and Coghlan57, Reference Wintour, Moritz and Johnson58
The postnatal environment can also influence the renal morphological and physiological outcomes in offspring. This insight has come from the variable design of studies in rodents, in which nephrogenesis continues for several days after birth. Those studies demonstrate that the effects of a maternal low-protein diet on both nephron endowment and blood pressure are very much influenced by the postnatal diet of the offspring.Reference Woods, Ingelfinger, Nyengaard and Rasch59–Reference Hoppe, Evans and Moritz62 Offspring born to protein-deprived dams, who are then fed a low-protein diet throughout their own lives, have offspring with a nephron deficit and low-blood pressure.Reference Hoppe, Evans and Moritz62 Furthermore, Wlodek et al.Reference Wlodek, Mibus and Tan63 and Moritz et al.Reference Moritz, Mazzuca and Siebel64 reported that nephron deficit and increase in blood pressure, induced in both male and female offspring by uteroplacental insufficiency (via bilateral uterine vessel ligation), were prevented by cross-fostering those offspring after birth onto a normal mother.
The effects of a maternal low-protein diet on nephron endowment in rats can also be transmitted across generations. Harrison and Langley-EvansReference Harrison and Langley-Evans65 fed pregnant rats either a normal-protein (18%) diet or low-protein (9%) diet throughout gestation. All offspring and subsequent generations were fed a normal diet. The F1 generation, which had reduced nephron number and elevated blood pressure, when mated with animals from either a protein-restricted pregnancy or with control animals, produced an F2 generation with similar nephron deficiency and elevated blood pressure, and the nephron deficit continued into the F3 generation. These findings suggest possible epigenetic modes of inheritance of renal developmental programming.
Population and clinical studies
Chronic kidney disease: definition and pathogenesis
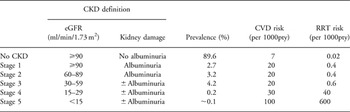
Although the adult kidney can be injured in numerous ways, the clinical effect is generally related to the accompanying reduction in glomerular filtration rate (GFR). As accurate estimation and even direct measurement of GFR carry many inaccuracies, the identification of early stages of chronic kidney disease (CKD) also requires additional indications of kidney damage such as albuminuria (Table 1).66 By the time patients are symptomatic (i.e. CKD stage 4–5), the progression of the specific disease has often converged onto a common pathway of inflammation and fibrosis with resultant glomerulosclerosis, interstitial fibrosis and tubular atrophy.Reference Fogo67
Central aspects of CKD in adults: definition, prevalence in the general population and risk for the two major outcomes

CKD, chronic kidney disease; eGFR, estimated glomerular filtration rate (ml/min/1.73 m2); CVD, cardiovascular disease; RRT, renal replacement therapy.
Prevalence based on data from the second Nord-Trøndelag Health study (ref. Reference Hallan, Astor and Romundstad71); CVD and RRT risk are rough incidence rates per 1000 person years from the Prevention of Renal and Vascular Endstage Disease study (ref. Reference de Jong, van der Velde, Gansevoort and Zoccali72) to illustrate the relative contributions of these two major outcomes in CKD patients.
The prevalence of CKD based on the criteria set out in Table 1 is high, with studies from the United States, Europe, Asia, Japan and Australia all finding prevalences of 10–13% in the adult population.Reference Hallan, Coresh and Astor68–Reference Zhang, Zhang and Wang70 Patients with CKD face two major threats: progression of their nephropathy to kidney failure and an increased risk of cardiovascular disease. The latter is overwhelmingly the most important, as only once the GFR is <30 ml/min/1.73 m2 is the risk for progression to kidney failure higher than the risk for cardiovascular disease and/or death only (Table 1).Reference Hallan, Astor and Romundstad71 Indeed, some reports suggest that CKD confers the same risk of cardiovascular disease and death as hypertension, diabetes and smoking.Reference de Jong, van der Velde, Gansevoort and Zoccali72 Thus, CKD may be considered a cardiovascular risk factor.
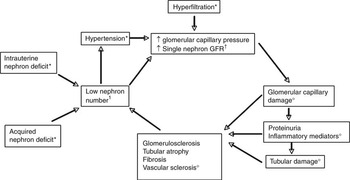
Current theories of CKD pathogenesis consider nephron number as a central factor (see Fig. 2). This view is based on experimental data and some indirect proof. A low nephron number may be congenital or acquired, either due to kidney diseases leading to nephron loss or by direct ablation by surgery or injury. A low nephron number increases single nephron GFR in the remaining nephrons directly, as well as by increased blood pressure and angiotensin II activity. Marked hyper-filtration, which also may be caused by diabetes mellitus and obesity, may lead to glomerular cell injury and proteinuria: these induce an inflammatory response producing focal segmental glomerulosclerosis and tubulointerstitial fibrosis and thereby more nephron loss.Reference Taal and Brenner73
Simplified overview of pathogenesis of chronic kidney disease (CKD) showing the central position of a low nephron number. *: Initiating factors for CKD; †: low nephron number and its immediate pathophysiological effects; ○: the following consequences leading to a vicious circle.

Low birth weight and kidney function
Low birth weight may be the result of a pregnancy with suboptimal conditions for kidney development as well as a baby with low birth weight by constitution (e.g. small parents). Being small for gestational age (SGA) is a better, but not optimal, marker for intrauterine growth restriction (IUGR). A wide variety of maternal, fetal, placental and environmental factors can cause IUGR. The most common contributing factors in developed nations are probably placental insufficiency and smoking, whereas inadequate maternal nutrition constitutes an enormous problem in many developing countries and may be present among the disadvantaged in any country. Birth weight does not accurately reflect all of these factors, but it is a simple and widely available marker of IUGR and much of our current knowledge is based on birth weight as the exposure variable.
A variety of outcomes can be used to assess the renal consequences of poor intrauterine nutrition. The need for renal replacement therapy constitutes the ultimate hard renal end point, but, non-renal end points such as cardiovascular disease manifested by myocardial infarction, stroke and mortality are also relevant, and more common, outcomes. Such end points require long follow-up and many study participants, and therefore various surrogate end points such as estimated GFR (eGFR), albuminuria, blood pressure and kidney volume are often employed. Typically, studies utilize levels of GFR or changes in GFR, which are generally accepted as the best measure of current kidney function. Albuminuria is considered the most important predictor of CKD progression rate and thereby of great interest. Hypertension could be an interesting marker of early sub-clinical kidney disease as it is increasingly claimed that some degree of kidney dysfunction is present in most patients with sustained hypertension.Reference Hall, Guyton and Brands74, Reference Ritz75 Hypertension is definitely an important risk factor for future CKD, and the association between low birth weight and blood pressure in later life is therefore relevant to future renal function and renal reserve.
The first study on the association between the conditions experienced in early life and risk of chronic disease in adult life was published in 1978 by Forsdahl,Reference Forsdahl76 a general physician working in the northernmost county of Norway. He observed that areas with increased infant mortality also had increased cardiovascular morbidity and mortality decades later despite similar living conditions at this later time period. These results were replicated 10 years later by Barker and OsmondReference Barker and Osmond47 and Barker et al.,Reference Barker, Bull, Osmond and Simmonds48 who thereafter applied such findings to the hypothesis of the fetal origins of adult disease. At about the same time, Brenner and ChertowReference Brenner and Chertow49 postulated that a low nephron number (specifically, low total renal glomerular filtration surface area) at birth would later lead to hypertension and kidney failure.
End stage renal disease (ESRD) has been used as an outcome in several studies. Lackland et al. Reference Lackland, Bendall, Osmond, Egan and Barker77 compared the birth weight in 1230 ESRD patients with 2460 controls matched for age, gender and race. Among people whose birth weight was <2.5 kg, the odds ratio (OR) for ESRD was 1.4 (95% CI: 1.1–1.8) compared with people with birth weights of 3–3.5 kg. Confounding and bias are a possibility, since birth weight was documented in only 32%, and there was no adjustment for socio-economic status, blood pressure or glycemic control. However, later studies that have adjusted for at least some of these potential confounders provide similar results.Reference Vikse, Irgens, Leivestad, Hallan and Iversen78, Reference Fan, Lackland, Lipsitz and Nicholas79
The association of cardiovascular morbidity and mortality with birth weight has been extensively studied. For example, Osmond et al.Reference Osmond, Barker, Winter, Fall and Simmonds80 reported an age and sex-adjusted relative risk of 0.84/kg increase in birth weight based on 16,652 people with available birth records from Hertfordshire, England. Several studies have adjusted for gestational age, some for maternal socio-demographic factors and a few for traditional cardiovascular risk factors in adulthood, and most reported an age- and sex-adjusted relative risk of 0.8–0.9/kg higher birth weight. A systematic review of studies found relative risks of 0.4–1.0/kg increase in birth weight, and a weighted overall result of 0.84 (95% CI: 0.81–0.88).Reference Huxley, Owen and Whincup81 As cardiovascular disease and CKD share many common pathophysiological pathways, these data imply that CKD may be inversely related to birth weight.
Albuminuria is an important surrogate marker for both kidney and cardiovascular disease.Reference Hallan, Astor and Romundstad71, Reference de Jong, van der Velde, Gansevoort and Zoccali72, Reference de Jong and Curhan82–Reference Hallan, Ritz and Lydersen84 Traditionally, microalbuminuria (excretion of 30–300 mg albumin/day) has been regarded as a marker of generalized vascular damage, whereas macroalbuminuria (>300 mg albumin/day) has been regarded as a marker of kidney disease. Such a distinction is, however, not very fruitful. Albuminuria confers a continuously increasing risk for both cardiovascular disease and kidney disease. The increased urinary excretion of albumin reflects damage to the glomerular filtration barrier (i.e. the glycocalyx covering the endothelial cells, the basement membrane or the podocytes). Recently, it has also been claimed that there is normally a large glomerular leakage of albumin and that pathology is reflected through decreased tubular reabsorption of albumin.Reference Comper, Hilliard, Nikolic-Paterson and Russo85
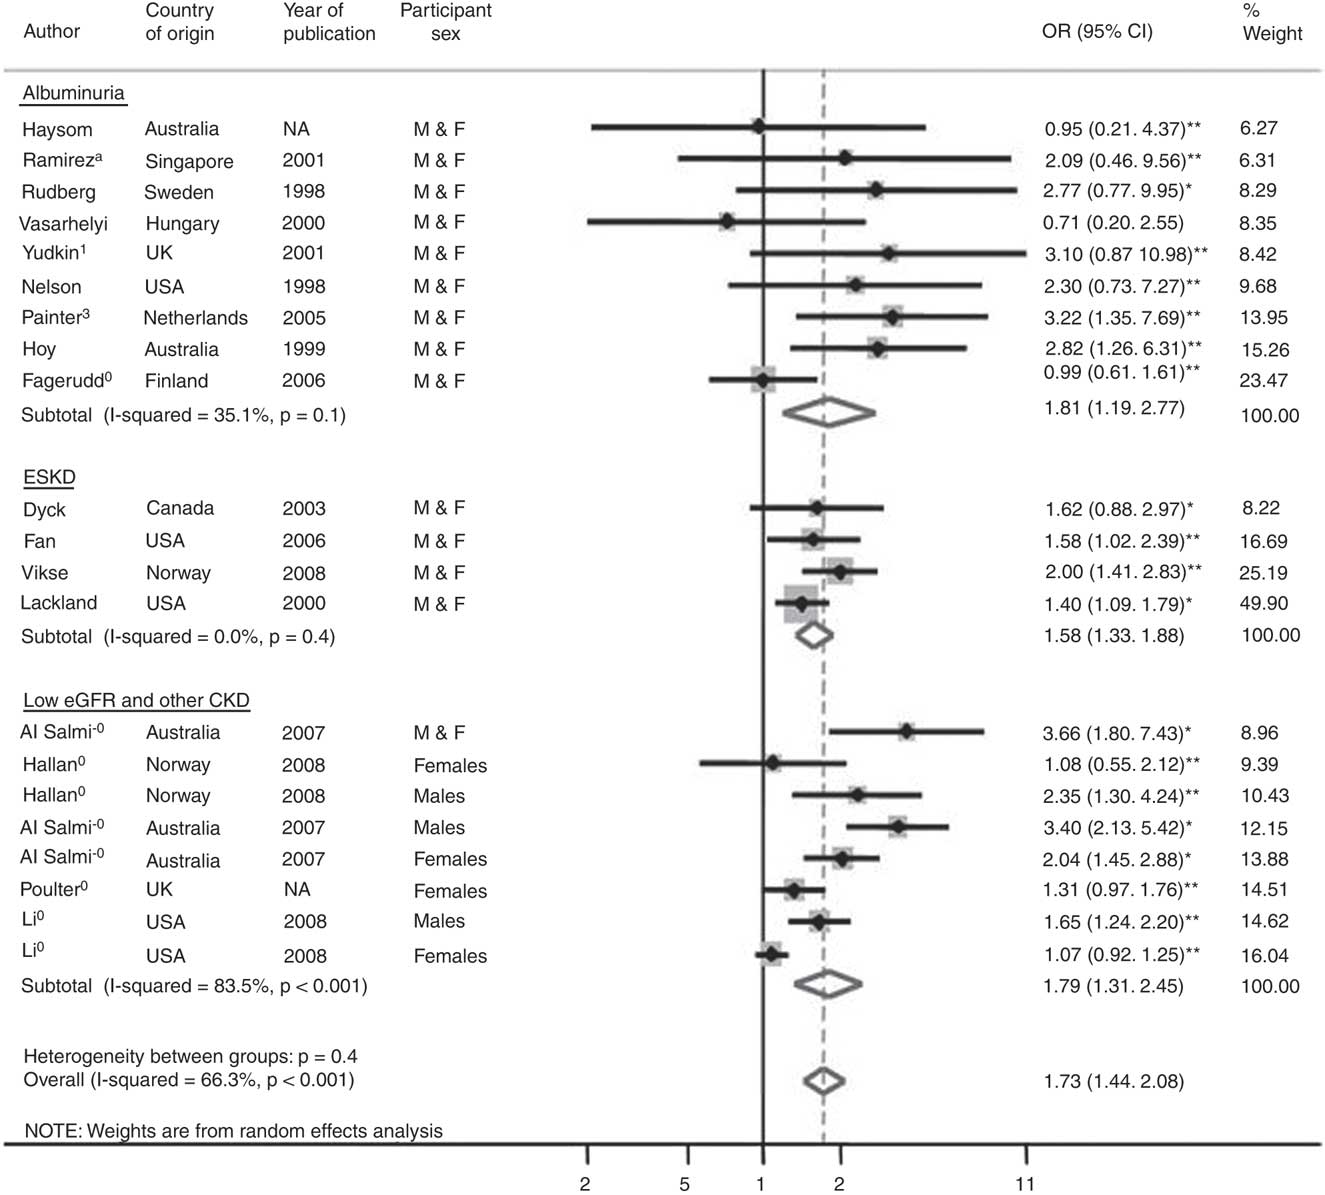
Yudkin et al.Reference Yudkin, Martyn, Phillips and Gale86 examined microalbuminuria in 98 people whose mothers had been exposed to severe protein-calorie malnutrition during the Siege of Leningrad during World War II. They compared the results with 236 people in the United Kingdom, 124 people in Russia exposed to the famine as infants but not prenatally and 62 people who were born at the same time period in Russia but not exposed to the Siege itself. They found 11 people with microalbuminuria, but there were neither statistically significant correlations between microalbuminuria and birth weight, nor between microalbuminuria and exposure to in utero starvation. The small number of patients involved may have rendered the data less than optimal. Painter et al.Reference Painter, Roseboom and van Montfrans87 found that people exposed to the Dutch famine in 1944–1945, during mid-gestation specifically, had an OR of 3.2 (1.4–7.7) for later microalbuminuria. However, they observed no association with birth weight or other parameters of size at birth. Fagerudd et al.Reference Fagerudd, Forsblom and Pettersson-Fernholm88 found no association between birth weight <10th percentile and diabetic nephropathy in 1543 patients with type 1 diabetes mellitus (OR 0.99). In contrast, several smaller studies reported a positive association, and in the meta-analysis by White et al.Reference White, Perkovic and Cass89 (Fig. 3) the combined OR for albuminuria was 1.81 (1.19–2.77). However, the association would probably have been non-significant if the Painter et al.Reference Painter, Roseboom and van Montfrans87 study, which was assigned a weight of 15.3%, had been included as a negative study. Thus, the scientific proof for an association between birth weight and albuminuria is not particularly strong.
Meta-analysis by White et al.Reference White, Perkovic and Cass89 showing OR for risk of CKD associated with low birth weight v. normal birth weight. The dashed vertical line shows the inverse variance-weighted regression through the overall point estimate (reproduced with permission). OR, odds ratio; eGFR, estimated glomerular filtration rate; CKD, chronic kidney disease.
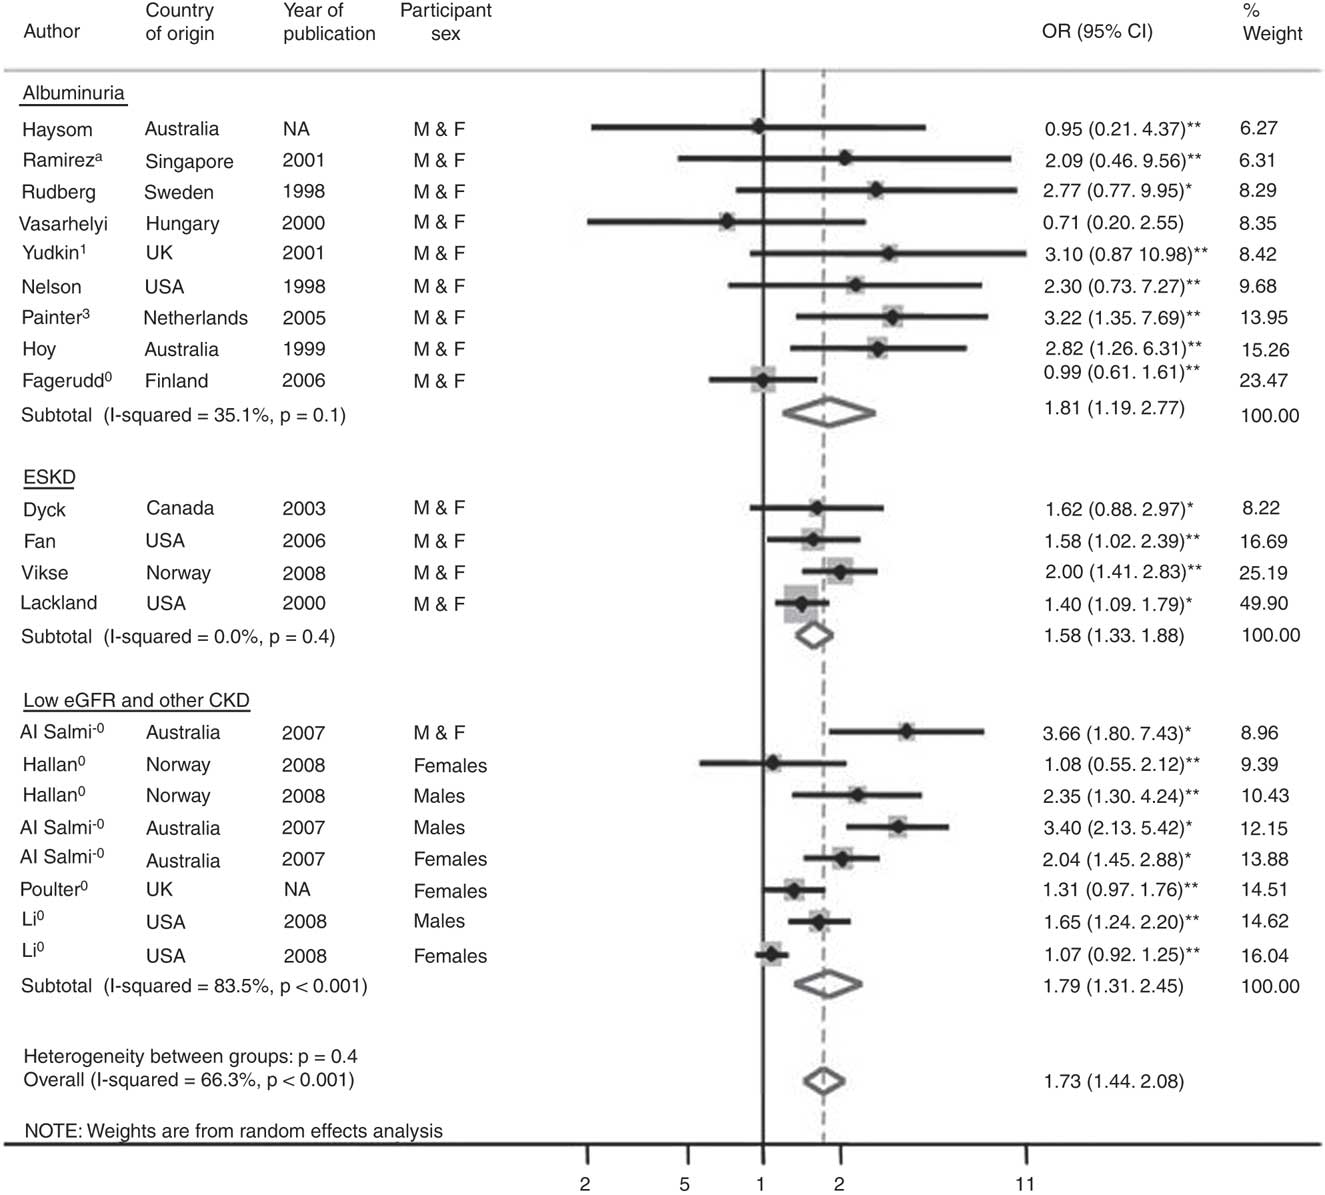
Low eGFR has been used as an outcome in several studies. For example, Li et al.Reference Li, Chen and Shlipak90 studied 12,364 persons of high risk with diabetes mellitus, hypertension or a family history of diabetes, hypertension or kidney disease. They found that, after adjusting for age, race, education, diabetes, cardiovascular disease and family history, lower birth weight among men was associated with an increase in risk for CKD, defined as an eGFR <60 ml/min/1.73 m2 and/or microalbuminuria, of 1.65 (CI: 1.24–2.2), but the risk was insignificant in women, OR 1.07 (CI: 0.92–1.25). As the estimation of kidney function in most studies has been in young adults, the age- and sex-specific 10th percentile has often been used as a cut-point instead of 60 ml/min/1.73 m2.Reference White, Perkovic and Cass89 Most other studies have also found a non-significant and/or substantially lower risk in women.Reference Li, Chen and Shlipak90 Of interest, a sexual dimorphism has been reported for detrimental intrauterine milieu in other situations as well, and is frequently observed in animal studies of developmental programming.Reference Moritz, Wintour, Black, Bertram and Caruana19
The association between low birth weight and hypertension in later life has been extensively studied. The early studies indicated a strong inverse association (−2 to −4 mm Hg/kg birth weight).Reference Law and Shiell91 However, a meta-analysis by Huxley et al.Reference Huxley, Neil and Collins92 that included later and larger studies, yielded a weighted estimate of −0.6 mm Hg/kg higher birth weight. A Nordic epidemiological research program providing access to raw data from 20 different cohorts (197,954 patients) found an effect of −0.8 and −1.7 mm Hg/kg in young men and women, respectively.Reference Gamborg, Byberg and Rasmussen93 Meta-regression analysis showed that the effect increased with age, and for 50-year-old patients the effect was −1.5 and −2.3 mm Hg/kg birth weight, respectively.
In addition to, or independent of low birth weight or SGA, various other factors associated with the intrauterine and perinatal milieu modify renal development and influence blood pressure. The mechanisms are complex, likely involving epigenetic modifications of DNA and exposures that influence nephron number. Such factors include administration of glucocorticoids, vitamin A deficiency and iron deficiency, as well as various nephrotoxic substances.Reference Wintour, Moritz and Johnson58, Reference Woods, Ingelfinger, Nyengaard and Rasch59, Reference Langley-Evans, Welham and Jackson94–Reference Ortiz, Quan, Zarzar, Weinberg and Baum103 For many, data are more persuasive from animal models than from humans.
Glucocorticoids and kidney function
As indicated previously, studies in rats, sheep and spiny mice support the concern that steroid use is an important negative modifier of renal development.Reference Dodic, May, Wintour and Coghlan57, Reference Wintour, Moritz and Johnson58, Reference Ortiz, Quan, Weinberg and Baum102–Reference Seckl106 There are some data in humans, because glucocorticoids have been used clinically, most commonly administered to mothers to promote maturation of fetal lungs in a pregnancy likely to end prematurely.Reference Doyle, Ford and Davis107–Reference Finken, Keijzer-Veen and Dekker110 An observational study in adolescents who were exposed to betamethasone before birth reported that they had higher blood pressures at age 14 years. However, differences may have related to pubertal changes in blood pressure rather than an effect of antenatal steroids.Reference Doyle, Ford and Davis107 Another small randomized study reported that systolic blood pressure was actually lower at age 20 years in persons who had been exposed to betamethasone in utero compared with those who had not been exposed.Reference Dessens, Haas and Koppe108 Dalziel et al.Reference Dalziel, Walker and Parag109 reported that children of mothers who had received betamethasone during gestation had a higher frequency of dysglycemia on measurement of glucose tolerance when studied at age 30 years, compared with control participants, but had no differences in terms of body size, blood pressure or cardiovascular disease. Most recently, Finken et al.Reference Finken, Keijzer-Veen and Dekker110 reported results of a multicenter study in which 412 people who had been born at 32 weeks of gestation were evaluated at age 19 years, and compared those whose mothers had received two doses of betamethasone (12 mg), to induce lung maturation in their fetuses, with those who had not. They found no differences in body composition, blood pressure, metabolic status or insulin resistance; eGFR was within the normal range in both groups, but was significantly lower among those who had received steroids, with values of 103.5 ml/min/1.73 m2 (s.d. 12.6) in the betamethasone group v. 107.0 ml/min/1.73 m2 (s.d. 15.6) in the controls.
Vitamin A deficiency and kidney function
Marked vitamin A deficiency is associated with a number of birth defects, including deficient nephrogenesis, first reported over 60 years ago.Reference Lelièvre-Pégorier, Vilar and Ferrier95, Reference Merlet-Bénichou, Gilbert, Muffat-Joly, Lelièvre-Pégorier and Leroy96, Reference Wilson and Warkany111–Reference Mendelsohn, Lohnes and Décimo116 However, mild vitamin A deficiency may be associated with subtle renal defects. In animal models, a number of studies indicate that maternal vitamin A deficiency results in fewer nephrons and later hypertension. If retinoic acid receptors are genetically eliminated in mice, the kidneys do not develop normally and the mice have unilateral or bilateral renal agenesis.
Recently, Makrakis et al.Reference Makrakis, Zimanyi and Black117 demonstrated in rats that providing retinoic acid to protein-deficient dams at mid-gestation could rescue the nephron deficit induced by the maternal protein deficiency. However, in another model, that of the premature baboon, administration of retinoic acid following birth did not increase postnatal nephrogenesis as compared with that seen in premature baboons not given retinoic acid. The number of abnormal glomeruli, a finding seen in the premature baboon model, were not ameliorated by postnatal retinoic acid. Thus, retinoic acid may be a limiting factor in the rat maternal protein restriction model, as it is downstream of certain growth factors that may be lacking, while in the premature baboon model, which is induced simply by early delivery, nutrient deficit per se is not a limiting feature.Reference Sutherland, Gubahaju, Yoder, Stahlman and Black118
As vitamin A deficiency is very common in the developing world, its potential contribution to impaired intrauterine organ development is of great interest. However, demonstrating that subtle deficiencies affect the human kidney is more difficult. In a pilot study, Goodyer et al.Reference Goodyer, Kurpad and Rekha119 showed that renal size at birth was lower in children from Bangalore, India as compared with Montreal, and that vitamin A levels in the Bangalore mothers were also lower. A recent Cochrane review discusses the effects of vitamin A supplementation in humans.Reference Darlow and Graham120 Further, recent data concerning retinoic acid has led to the suggestion that it be used as a treatment for various nephropathies.Reference Xu, Lucio-Cazana and Kitamura121
Iron deficiency and kidney function
A substantial body of data in animal models suggest that iron deficiency may be associated with lower nephron number.Reference Gambling, Dunford and Wallace122 Additional studies in the rat indicate that restriction of iron intake in pregnant dams results in offspring that are lighter and that have higher blood pressures in later life.Reference Crowe, Dandekar and Fox123, Reference Singla, Tyagi, Kumar, Dash and Shankar124
Deficiency in iron stores, as well as anemia and insufficient iron intake are frequent in pregnant women, and lower birth weightsReference Singla, Tyagi, Kumar, Dash and Shankar124 and prematurityReference Lieberman, Ryan, Monson and Schoenbaum125, Reference Scholl, Hediger, Fischer and Shearer126 have been reported in newborns of mothers with iron deficiency. Some data do not support these findings,Reference Lu, Goldenberg, Cliver, Cutter and Blankson127–Reference Knottnerus, Delgado, Knipschild, Essed and Smits129 but the positive data have led to the suggestion that iron supplementation is beneficial in terms of fetal growth retardation and birth weight.Reference Cogswell, Parvanta, Ickes, Yip and Brittenham130
Recently, Belfort et al.Reference Belfort, Rifas-Shiman and Rich-Edwards131 studied offspring in Project Viva, a longitudinal cohort study that is prospectively examining a number of prenatal factors that may influence pregnancy outcomes and child health of the offspring. The authors examined 1167 participants and estimated the maternal iron intake during the first and second trimesters using food frequency questionnaires, and noted the recorded hemoglobin and mean corpuscular volume levels during gestation. They found no correlation between lower maternal iron status and higher blood pressure in offspring. This was in line with an older study by Whincup et al.Reference Whincup, Cook, Papacosta, Walker and Perry132 who observed no correlation between maternal iron status and blood pressure in offspring aged 8 or 9 years.
Possible explanations include the fact that third trimester iron stores, which might be more important, were not measured. Further, more marked iron deficiency may have been needed for an evident effect. In addition, the socio-economic status of the children studied was higher than that in some of the studies with positive findings. In the studies reporting a positive association between maternal anemia and blood pressure, the level of anemia was more severe than in the Belfort et al. study. The effects also may take longer to see – the positive animal data suggest that effects are seen at or after puberty.
Prematurity and kidney function
It is unclear whether prematurity per se leads to a change in nephron endowment. However, with nephrogenesis normally proceeding until weeks 34–36 of gestation, development of a full complement of normal nephrons in babies born prematurely and of appropriate weight for gestational age (AGA) at that point would presumably require a postnatal environment as optimal as a continued uncomplicated intrauterine course to term.
Limited epidemiologic data exist. Siewert-Delle and LjungmanReference Siewert-Delle and Ljungman133 reported from a study in Goteborg of 49-year-old men born in 1926–1927 with available birth weights that blood pressure in adulthood was greatly impacted by prematurity. Nuyt and AlexanderReference Nuyt and Alexander134 pointed out that it is possible that epidemiologic studies have mislabeled some participants as SGA when they may have been mildly premature. Further, birth weights several decades ago were, on average, smaller.Reference Usher and McLean135 Liew et al.Reference Liew, Wang and Mitchell136 make the case that although both lower birth weight and prematurity modeled separately are inversely related to subsequent blood pressure, in a model that combines both, the birth weight predominates. Rakow et al.Reference Rakow, Johansson and Legnevall137 compared children born prior to 32 weeks of gestational age to term infants who were SGA and term children who were AGA. After adjustment for body surface area, gender and age, no significant differences were found in renal function or renal volume. Finally, Kent et al.Reference Kent, Jyoti and Robertson138 recently observed no differences in estimated kidney volume by magnetic resonance imaging or in kidney volume/body weight between 17 premature infants at term corrected age and 13 term infants.
Babies born very prematurely often have complicated postnatal courses for weeks or months, which is unlikely to promote optimal continued nephrogenesis. They spend substantial time in neonatal intensive care units, have metabolic, hemodynamic and respiratory problems, are subject to invasive procedures and receive drugs with nephrotoxic potential. A substantial proportion also have antecedent IUGR, which has potentially already compromised nephrogenesis. In a recent cohort study of very low birth weight premature infants (under 1000 g), Bacchetta et al.Reference Bacchetta, Harambat and Dubourg139 measured true GFR (insulin clearance) at a mean age of 7.6 ± 1.3 years and observed that those children who were IUGR and those who had extrauterine growth retardation showed evidence of relatively low GFRs. Rodriguez et al.Reference Rodriguez, Gomez and Abitbol15 found that although ongoing glomerulogenesis was detectable in extremely low birth weight premature babies, it was at a much reduced pace than expected through an uninterrupted AGA pregnancy, thus resulting in a deficiency of nephrons. Furthermore, nephrogenesis ceased by 40 days, and beyond that, enlargement of existing glomeruli was observed, suggesting compensatory hypertrophy, with additional glomerular abnormalities suggesting ischemic injury. These changes were more marked in those babies temporarily surviving acute kidney injury. In a baboon model of prematurity with supported survival through to projected ‘term’ dates, up to 20% of glomeruli were morphologically abnormal.Reference Gubhaju, Sutherland and Yoder16 Finally, in an autopsy study of 25 archived kidneys from AGA preterm babies (24–34 weeks gestation) who survived up to 36 days after birth, renal morphology was compared with renal autopsy tissue from 12 gestational age-matched AGA stillborn controls that died in utero.Reference Sutherland, Gubhaju and Stamp140 The premature babies showed a reduced number of glomerular generations formed per week, lower numbers of immature glomeruli, significant proportions of glomerular abnormalities like cystic dilatation and undeveloped tufts, and some glomerular enlargement.
Evidence of a propensity to renal failure in persons who survived extreme prematurity has so far been difficult to obtain. However, recently Hodgin et al.Reference Hodgin, Rasoulpour, Markowitz and D’Agati141 reported an apparent increase in the risk of focal sclerosing glomerulosclerosis (FSGS) in persons who were born with extremely low birth weight and were premature. It is also clear that extremely low birth weight premature babies who experience acute kidney injury in the neonatal period have greatly increased risk of renal disease and renal failure in childhood and adolescence, especially if they become obese.Reference Abitbol, Bauer and Montane142
CKD and birth weight: implications for health in the general population
The influence of early life events on CKD in the general population has been documented at several levels. Associations with asymptomatic risk factors have already been discussed. Associations of lower birth weights with severity or progression of kidney disease in childhood (e.g. decompensation of minimal change disease, immunoglobulin (Ig) A nephropathy, FSGS) and in adult life (reviewed in Hoy et al.,Reference Hoy, Hughson, Douglas-Denton, Bertram and Amman1 Dotsch et al.Reference Dotsch, Plank, Amann and Ingelfinger5), and the stages of CKD in people with renal disease of all the usual common ‘causes’ have all been described.Reference Al Salmi, Hoy and Healy143
Lackland and BarkerReference Lackland and Barker144 consider that birth weights are one determinant of differential CKD rates among populations. However, the contributions of early life events to CKD in various populations are hard to estimate. Asymmetric IUGR (where body weight is reduced to a greater degree than length), rather than symmetric IUGR, is thought to predict greater risk of hypertension and perhaps renal risk.Reference Bagby3 However, some relationships pertain to birth weight over a continuum and AGA people born at term. Globally, small maternal stature is the most common antecedent of lower birth weights. In part, this stems from generations of nutritional deprivation, but the magnitude and manifestation of risk in small babies born to small mothers who are well nourished and well cared for, in any society, are not well understood. ‘Catch up growth’ in infancy and childhood is thought to especially exacerbate risk for adverse consequences of impaired renal development, perhaps because compensatory hyperfiltration in response to relative or absolute nephron deficit is more readily established in the growing as opposed to the mature kidney.Reference Bagby3 We do not know whether infant malnutrition or a post-weaning growth slump, still seen in some disadvantaged environments, further compromises organ development or maturation.
Early life events are only one aspect in a multi-determinant or ‘multihit’ model of risk and of kidney disease.Reference Hoy, Mathews and Pugsley145–Reference Hoy, Kile, Rees and Mathews147 Populations with low birth weights usually have additional risk factors such as poor nutrition, infections, smoking, substance abuse, poor access to health care and high levels of psychosocial stress. The adverse impact of psychosocial stress on organ development and the mechanistic pathways are not well defined, but some authors consider it the predominant driver of exacerbated risk for CKD and chronic disease in disadvantaged populations like African Americans.Reference Bruce, Beech and Sims148
In affluent mainstream westernized populations in whom birth weights have steadily improved, there might be limited scope for further reduction in the incidence of low birth weight among babies born close to term, beyond minimizing maternal smoking and drinking and psychosocial stress. However, within those countries, risk factors associated with disadvantage are still operating at higher levels among minority and deprived groups. In those same westernized countries, a different population of at-risk people is being generated through the increasing survival of premature babies of very low birth weight, due to better neonatal intensive care and in some cases, multiplex pregnancy associated with assisted reproduction.
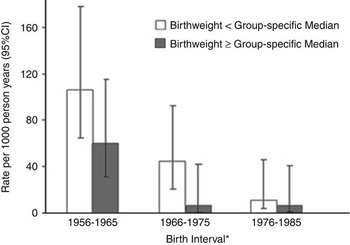
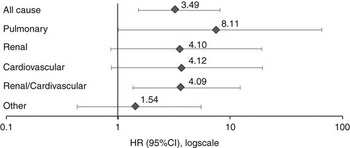
In developing countries and in disadvantaged subpopulations within westernized countries, an additional phenomenon is creating generations of people at higher risk. Specifically, dramatic reductions in death rates of infants and children result in greater numbers reaching adolescence and adult life, whereas those of lower birth weights are at greater risk for chronic disease. Aboriginal people living in remote areas of Australia provide an example. Historically, their birth weights have been low, but improvements in health care have led to striking reductions in mortality of infants and children since the early 1960s (Fig. 4). Consequently, the vast majority of babies across the entire birth weight spectrum are now surviving to adult life.Reference Hoy and Nichol149 Among young adults today, birth weights are inversely correlated with blood pressures, levels of urinary albumin and sometimes with higher rates of diabetes.Reference Hoy, Kile, Rees and Mathews150–Reference Hoy and Kondalsamy-Chennakesavan152 In the only existing study to this point,Reference Hoy and Nichol149 young Aboriginal adults with birth weight below their group medians had higher rates of cardiovascular, renal and pulmonary deaths than those of higher birth weight (Fig. 5), confirming the Barker hypothesis in relation to chronic disease deaths. Countries in the developing world are undoubtedly experiencing similar phenomena. The challenge in these situations is to implement systems of regular surveillance and timely treatment of those at risk, and to press on with optimizing community nutrition, maternal care and birth weights.
Rates of natural death in Aboriginal infants (<1 year) by birth interval (Hoy and NicolReference Hoy and Nichol149). *Group-specific median birth weights: 1956–1965 = 2.66 kg; 1966–1975 = 2.68 kg; 1976–1985 = 2.86 kg.

HR (95% CI) for natural deaths in young Aboriginal adults (15 to <37 years) by birth weight, <group median v. ⩾group median, by underlying or associated cause, adjusted for birth interval, age and sex (Hoy and NicolReference Hoy and Nichol149). HR, hazard ratio.

Morphological considerations in humans
Findings in kidneys at autopsies of humans dying of sudden or unexpected death support the hypothesis that nephron number is one determinant of susceptibility to kidney disease and hypertension, while features of diseased kidney biopsies suggest pathways through which lower nephron number might facilitate the expression and progression of kidney disease.
Autopsy studies
Autopsy studies usually employ estimates of total glomerular number as a surrogate for nephron number. Nephron number, in turn, represents both nephron endowment and nephron loss during life to that point.
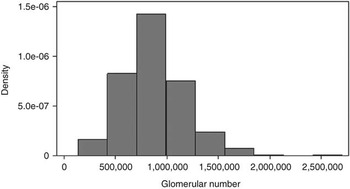
There is striking variation in glomerular number and mean glomerular volume in the general population. In the ‘Monash series’ of kidneys studied by the disector/fractionator combination, among (currently) 420 people from five population groups on three continents undergoing autopsy for sudden or unexpected death, but without known kidney disease or gross morphologic abnormalities, there was a 14-fold range in total glomerular number, as shown in Figure 6, and, in adults, a 6.7-fold range in mean glomerular volume.Reference Hoy, Douglas-Denton and Hughson12, Reference Hoy, Hughson and Zimanyi153
Distribution of total glomerular (nephron) number in forensic autopsies, right kidney. Data are from US whites and blacks, Senegalese and Australian whites and Aborigines, both sexes, all ages, n = 420.

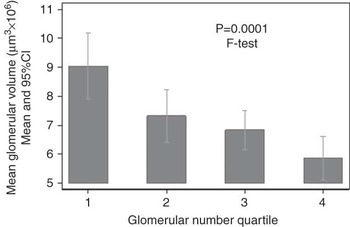
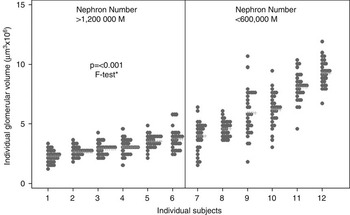
Mean glomerular volume was inversely correlated with total nephron number, shown in Figure 7, and directly with current body size, probably reflecting processes of adaptive hypertrophy. However, these hypertrophic processes are differentially expressed among different glomeruli, as shown by the heterogeneity of glomerular volumes within individual subjects.Reference Samuel, Hoy, Douglas-Denton, Hughson and Bertram154–Reference Hoy, Zimanyi and Samuel157 Such heterogeneity is more marked in patients with lower nephron numbers (Fig. 8), as well as those with marked obesity. In theory, the larger glomeruli in the more heterogeneous distributions could be at higher risk for sclerosis through hyperperfusion/hypertrophy injury.Reference Fogo and Ichikawa158, Reference Brenner, Lawler and Mackenzie159
Mean glomerular volume by total glomerular number quartile, right kidney: white US adults, ⩾18 years, n = 111.

Distribution of volume of 30 glomeruli per patient by upper and lower quintile of glomerular number, right kidney: white US males, ⩾18 years, n = 12 patients. Each column represents a patient; each dot represents a glomerulus (Zimanyi et al.Reference Zimanyi, Hoy and Douglas-Denton155). *Mixed-effects linear regression.

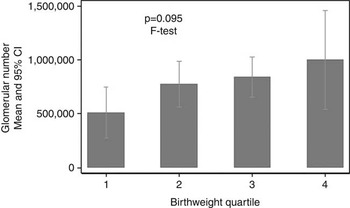
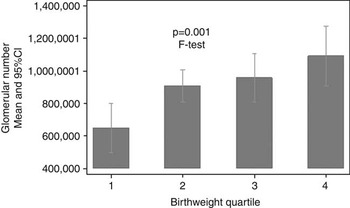
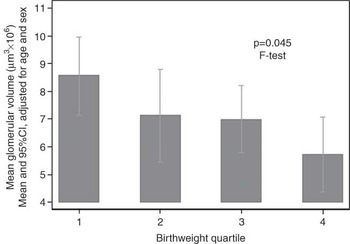
In that autopsy series, nephron number was directly correlated with birth weight, both in children and in adults (Figs 9 and 10).Reference Hughson, Farris and Douglas-Denton160 Conversely, lower birth weights were associated in adults with higher mean glomerular volumes (Fig. 11) and with greater individual glomerular volume heterogeneity.Reference Hoy, Hughson and Zimanyi153 Birth weight’s association with nephron numbers probably contributes to the predisposing effects of lower birth weights to hypertension and renal disease, and the heterogeneously expressed enlargement of remaining glomeruli probably flags the stress to which they are exposed. This would be exacerbated by coexisting obesity.
Total glomerular (nephron) number by birth weight quartile, right kidney: infants and children, <18 years, n = 37.

Total glomerular (nephron) number by birth weight quartile, right kidney: white US adults, ⩾18 years, n = 158.

Mean glomerular volume by birth weight quartile, right kidney, white US adults, ⩾18 years, n = 54.

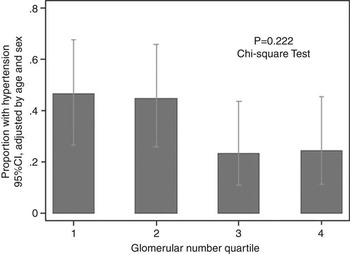
People with lower nephron numbers probably have increased susceptibility to renal disease, given their limited capacity for further nephron loss throughout life before a critical deficiency is reached. They are also predisposed to hypertension, based, in part at least, on reduced glomerular filtration surface area. At the population level, the relative deficiency of nephrons in Australian AboriginesReference Hoy, Hughson and Singh161 is compatible with that hypothesis, and while our study does not yet show that US blacks had significantly fewer glomeruli than US whites or Africans from Senegal, they were, in males at least, relatively deficient in nephrons in relation to their greater height.Reference Dotsch, Plank, Amann and Ingelfinger5, Reference McNamara, Diouf, Douglas-Denton, Hughson, Hoy and Bertram162 At the level of individual patients, Keller et al.Reference Keller, Zimmer and Mall163 in an autopsy study of accident victims, found strikingly fewer and larger glomeruli in people with, rather than without, pre-existing hypertension, while, in our autopsy series, both US whites (Fig. 12) and Australian Aborigines with hypertension had fewer and larger glomeruli than their non-hypertensive counterparts.Reference Dotsch, Plank, Amann and Ingelfinger5
Hypertension by total glomerular (nephron) number quartile, right kidney white US adults, ⩾18 years, n = 105.

The relative and absolute contributions of lower nephron endowment and postnatal nephron loss to nephron deficiency and, potentially to hypertension, are not easy to define in individuals and populations at this time.Reference Moritz and Cullen-McEwen2, Reference Dotsch, Plank, Amann and Ingelfinger5 The findings of Keller et al.,Reference Keller, Zimmer and Mall163 provoked the question of whether the ‘missing’ nephrons in their hypertensive subjects ever existed. The authors proposed that the nephron deficit might be largely congenital, because destroyed or sclerotic nephrons seemed insufficient to account for deficit.Reference Ingelfinger164 However, most autopsy studies support a significant loss of nephrons during adult life, especially after middle age (Hoy et al., Reference Hoy, Douglas-Denton and Hughson12 Nyengaard and Bendtsen,Reference Nyengaard and Bendtsen165 and Dotsch et al.Reference Dotsch, Plank, Amann and Ingelfinger5), and many investigators feel that chronic vascular change associated with aging leads to nephron loss and that elevations of blood pressure follow (Dotsch et al.Reference Dotsch, Plank, Amann and Ingelfinger5). Furthermore, they have observed that many nephrons apparently ‘disappear without a trace’ so that visible nephron remnants or scarring understate the extent of nephron loss (Dotsch et al.Reference Dotsch, Plank, Amann and Ingelfinger5). In the ‘Monash series’, aging was associated with increasing vascular change, cortical fibrosis, glomerulosclerosis (uniformly with shrunken ischemic glomeruli tufts), with lower nephron numbers and lower kidney volumes, and with higher rates of hypertension. To resolve these issues further, non-invasive techniques are needed to measure nephron number in vivo and to follow individuals over time.
These observations are merely the beginning of such a line of inquiry. Tracking the presence and disappearance of nephrons is only one issue. Critical volumes or critical levels of ischemia at which glomeruli become susceptible to injury, and the genetic and environmental determinants of such limitations are unexplored. The relevance of the hyperperfusion hypothesis to glomerular injury and loss in aging and hypertensive kidneys, as opposed to progressive renal disease, is unclear. Furthermore, this discussion totally neglects the tubules, collecting system and various support structures in the kidney, although they constitute the bulk of the kidney’s physical and metabolic mass, and constitutional or acquired variations in tubular functions might well be important drivers of hypertension, albuminuria and CKD progression.
Diseased renal biopsies
Lower nephron numbers in Australian Aboriginal people living in remote areasReference Hoy, Hughson and Singh161 probably predispose to their high rates of renal disease, hypertension and cardiovascular disease.Reference Howard, Davis, Pugsley, Seymour and Hoy166 Although reduced nephron number might be determined in part by genetic and epigenetic factors, lower birth weights are also important: in one community, 35% of people in early middle age had been low birth weight babies (<2.5 kg), and birth weight was inversely correlated with albuminuria in early adult life.Reference Hoy, Kile, Rees and Mathews147, Reference Hoy, Kile, Rees and Mathews150
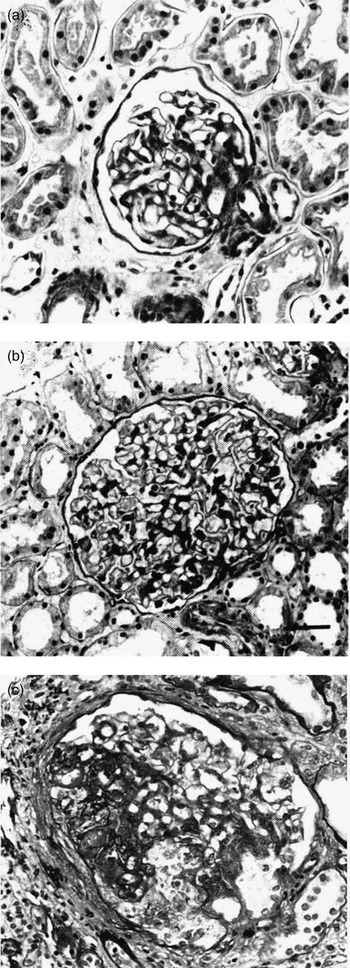
Findings in 178 renal biopsies of Aboriginal people with CKD in the remote Northern Territory hint at pathways through which nephron deficiency might educe and facilitate renal disease.Reference Howard, Davis, Pugsley, Seymour and Hoy166–Reference Young, Hoy, Kincaid Smith, Seymour and Bertram168 All the ‘specific’ renal diseases are represented in that series, but there is almost uniformly a background of glomerulomegaly, often with segmental sclerosis. That phenomenon is represented in sequential stages, which correlate well with disease severity-isolated glomerulomegaly, glomerulomegaly with mesangial hypertrophy and hyperplasia, focal podocyte foot process effacement, focal segmental tuft injury (FSGS – mostly perihilar), established FSGS and, then finally, global glomerulosclerosis (Fig. 13).Reference Young, Hoy, Kincaid Smith, Seymour and Bertram168 In this series, mixed pathology is frequent, and changes of postinfectious glomerulonephritis, mesangial IgA deposition, diabetic change and interstitial nephritis often coexist, against a common background of glomerular enlargement – the morphologic manifestations of a multi-determinant kidney disease model.
Glomerulomegaly and segmental glomerulosclerosis in renal biopsies from Aboriginal people in the Northern Territory of Australia. (a) Normal glomerulus, (b) Large glomerulus and (c) Glomerulosclerosis (Young et al.Reference Young, Hoy, Kincaid Smith, Seymour and Bertram168).

More recently, similar findings were described among many diseased renal biopsies in a nationwide review of more than 700 participants from indigenous people across Australia.Reference Hoy, Samuel and Hughson169–Reference Hoy175 In that series, the glomerulomegaly/glomerulosclerosis phenomenon and the frequency of mixed pathologies were more prominent in Aboriginal people from remote areas. Remote areas also have the greatest degree of socio-economic disadvantage, lowest birth weights, worst diets and least genetic admixture, as well as the highest rates of renal failure and all-cause mortality.
Type 2 diabetes is now very common among Indigenous Australians.Reference Hoy, Kondalsamy Chennakesavan and Shaw176 In both the Northern Territory and the nationwide indigenous biopsy series, 48% of patients had diabetes at the time of biopsy, and fewer than half of those (and 29% of all the people in the biopsy series) had pathognomonic diabetic change in their biopsies.Reference Hoy, Samuel and Hughson169, Reference Kincaid Smith, Hoy and Hughson170, Reference Douglas-Denton, Hoy and Bertram172–Reference Hoy175 Thus, it is not correct to attribute most excess ESRD in Aboriginal Australians to type 2 diabetes, although diabetes might be playing a facilitating role in some instances, and undoubtedly shares risk factors, including low birth weight, with CKD. Indeed, longitudinal study has shown that albuminuria precedes and predicts diabetes in some individuals sometimes by many years.Reference Hoy, Kondalsamy Chennakesavan and Shaw176, Reference Wang and Hoy177
This putative model of multi-determinant kidney disease precipitated or exacerbated by nephron deficiency has analogies in individuals with remnant kidneys, with congenital nephron deficiencies, including oligomeganephronia, with very low birth weight, and in premature children and survivors of neonatal acute renal failure. It shares some features with the nephropathy of obesity. In populations, this putative model should pertain to the developing world, where large cohorts of low birth weight children are now surviving to adolescence and adult life, potentially at risk for chronic diseases, including kidney disease. It should similarly apply to disadvantaged populations within developed countries. In all instances, additional hypertrophic stress on nephrons of excessive childhood and adult weight, as well as hypertension and diabetes, is probably undesirable.
Conclusion
In summary, early life experiences influence kidney development and function. This in turn is reflected in hypertension, cardiovascular risk and predisposition to renal disease. The effects of renal risk are reflected in overt renal disease in people with serious early insults, in facilitation of renal dysfunction in the presence of other processes, and in acceleration of renal functional loss with aging. Early life effects are probably one set of risk factors operating, in multi-determinant models, in the context of other prenatal risk factors (like genetic and epigenetic influences) and of postnatal factors throughout the life course. In all environments, attention to modifiable risk factors is recommended.
Many areas require further study. These include the effects of infant malnutrition on kidney development or maturation, the ability to modify gene expression and an adverse intrauterine course, and the potential to downregulate or reverse individual glomerular hypertrophy. In addition, we need techniques to non-invasively diagnose at-risk states, which are manifest through low nephron number, glomerular hypertrophy and volume heterogeneity and vascular change.