INTRODUCTION
Most of what is known about killer whale (Orcinus orca Linnaeus, 1758) biology has come from studies outside the north-west Atlantic. Previous knowledge of the species in this region has been based largely on opportunistic encounters (e.g. Sergeant & Fisher, Reference Sergeant and Fisher1957). Systematic monitoring of killer whales in Atlantic Canada did not begin until 1979, and remains limited in scope (reviewed in Lien et al., Reference Lien, Stenson and Jones1988). The Department of Fisheries and Oceans (DFO), Memorial University (MUN), and several non-governmental organizations (NGOs) began to collect additional systematic and opportunistic sightings, and behaviour data on killer whales in the Newfoundland and Labrador Region in the early 1980s. Since the mid-2000s, with the increased public awareness of this species due to public education efforts, DFO interview surveys to collect data for Species at Risk and collaborative research with colleagues in the French colony of St Pierre and Miquelon, which is 22 km off the south coast of Newfoundland, a higher rate of killer whale sighting reports have been documented.
Killer whales were considered competitors to whaling operations in eastern Canada until the cessation of whaling in Canada in 1972. They were killed by whalers on some occasions (Sergeant, Reference Sergeant1953; Mitchell & Reeves, Reference Mitchell and Reeves1988), but rarely taken as a target species. Perhaps as a result of these persistent threats, and a possible decline in prey abundance, this species was sighted relatively rarely in the western Atlantic until recently. Killer whales are most often sighted in temperate coastal waters (Ford, Reference Ford, Perrin, Wursig and Thewissen2002), and sightings records in the western Atlantic extend from the north-eastern United States to the Bay of Fundy and the Gulf of St Lawrence and north to the Arctic (Sergeant & Fisher, Reference Sergeant and Fisher1957; Garrett & Garrett Keays, Reference Garrett and Garrett Keays1985; Whitehead & Glass, Reference Whitehead and Glass1985; Katona et al., Reference Katona, Beard, Girton and Wenzel1988; Lien et al., Reference Lien, Stenson and Jones1988; Reeves & Mitchell, Reference Reeves and Mitchell1988b, Forney & Wade, Reference Forney, Wade, Estes, Brownell, DeMaster, Doak and Williams2007; Young et al., Reference Young, Higdon and Ferguson2011). While suggested in the literature, there is currently no evidence of seasonal migratory movements for killer whale populations in Atlantic Canada (e.g. Sergeant & Fisher, Reference Sergeant and Fisher1957; Mitchell & Reeves, Reference Mitchell and Reeves1988; Reeves & Mitchell, Reference Reeves and Mitchell1988a). It is also unknown whether killer whales from populations in adjacent areas such as Greenland and Iceland mix with whales from eastern North America. While one killer whale satellite-tagged in the eastern Arctic travelled a long distance south, passing through the offshore periphery of this study area (Matthews et al., Reference Matthews, Luque, Petersen, Andrews and Ferguson2011), interaction between the Canadian Arctic killer whale population and whales further south such as those in this study remains unknown.
To assess the killer whale's role as a predator and its susceptibility to anthropogenic threats in this region, information on the species’ distribution and abundance is required. This information can be gained through a combination of photographic identification and directed and opportunistic sightings collection. We present results for an on-going study of killer whales in the north-west Atlantic. For the first time, we provide a minimum abundance estimate based on a growing photo-identification catalogue and documentation of the historic, current and seasonal distribution and sighting patterns for this species here using the largest database for the north-west Atlantic analysed to date.
MATERIALS AND METHODS
Assessing distribution and group size
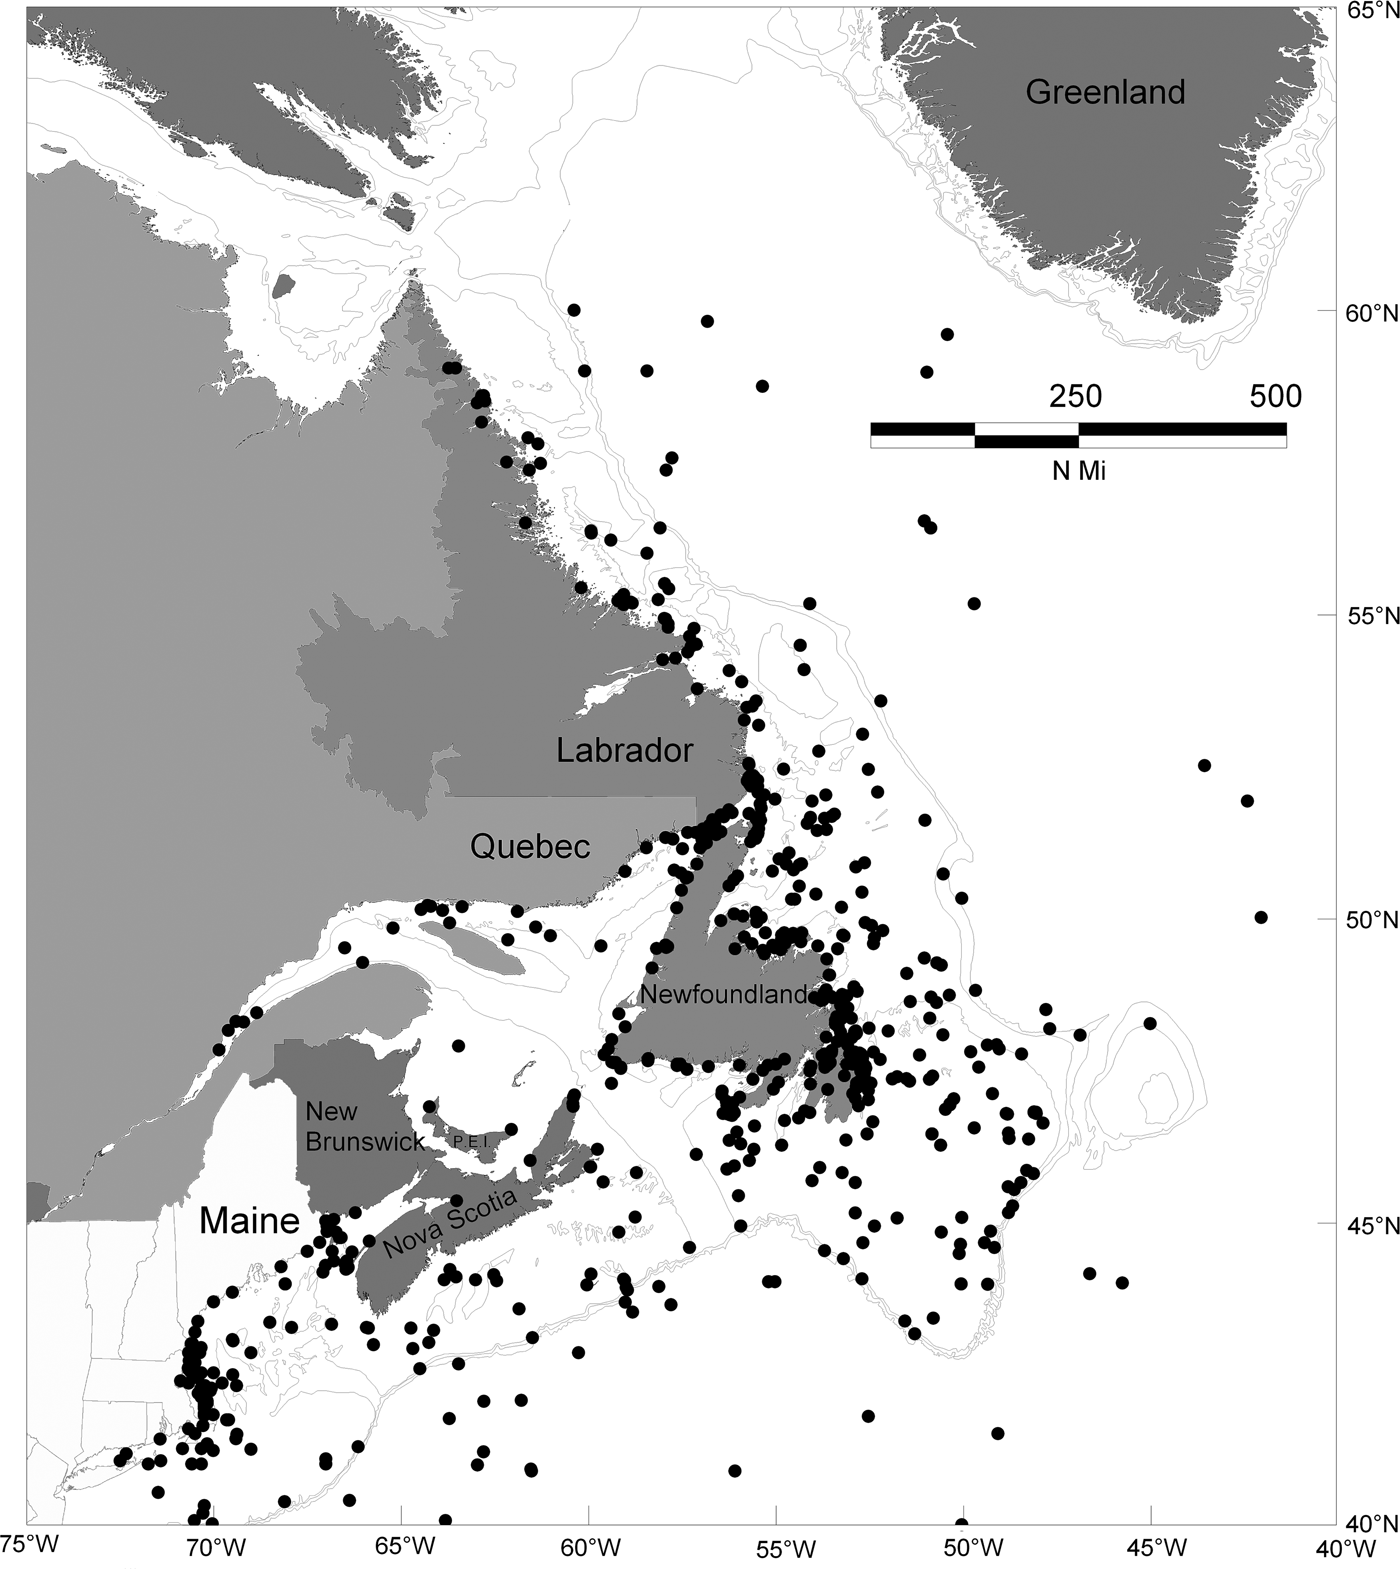
A large-scale marine mammal sightings database for the province of Newfoundland and Labrador is maintained at DFO. It includes killer whale (Orcinus orca) sightings, and is based on opportunistic and directed observer effort, with the latter from systematic aerial and vessel-based surveys conducted by DFO and Coast Guard staff and others. For this study, the authors also collected killer whale sightings data provided in the literature and unpublished records for the rest of Atlantic Canadian and north-eastern US waters. Tour boat operators, fishermen, oil industry operators, commercial ship crew and other members of the public also provided killer whale sightings data. Irrespective of the source, sightings were used only if they came from known or reliable sources, or were accompanied by photographic records that substantiated a positive killer whale identification. Sightings that had detailed location descriptions or GPS records were aggregated and mapped using MapInfo GIS software (v.9.0). For the northern and southern limits of this study, we did not include data from the eastern Arctic above 60o north latitude (for a description of these Arctic sightings, see Higdon et al., Reference Higdon, Hauser and Ferguson2012) or US waters south of 40o latitude, where few sightings of this species have been recorded (Figure 1). Water depth values were derived for sightings records using the GIS system if they were not recorded at the time of the sighting. In a small proportion of the sighting events a range of group sizes were given; the smaller of these two values was used in the summary group size statistics to provide the most conservative total.
Map depicting 832 of 836 sightings of killer whales in the north-west Atlantic. Bathymetry of 200 and 1000 m is also indicated. Each sighting, indicated by a black dot, represents one encounter with a group of killer whales or lone individual on a particular date. This plot includes locations for a small number of dead, stranded and ice entrapped individuals. Not shown are sightings recorded in the eastern Canadian Arctic (above 60°N), Greenland and the relatively few in US waters south of 40°N.

Assessing minimum abundance
Approximately 10% of the sightings records in the entire study area included photographs of the whales. We aggregated the photographs gathered by a broad array of public and governmental contributors into a digital catalogue using Adobe Lightroom (v.4.3) image management software. The relatively few paper- and slide-based images were scanned at high resolution (1200 dpi) on an Epson Perfection V750 Pro flatbed scanner. The inclusion of a photograph in the catalogue was dependent on it containing sufficient image detail to allow identification and metadata on location, date and group size. Most images (>70%) were not of sufficient quality to permit individual identification. As in other killer whale studies (e.g. Elis et al., 2008; Olson & Gerrodette, Reference Olson and Gerrodette2008), images of the left side of the whales were used preferentially to identify individuals in the catalogue, although several individuals were identifiable using images of both right and left sides because of dorsal fin scarring. By visual comparison of image catalogues in the north-west Atlantic and British Columbia, killer whales in the north-west Atlantic study area displayed fewer conspicuous unique features that could be used to identify individuals at a distance (such as dorsal fin notches or large body scars, image data on file); many of the distinguishing colour and/or scarring patterns could only be ascertained from higher-quality images or close approach at sea. Most of the images (>90%) in this catalogue have come from the Newfoundland and Labrador area; fewer killer whales were identified from other areas of the north-west Atlantic due to the frequency and distribution of sighting events concentrated around Newfoundland and southern Labrador (Figure 1).
Age-classes were determined based on the sizes of the whales, and sex by dorsal fin size and shape; juvenile males could appear similar to females and hence were not sexed based on dorsal fin shape.
We derived a minimum population estimate based on the total number of unique individuals in the imagery catalogue. In order for an individual killer whale to be added to the catalogue and given a catalogue number, its left-side photograph must have been processed through the existing catalogue images and confirmed unique by not matching an existing catalogued whale (as per Ellis et al., Reference Ellis, Towers and Ford2008). Several killer whales have been identified solely based on right-side photographs. We summed the number of unique individuals to derive our minimum population estimate.
RESULTS
Killer whale distribution
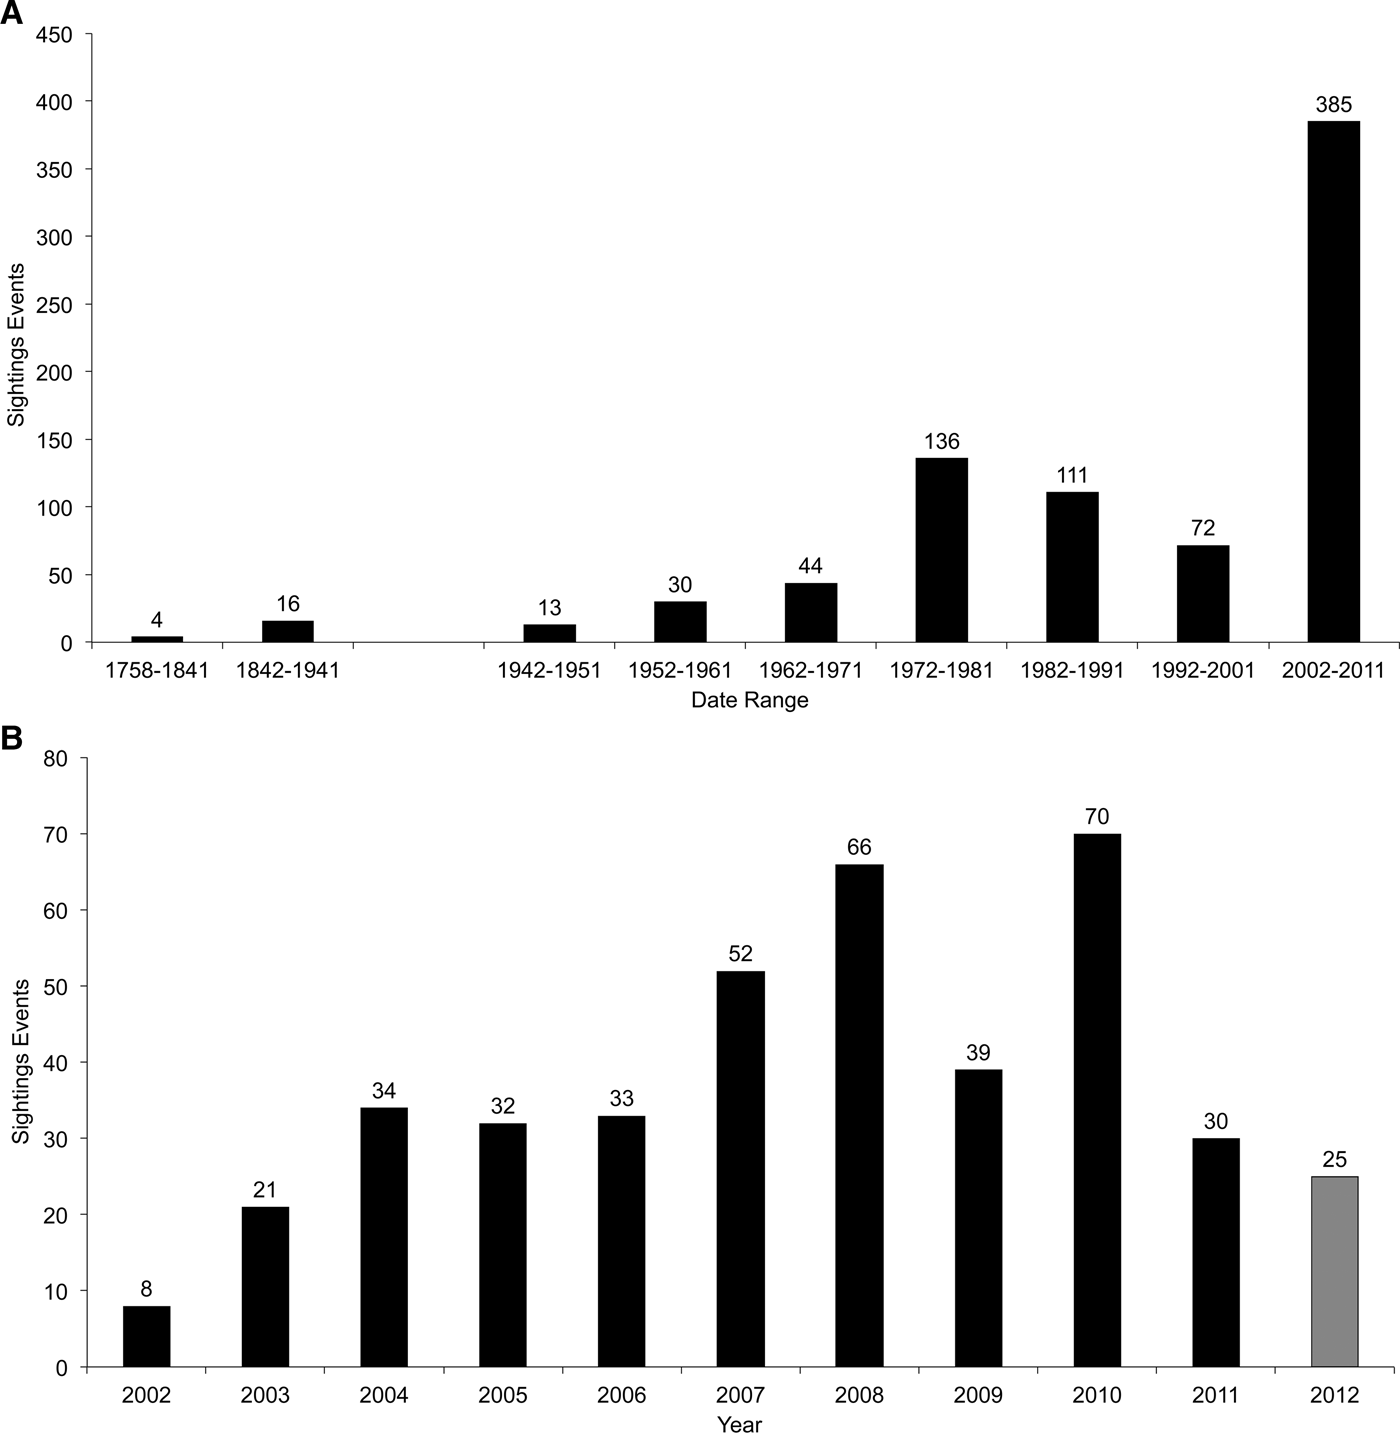
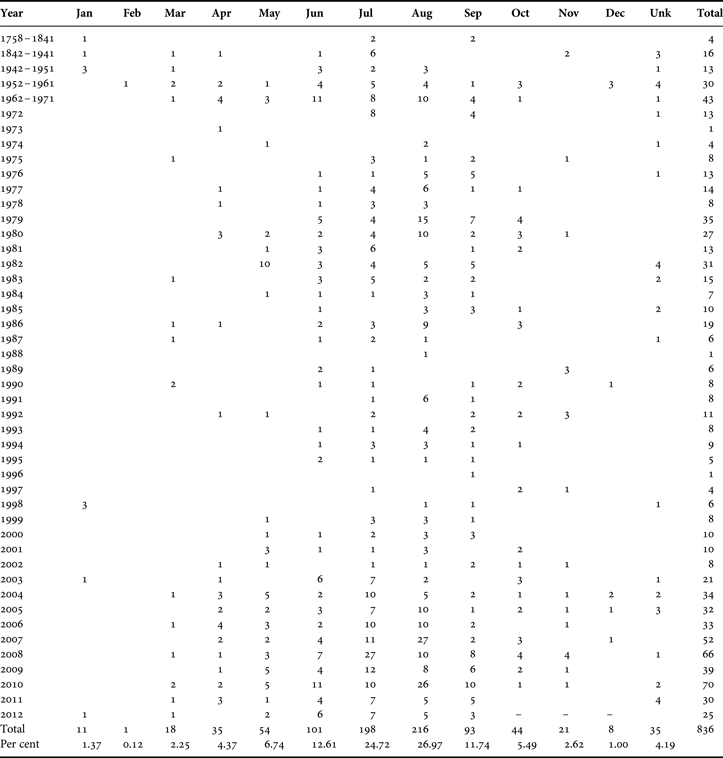
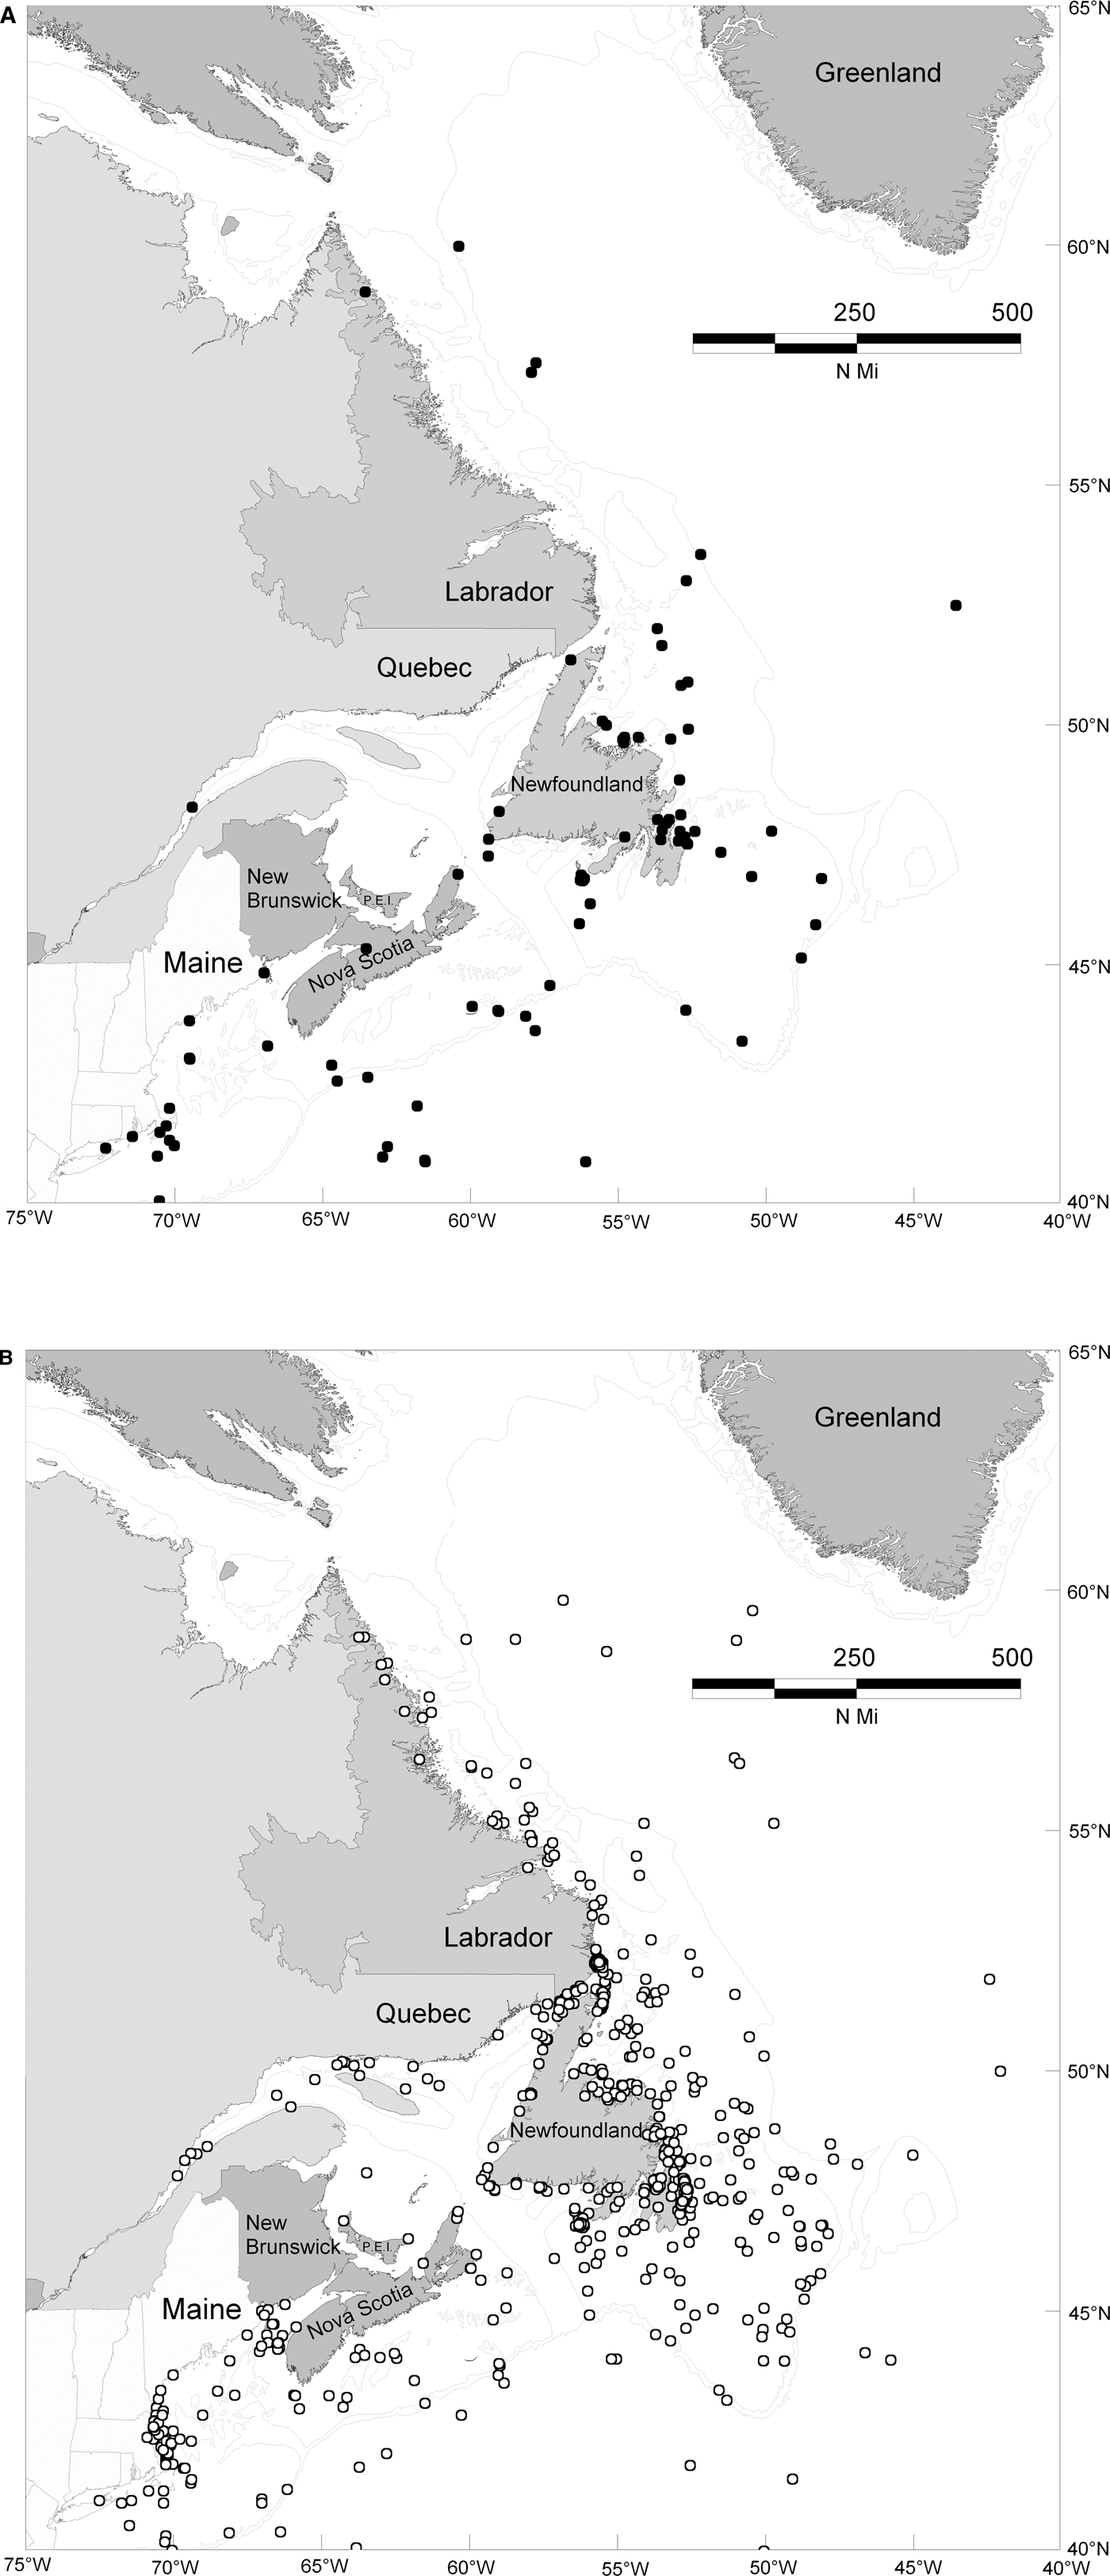
There have been 836 sighting events (using the lower value where there was a range given for group size, N > 3993 killer whales) reported in this north-west Atlantic study area between 1758 and 2012 (Table 1; Figure 1), with the vast majority (97.0%) of sightings recorded since 1950, and almost half (48.1%) in the last ten years. Further, most of these sightings occurred in the waters of Newfoundland and Labrador (Figure 1). This temporal pattern may reflect observer effort, with increased effort and sightings in recent years (Figure 2A). Further examination of the 2002–2012 period, when DFO in the Newfoundland and Labrador region began to assess cetaceans more fully and consistently, reveals a variable annual sighting rate (Figure 2B). While most sightings have been made relatively close to shore, there have also been lone and groups of killer whales sighted further than 50 nautical miles from shore (hereafter termed ‘offshore’) (Figure 1).
(A) Number of reported killer whale sighting events for larger intervals for the initial period 1758–1941, and per decade thereafter, 1942–2011, in the north-west Atlantic; (B) number of reported killer whale sighting events each year during the 2002–2012 period. The 2012 period, indicated in grey, extends from January to September only. The values above each bar are the total numbers of sighting events for that date range or year.
Annual records, subdivided by month, of killer whale sightings in the north-west Atlantic. Data sources listed in the text. Data are aggregated into larger time periods prior to the cessation of whaling in Canada in 1972 (see also Figure 2).
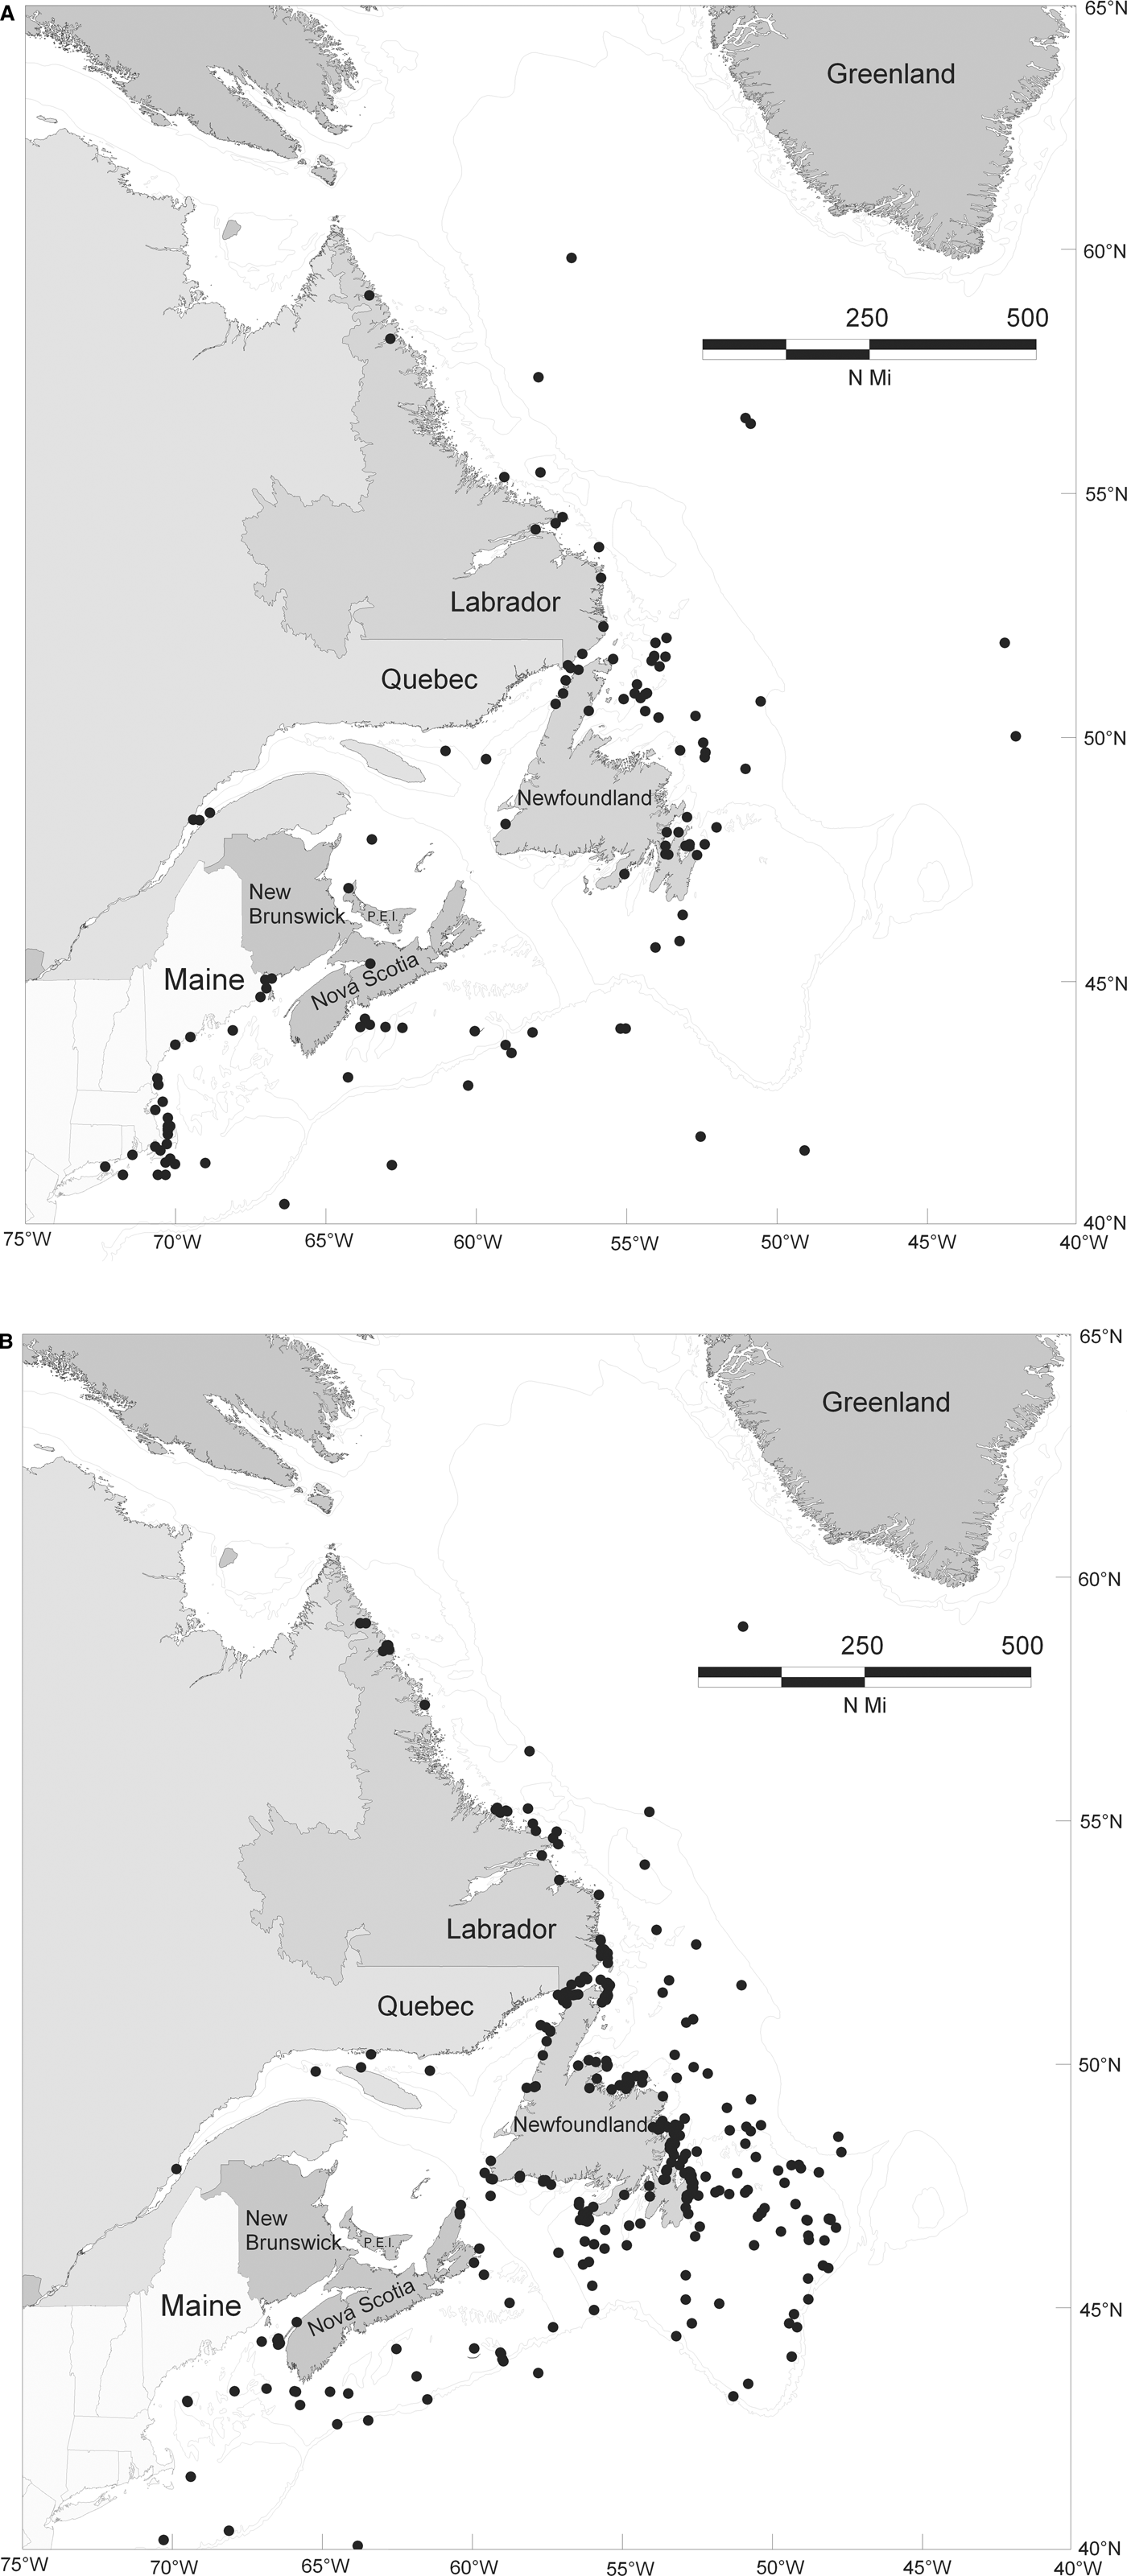
Infrequently, killer whale sightings and rarer ice entrapments have been reported along the western shelf of Newfoundland and St George's Bay, south-west Newfoundland (Figures 1 & 3).
Maps depicting (A) pre-1972 and (B) 2002–2012 sighting events for killer whales in the north-west Atlantic. Not shown are sightings recorded in the eastern Canadian Arctic (above 60°N), Greenland or the relatively few in US waters south of 40°N.
Relative to waters near Newfoundland and Labrador, killer whales have been reported much less frequently from coastal Nova Scotia, the Gulf of St Lawrence, the Bay of Fundy and, in recent years, most of the north-eastern USA (Figure 1). Killer whales were seldom seen in the north-eastern USA, despite many years of aerial and shipboard cetacean surveys conducted by the National Marine Fisheries Service (D. Palka, National Marine Fisheries Service, Woods Hole, MA, USA, personal communication), and considerable marine vessel traffic. On the other hand, the many tour boat operations and intensive right whale (Eubalaena glacialis) survey effort have provided only a small number of killer whale sightings off the coast of Massachusetts and in the Bay of Fundy. There are apparent killer whale ‘hotspots’ (e.g. regions with a substantially higher number of sighting events relative to surrounding areas), such as southern Labrador/Strait of Belle Isle, eastern Newfoundland, the islands of St Pierre and Miquelon on Newfoundland's south coast, the southern Bay of Fundy and coastal Massachusetts (Figure 1).
There is a reduction in number of killer whale sightings outside the summer months, and with fewer from small vessels (unpublished data), though this is likely a product, to some degree, of decreased observer effort due to weather and ice conditions. The distribution patterns for sightings in the winter/spring period (when sea ice is present off Labrador and northern Newfoundland and many marine mammal and seabird species are absent or scarcer; Figure 4A) are similar to the summer/autumn (Figure 4B; Table 1). Distribution patterns for sightings in the northern and southern portions of the study area are also similar. Killer whales have been sighted in all months of the year, with most seen during the May–October period (86.7%) (Table 1; Figure 4). The seasonal arrival of pack ice could limit the distribution of cetaceans on the nearshore Labrador, the Gulf of St Lawrence and the northern coast of Newfoundland, but killer whale sightings have still been reported in areas off the coast of Labrador in the winter/spring period (Figure 4A). There has been a single report of killer whales within the nearshore ice fields of northern Newfoundland in the vicinity of breeding harp seals in both 2007 and 2011 (J.W. Lawson, unpublished data). Previously, in the same area, in mid-March of 1970, killer whales were observed surfacing in a lead through broken pack ice near a breeding patch of thousands of harp seals (D. Sergeant, unpublished data).
Maps depicting the (A) winter/spring (November–April) and (B) summer/autumn (May–October) sighting events for killer whales in the north-west Atlantic. Not shown are most of the sightings recorded in the eastern Canadian Arctic (above 60°N), Greenland or the relatively few in US waters south of 40°N.
Almost all killer whales sightings have occurred in water depths of less than 200 m (Figure 1), but this may be a function of observer effort, which is concentrated nearer to shore and on the relatively shallow Grand Banks. Killer whales have been reported in mid-Atlantic waters in excess of 3000 m; fishing and maritime patrol vessels sight and report groups of these whales several hundred kilometres from the coast on the Grand Banks every year. It is suspected that killer whales move between nearshore and offshore areas, but whether such movements are a regular behaviour of these whales in the north-west Atlantic awaits further imagery from offshore areas.
Killer whale movement patterns are apparent in the study area through documenting the locations of identified individuals over time. Some groups of these whales have been seen at locations hundreds of kilometres apart in different years. Within any one year, known killer whales have moved more than 900 km (such as swimming from the south coast of Newfoundland to southern Labrador), whereas other groups have been sighted multiple times over a period of three weeks and at nearshore locations within 150 km of each other (unpublished data).
Killer whale group size
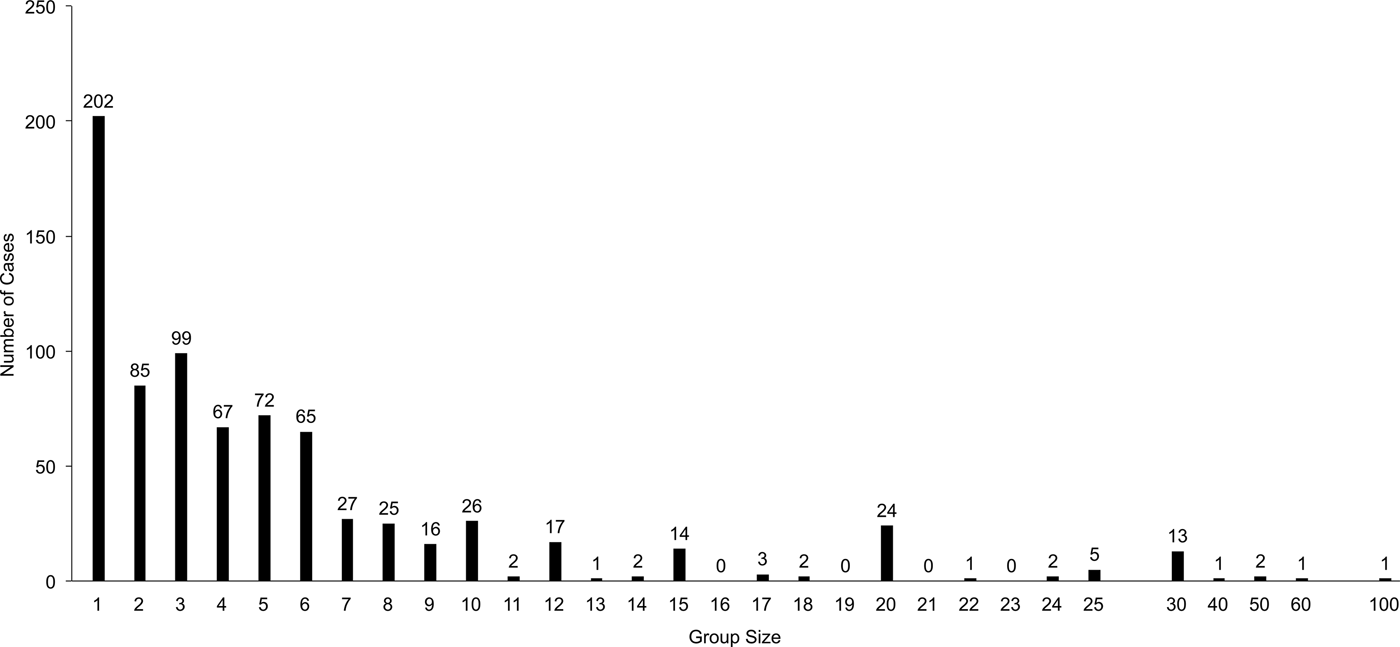
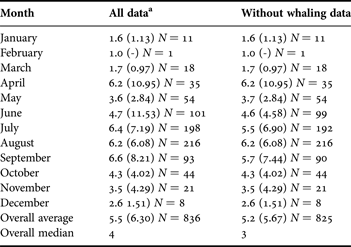
Killer whales have been sighted both alone (24.2% of sighting events) and in groups of up to 100 animals (Figure 5), with approximately half of the larger group size records being associated with whaling operations in the 1970s. For all data combined, the average killer whale group size in the study area was 5.5 whales (SD = 6.30) (6.7 whales per group of two or more animals) (Table 2), and the median was four whales per group. When we excluded the large killer whale groups that had been reported near whaling vessels, as they likely represented whales from multiple smaller groups attracted to a prey source (N = 40 cases) (see Reeves & Mitchell, Reference Reeves and Mitchell1988b), the average killer whale group size declined to 5.2 whales (SD = 5.67), with a median of three whales per group. Group sizes were significantly larger during the summer months (May–October) (F = 7.907, P = 0.005). Vladykov (Reference Vladykov1944) reported groups of up to 40 killer whales in the St Lawrence Estuary decades ago, but such large groups have not generally been reported recently. In 2002 an unconfirmed sighting of a group of 50–60 killer whales was reported in the southern portion of the Laurentian Channel by the crew of a Canadian navy vessel in April, although the viewers were not experienced marine mammal observers. There has been no significant trend in the sizes of killer whale groups since the end of the Canadian whaling period (R 2 = 0.007).
Number of cases of killer whale sighting events per group size-interval for the years 1758–2012, in Atlantic Canada and the north-eastern USA. The values above each bar are the total numbers of sighting events for that group size-interval.
Monthly records of killer whale average group sizes in the northwest Atlantic. Values are means (SD), except where noted.
a, the average group size values do not include the contribution of a few sighting records of larger (N > 30 individuals) killer whale groups associated with whaling operations (see Reeves & Mitchell, Reference Reeves and Mitchell1988b). Overall summaries include data with unknown month values.
Minimum number of killer whales in the north-west Atlantic
Approximately 70% of our more than 1700 photographs were not of sufficient quality, or the whales in the images did not display markings, scars or visible injuries, to identify individuals. Nonetheless, based on the photographic records that did contain sufficient information, we identified 67 unique killer whales in the study area, including 12 adult males, 42 adult females (some of these may have been juvenile males), 12 juveniles and one calf. Of these, one of the males identified from the Gulf of St Lawrence has not been re-sighted in 19 years; he is assumed to have died or left the region. Calves and younger killer whales are sighted every year, so new whales are being added to the population. There have been instances of known mortality (20 strandings and two fishing gear entrapments) since whaling ended in Atlantic Canadian waters in 1972.
The temporal discovery curve for new individuals is reflective of an increase in re-sightings in recent years as more people are contributing killer whale imagery. Although the probability of a re-sighting is largely effort-related, the continued positive slope of the discovery curve suggests that it is also likely that more individuals will be identified within this population, particularly since calves are sighted every year.
DISCUSSION
Killer whale distribution and group size
Descriptions of historic, seasonal and geographical killer whale distribution patterns are complicated by the fact that most of the sightings data do not have associated observer effort measures. Similar to the Canadian eastern Arctic population (Higdon et al., Reference Higdon, Hauser and Ferguson2012), it appears that the rate of killer whale sightings has increased in Newfoundland and Labrador in the last decade. However, this may be a function of several factors rather than solely an increase in killer whale abundance or changing distribution patterns. For instance, there has been an increase in the number and dispersion of tour boat operations in Newfoundland and Labrador. This signifies that there are more people on the water searching for marine mammals. Additionally, many of these tour operators are better informed with regards to being able to properly identify and document whale sightings. Observation effort is also not equal throughout all regions of the study area; fewer sightings on the northern Labrador coast and in offshore areas may be related to less observer effort relative to southern and nearshore areas.
It appears that some potential killer whale hotspots are not necessarily a reflection of greater observer effort during particular months; a considerably large number of killer whales have still been reported off the east coast of Newfoundland and in the Strait of Bell Isle, even during the winter and spring months when there are fewer people at sea, suggesting that these areas are important throughout the year for these whales. Results of systematic vessel-based surveys, acoustic monitoring and satellite tagging studies will provide the effort-weighted killer whale records needed to corroborate the distribution patterns reported in this study.
There have been 836 sighting events of killer whales reported in this north-west Atlantic study area since 1758, with almost half collected in the last ten years in the waters of Newfoundland and Labrador. This temporal pattern is likely in part due to an increased public awareness for this species in Atlantic Canada and greater research effort by DFO and affiliates in Newfoundland and Labrador in recent years. While most sightings have been made relatively close to shore, there have also been lone and groups of killer whales sighted in offshore areas, including water depths exceeding 3000 m. For example, killer whales have been sighted by fisheries observers in offshore longline and gill-net fisheries off northern Labrador and on the Grand Banks (note that water depths on the Grand Banks are often less than 200 m). Mitchell (Reference Mitchell1975) suggested that killer whale abundance was greatest within 800 km of shore in cold waters of both hemispheres, although recent studies have found populations of killer whales that live and forage in offshore waters (e.g. Dahlheim & Towell, Reference Dahlheim and Towell1994; Barrett-Lennard & Ellis, Reference Barrett-Lennard and Ellis2001). In 2009, a satellite-tagged killer whale swam from the eastern Canadian Arctic to the Azores using an offshore route (Matthews et al., Reference Matthews, Luque, Petersen, Andrews and Ferguson2011).
In the Gulf of St Lawrence, occasional sightings have been reported along the western coast of Newfoundland and St George's Bay, south-west Newfoundland (Lien et al., Reference Lien, Stenson and Jones1988). Previous ice entrapments of killer whales in St George's Bay indicate that killer whales occur occasionally on the south-west coast of Newfoundland (and in association with dynamic ice environments; Mitchell & Reeves, Reference Mitchell and Reeves1988). Despite there being many potential prey, it is puzzling why relatively few killer whales have been sighted in the Gulf of St Lawrence in recent decades (e.g. Lesage et al., Reference Lesage, Gosselin, Hammill, Kingsley and Lawson2007) since Vladykov (Reference Vladykov1944) reported that killer whales ‘infested’ the St Lawrence during spring and autumn, with at least one group of 40 killer whales in the St Lawrence estuary attacking beluga whales (Delphinapterus leucas). Both beluga whales and Atlantic walrus (Odobenus rosmarus rosmarus) were hunted heavily by humans in the St Lawrence area (Kingsley, Reference Kingsley1998; Lesage et al., Reference Lesage, Gosselin, Hammill, Kingsley and Lawson2007; DFO, 2008), to the point where the latter were extirpated and the former remain at lower population levels. If killer whales were relying on such populations as prey, these beluga and walrus declines could explain why killer whales are rarely seen in the Gulf of St Lawrence in the last few decades (e.g. Mitchell & Reeves, Reference Mitchell and Reeves1988).
Compared to waters near Newfoundland and Labrador, killer whales have been reported less frequently from coastal Nova Scotia, the Bay of Fundy, and most of the north-eastern USA. For example, despite aerial and shipboard cetacean surveys conducted over many years, and with coverage from the coastline to shelf break over thousands of kilometres of trackline, by the National Marine Fisheries Service in the north-eastern USA, killer whales were seldom seen (e.g. Palka, Reference Palka2012). Tour boat operations and right whale survey effort have provided rare killer whale sightings off the coast of Massachusetts. There has been a relatively limited number of observations of killer whales from the eastern US seaboard south to the equator, signifying their rarity in these waters in recent years (Katona et al., Reference Katona, Beard, Girton and Wenzel1988). As for the Gulf of St Lawrence, it is surprising that killer whales are not more common in north-eastern US waters which are similarly replete with potential prey and lack competitors for mammal-eating groups of this species.
Preliminary evidence of killer whale movement patterns in the study area is manifest through multiple records of the locations of known individuals over time. Some groups of these whales have been seen at locations hundreds of kilometres apart in different years. Within any one year, a few known individual killer whales have been re-sighted at locations almost 1000 km apart (such as between the south coast of Newfoundland and southern Labrador), whereas other whales have been sighted multiple times over a period of a few weeks and at nearshore locations within 150 km of each other. One identified whale was seen nearshore in July and then an offshore location several weeks later, indicating movement of killer whales between these areas does occur. It is unknown if populations in adjacent areas such as Greenland and Iceland mix with those in eastern Canada. Despite the apparent range of movements of this species in the north-west Atlantic indicated by individual re-sightings in this study and the movements of a killer whale satellite-tagged in the Arctic (Matthews et al., Reference Matthews, Luque, Petersen, Andrews and Ferguson2011), there is not yet evidence that there is either a single stock spread over a large range in the north-west Atlantic or intermixing of subpopulations.
It has been suggested that killer whales in the north-west Atlantic might migrate seasonally (Sergeant & Fisher, Reference Sergeant and Fisher1957; Mitchell & Reeves, Reference Mitchell and Reeves1988), but this has yet to be documented by movements of identified killer whales or satellite telemetry studies. The presence of sea ice appears to constrain the northern distribution of this species in the winter and early spring. Sighting rates are lower during the winter/spring period, which may be suggestive of a northward movement of killer whales during the summer/autumn period. Some sightings of identified killer whales in this study region appear to show that these whales follow a south-to-north progression, appearing first along the south coast of Newfoundland and predictably later in the summer/autumn along the northern shore and southern Labrador coast. Sea ice does not appear to be a severe distribution constraint for killer whales in some other areas of the world; at least one Antarctic killer whale ecotype hunts within pack ice (Gill & Thiele, Reference Gill and Thiele1997; Lauriano et al., Reference Lauriano, Vacchi, Ainley and Ballard2007) and a satellite-tagged killer whale was able to move through pack ice of 30% coverage in the eastern Canadian Arctic (Matthews et al., Reference Matthews, Luque, Petersen, Andrews and Ferguson2011). In mid-March 1970, killer whales were observed surfacing in a lead through broken pack ice, near a small breeding patch of harp seals (D. Sergeant, unpublished data). However, it is intriguing that despite more than 40 y of intensive monitoring of the pack and land-fast ice near the extensive harp (Pagophilus groenlandicus) and hooded seal (Cystophora cristata) breeding aggregations off southern Labrador, northern Newfoundland or in the Gulf of St Lawrence, killer whales have never been seen or photographed by DFO. During these same DFO surveys, other cetaceans, such as white-beaked dolphins (Lagenorhynchus albirostris) and fin whales (Balaenoptera physalus), have been sighted. Since killer whales in the north-west Atlantic are known to feed on large and small cetaceans, it is difficult to understand why they appear to forego the opportunity to feed on the annual aggregations of millions of pinnipeds that breed on annually-predictable sea ice in this region. Perhaps the risk of entrapment for the killer whales in the highly dynamic pack ice environment is too great to hunt such prey, or the use of ice as a predator refuge is too successful.
Killer whales have been sighted both alone and in small groups of 2–6 individuals in the north-west Atlantic (average and median group size of 5.2 and 3, respectively). The group sizes we report are slightly lower than those described in adjacent eastern Arctic waters, where groups ranged from 1 to 100 whales (average and median group size of 8.3 and 4, respectively) (Higdon et al., Reference Higdon, Hauser and Ferguson2012). Further, the average north-west Atlantic group size is smaller than those that have been reported for northern and southern resident killer whale pods in British Columbia, which combined had an average pod size of 12 individuals (range 3–59) (Bigg et al., Reference Bigg, Olesiuk, Ellis, Ford and Balcomb1990) and Type B killer whales in the Antarctic (average pod size of 11.8 individuals (range 2–31) (Pitman & Ensor, Reference Pitman and Ensor2003). Group size in this study area corresponds more closely with group sizes of British Columbia transient killer whale groups (average range 2–6) (Wagemann & Muir, Reference Wagemann and Muir1984). Baird & Dill (Reference Baird and Dill1996) described sightings of lone adult male and female British Columbia transient killer whales, so whether the lone eastern Canadian whales are actually lone animals or temporarily out of observer range of a group of animals is not known in most instances. Groups of two or more whales ranged in size up to 100 individuals, with approximately half of the largest group size records being associated with whaling operations. Some of these large groups were second-hand reports from less-experienced observers, so the identity and number of whales may be erroneous; for instance, two recent reports of killer whale groups were determined to be long-finned pilot whales (Globicephala melas) when photographs were reviewed. Some of the killer whale groups seen in the study area may represent temporary aggregations, as several animals have been photographed with more than one group on different occasions. There is evidence of long-term social affiliations amongst some of these whales (see Lawson et al., Reference Lawson, Stevens and Snow2007), whereas other identified killer whales have been seen in more than one grouping over the course of a single season to several years, suggesting fluid association patterns.
We have no recent reports of killer whale group sizes in this study area reaching several hundred, as has been seen occasionally in other parts of the world (e.g. Perrin, Reference Perrin1982; Luque et al., Reference Luque, Davis, Reid, Wang and Pierce2006). Norwegian killer whale group sizes range from 6 to 30 individuals and exhibit a strong seasonality in their distribution, which is documented to be a function of the migration and life cycle pattern of Atlantic herring (Clupea harengus) (Similä et al., Reference Similä, Holst and Christensen1996). We might expect a similar movement pattern in the north-west Atlantic for killer whales that are migrating to feed on fish that aggregate seasonally here, such as capelin (Mallotus villosus) and herring. The larger average group size in summer months might reflect an aggregation of killer whales to the dense prey patches afforded by spawning capelin. No relationship between group size and feeding preferences has yet been documented in the north-west Atlantic killer whale population.
Minimum number of killer whales in the north-west Atlantic
Undoubtedly, the total of 67 identified killer whales in the north-west Atlantic, based on our photographic catalogue, is an underestimate of the true population. This is partly a function of a large portion of the imagery in the catalogue either being of insufficient quality, or the whales in the images did not display markings, scars or visible injuries, to make an individual identification possible. By visual comparison of image catalogues in the north-west Atlantic and British Columbia, it is apparent that, relative to killer whales in British Columbia (e.g. Ellis et al., Reference Ellis, Towers and Ford2008), many of those imaged to date in the north-west Atlantic display fewer unique and conspicuous features (T. Stevens, unpublished data), such as large scars and dorsal fin notches and cuts, that could be used to identify individual whales at a distance.
In addition to the paucity of obvious individual markings, the relatively large study area, coupled with relatively little observer coverage, may negatively bias our estimate of killer whale abundance in the region. For instance, most cetacean survey and NGO search efforts have been concentrated in a limited number of areas nearer to the coasts and rarely offshore. This species was not sighted during two previous nearshore aerial surveys in Newfoundland in 2002 and 2003, but several lone killer whales were sighted during DFO's large-scale aerial survey of the north-west Atlantic coastline in the summer of 2007 (Lawson & Gosselin, Reference Lawson and Gosselin2009). As for the eastern Canadian Arctic (Higdon et al., Reference Higdon, Hauser and Ferguson2012), aerial surveys are not an optimal means to assess abundance of this species relative to vessel-based photo-identification studies and acoustic monitoring efforts. Photographs accompany less than 10% of the sightings records in this study.
This north-west Atlantic estimate is higher than that in adjacent eastern Arctic waters, where 53 whales were identified from photographic records (Young et al., Reference Young, Higdon and Ferguson2011). The temporal discovery curve for new individuals appears to be strongly effort-related, albeit with an increase in re-sightings in recent years as more people are contributing imagery. Nonetheless, as in the eastern Arctic (Young et al., Reference Young, Higdon and Ferguson2011), its positive slope suggests that it is likely that more individuals will be identified for this population.
Killer whales may have been more abundant in the Gulf of St Lawrence in the last century (reviewed in Mitchell & Reeves, Reference Mitchell and Reeves1988; Lesage et al., Reference Lesage, Gosselin, Hammill, Kingsley and Lawson2007), but despite considerable aerial and vessel survey effort by DFO in recent years, very few killer whale sightings have been made in the Gulf of St Lawrence. This contrasts with British Columbia killer whale groups which are sighted regularly and whose total population (of residents, transients and offshore whales, N = 884; DFO, 2007, 2011; Ellis et al., 2010) is much larger than the north-west Atlantic current estimate. There have been no sighting or photographic records of large aggregations of killer whales near trawling operations in the north-west Atlantic, as have been reported off northern Scotland (group estimates as high as ‘200–300’; Luque et al., Reference Luque, Davis, Reid, Wang and Pierce2006), although groups of 4–6 killer whales escorting travelling fishing vessels for short periods are reported regularly in this region each year. Given the imagery and sightings data of this study, we conclude that the north-west Atlantic killer whale population is not as large as the north-eastern Atlantic, where it is estimated that there may be close to 10,000 killer whales in the Norwegian and Barents Seas, plus Icelandic and Faroese waters (Reyes, Reference Reyes1991). Known mortality events (DFO, unpublished data) for the last 40 y equate to at least one killer whale death every 2 y, with the real removal rate likely higher. If this population is small relative to other areas of the world, and not subject to immigration from adjacent populations in the eastern Atlantic, such a loss may limit population growth.
The continued sightings of new individual killer whales, and interactions with a variety of prey in Atlantic Canada, demonstrates that this species deserves further study effort to ascertain its role in the ecosystem. Biopsy sampling began in Newfoundland and Labrador in 2006 and autonomous acoustic recordings in 2008; these additional efforts should allow us to describe stock structure and genetic relationships amongst individual whales here and in adjacent areas such as the Arctic and Greenland. This would answer questions about seasonal and migratory patterns, and whether the killer whale population documented in this region interacts on any level with those in other areas. While distribution and relative abundance is notably difficult to ascertain in this region, compared with other locales in Atlantic Canada and the north-eastern USA, Newfoundland and Labrador appears to be an important, year-round habitat for killer whales.
ACKNOWLEDGEMENTS
G. Stenson and B. Sjare (DFO, Newfoundland and Labrador Region) provided valuable feedback on a draft of this paper. W. Ledwell (Whale Release and Strandings, Newfoundland and Labrador) provided the authors with historical records and more recent sighting records and imagery. In addition to many anonymous public contributors, we would also like to acknowledge the cooperation, sightings data and photographs provided by J. Detcheverry, T. Vogenstahl, R. Etcheberry in St Pierre, France, M. Shortall (Molly Baun), Reg Kempen (Sea of Whales) and tour operators in Trinity Bay, D. Snow (Wildland Tours), A. Erven, M. Earle (Battle Harbour Historic Trust) and P. Alcock (Northland Discovery Tours), US colleagues in Maine and Massachusetts and DFO staff at sea. T. Nash (Quebec–Labrador Foundation) provided several additional killer whale sighting reports for the Gulf of the St Lawrence. We thank D. Snow, K. Stevenson, L. Jellie and M. Tsang of Wildland Tours for directing us to field contacts and providing insights on north-west Atlantic killer whales based on their long experience. The manuscript was improved by two anonymous referees.
FINANCIAL SUPPORT
Funding for this project was provided by DFO (Species at Risk programme).