Information in real-life visual scenes is often organized hierarchically, comprising different levels. These can be more global (e.g. face) or more local (e.g. nose). Perception of these levels has been extensively explored by using multipart objects. An influential design, introduced by Navon (Reference Navon1977), uses compound stimuli in which global letters were built from smaller local letters. Despite numerous studies using this paradigm (reviewed by Kimchi, Reference Kimchi and Wagemans2015), it is still not clear to what extent these levels of information are processed by the same neural substrates. It has been suggested that the right cerebral hemisphere preferentially processes global information whereas the left hemisphere is biased towards detailed local processing (Flevaris, Bentin, & Robertson, Reference Flevaris, Bentin and Robertson2011; Heinze & Münte, Reference Heinze and Münte1993; Volberg & Hübner, Reference Volberg and Hübner2004). Nonetheless, dissent exists about the degree and cerebral localization of this proposed lateralization (Polster & Rapesack, Reference Polster and Rapcsak1994).
This pattern of hemispheric specialization is suggested by greater accuracy when recognizing global letters presented to the left visual hemi-field, but better accuracy in the opposite hemi-field for local letters (Volberg & Hübner, Reference Volberg and Hübner2004). However, this result has not always been found (Boles & Karner, Reference Boles and Karner1996), and reflects the brain organization only indirectly. Neuropsychological studies have generally found more impairment for global/local processing with right/left brain lesions respectively (Delis, Robertson & Efron, Reference Delis, Robertson and Efron1986; Robertson & Lamb, Reference Robertson and Lamb1991). Nevertheless, data from patients reflect the operation of brains undergoing re-organization due to neural plasticity, thus limiting the scope and generalization of possible conclusions.
Functional imaging offers the possibility of directly examining brain activity in typical subjects, which in the case of positron emission tomography (PET) and functional magnetic resonance (fMRI) can be done with moderate and high spatial resolution, respectively. However, the findings on lateralization of global/local processing with these techniques have been inconsistent and often contradictory. Some studies support the existence of the posited hemispheric asymmetry with a right/global and left/local specialization (Fink et al., Reference Fink, Halligan, Marshall, Frith, Frackowiak and Dolan1996; Martinez et al., Reference Martinez, Moses, Frank, Buxton, Wong and Stiles1997). Yet other studies have not found this pattern, or have even reported the inverse profile (Fink et al., Reference Fink, Marshall, Halligan, Frith, Frackowiak and Dolan1997). Note that fMRI (and more so PET) are limited by their poor temporal resolution, thus curtailing their ability to characterize how specialized hemispheric processing originates and evolves over time.
Despite their limitations for spatial localization, electroencephalografic (EEG) and magnetoencephalografic (MEG) recordings have excellent temporal resolution. Studies using event-related potentials/fields (ERPs/ERFs), which characterize the changes in EEG and MEG provoked by stimuli or mental events, have compared the scalp topography of responses when attending to the local and or to global level within compound letters for selected time points (or time window averages). Some authors have described larger amplitudes of the N2 waveform over the right cerebral hemisphere when attending to global stimuli, in contrast with a weaker lateralization to the left hemisphere when processing local figures (Volberg & Hübner, Reference Volberg and Hübner2004). Similar results have been also found when analyzing the P3 component (Volberg & Hübner, Reference Volberg and Hübner2004). However, this result has not been consistently observed (Han et al., Reference Han, Fan, Chen and Zhuo1997; Sasaki et al., Reference Sasaki, Hadjikhani, Fischl, Liu, Marret, Dale and Tootell2001). Moreover, these ERP studies are also equivocal about the timing of the processing stage defining the lateralization pattern, with early visual processing or later periods posited as candidates (Volberg & Hübner, Reference Volberg and Hübner2004; Iglesias-Fuster et al., Reference Iglesias-Fuster, Santos-Rodríguez, Trujillo-Barreto and Valdés-Sosa2015).
In a recent ERP study, Iglesias-Fuster et al. (Reference Iglesias-Fuster, Santos-Rodríguez, Trujillo-Barreto and Valdés-Sosa2015) described early selection negativities (SN; about 190 to 300 ms), elicited respectively by global and local stimuli that were enhanced when these stimuli were attended (relative to when they were unattended). In addition, a discrimination negativity (DN) was also obtained when recognizing infrequent targets, which was larger over the left hemisphere in both global and local letters. These negativities were isolated in a novel paradigm, using level specific letter presentation (López, Torres & Valdés-Sosa, Reference López, Torres and Valdés-Sosa2002; Valdes-Sosa, Iglesias, Torres, Reference Valdés-Sosa, Iglesias-Fuster and Torres2014) that enables recording the ERPs elicited by each level independently from those triggered by the other level. To achieve this, the paradigm dissociates the presentation of the two levels in time, something that this is not possible for traditional Navon stimuli for which global and local information are always displayed together. In the study by Iglesias-Fuster et al. (Reference Iglesias-Fuster, Santos-Rodríguez, Trujillo-Barreto and Valdés-Sosa2015), the SN was lateralized to the right when generated by global stimuli, and showed a tendency (albeit non-significant) to be lateralized to the left when elicited by local stimuli. However, they did not describe anticipatory or early sensory attentional modulations. Thus, similar to the previous literature, no conclusive information was available for describing the temporal evolution of the aforementioned specialized hemispheric processing.
The temporal evolution of lateralization induced by selective attention could consist of several stages. Consistent with the influential Biased Competition account (Desimone & Duncan, Reference Desimone and Duncan1995), some authors have suggested that a top-down attentional bias could be observed even during pre-stimulus baseline periods (Luck et al., Reference Luck, Chelazzi, Hillyard and Desimone1997). This goal-directed attention increases neuronal baseline activity and enhances the subsequent neural activation elicited by the stimulus onset. Effects consistent with this notion have been described across different methodological approaches, including single-cell recordings (Luck et al., Reference Luck, Chelazzi, Hillyard and Desimone1997), PET/fMRI (Corbetta & Shulman, Reference Corbetta and Shulman2002; Shibata et al., 2007) and electroencephalographic (EEG)/ERP studies (Fu et al., Reference Fu, Foxe, Murray, Higgins, Javitt and Schroeder2001). Thus, top-down biases increase activity in the same neural circuits that are subsequently used by selective attention to process relevant stimuli. We will dub this as Recursive Attentional Activation (RAA).
A possible manifestation of RAA has been found when exploring EEG alpha-band suppression (which is considered as an index of increased attentional resource allocation) during the pre-stimuli periods in different selective attention paradigms (Flevaris et al., Reference Flevaris, Bentin and Robertson2011). In particular, a study by Flevaris et al. (Reference Flevaris, Bentin and Robertson2011) revealed EEG alpha-band suppression when participants were anticipating the presentation of a Navon figure, with a larger effect over the right hemisphere when the global level was to be attended and an inverse (but weaker) lateralization when the local level was cued. This effect was conditioned by the spatial frequency content of a previously presented grating. Despite these results, the appearance of RAA when attending hierarchically organized figures has been insufficiently studied.
If we accept the very conservative assumption that different scalp distributions reflect distinct underlying neural systems, then ERP recordings offer a window into the neural dynamics of hemispheric lateralization. A succession of different voltage scalp (or MEG field) topographies would reflect of a series of distinct neural configurations, as well as their possible recurrence, and their temporal durations. The recurrence of scalp topographies over time would suggest (but not demonstrate) that similar neural configurations are invoked repeatedly. Specifically, the presence of RAA could be examined. Note that this would go beyond examining the mere presence of lateralization. Traditionally, changes in ERP/ERF scalp topographies have been studied by visual observation or statistical tests usually with a limited number of comparisons. Eventually one would need to compare the neural configuration at each time point with all the others (which depending on the number of time points in the ERP or ERF could typically range from about 1002 up to 3002 comparisons). This large number of comparisons is difficult to handle with the traditional approaches.
The development of multivariate pattern analysis (MVPA) techniques, applied initially to fMRI (Kriegeskorte & Bandettini, Reference Kriegeskorte and Bandettini2007), has opened new alternatives for the comparison of large number of scalp distributions. Recently, King, and Dehaene (Reference King and Dehaene2014) have proposed the temporal generalization methodology, in which the application of pattern classifiers to EEG or MEG data enables the characterization of how neural representations are initiated and transformed through time. The method aims at detecting idiosyncratic, clearly distinguishable, topographical distributions for each experimental condition that are stable across replications. To obtain this time-course information, a collection of classifiers are set up, using data from each time point (a collection of response amplitudes across scalp derivations) as training data. Each classifier is then applied to try to identify the stimuli evoking the ERPs at all other time points.
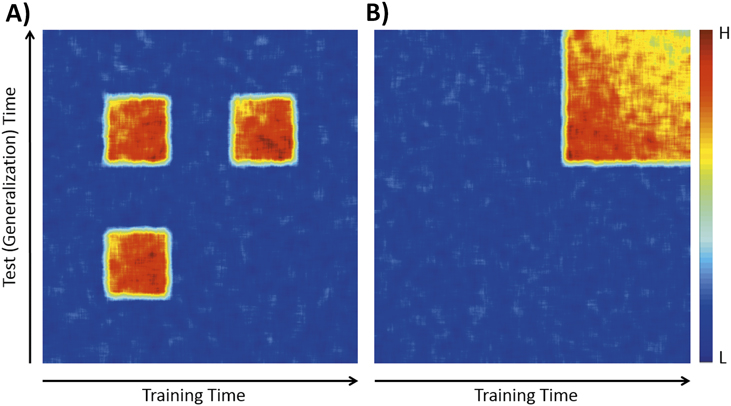
This procedure generates a “generalization matrix”. In other words, it identifies recurrent patterns of scalp topography across different temporal regions of the evoked response. To spell this out, if we can predict for one time point which stimulus was presented with a classifier trained at another time point, we can conclude that distinctive but recurrent scalp topographies were generated for the two stimuli. This reactivated or recurrent pattern, when a given substrate re-emerges as active at a later time, leading to a localized off-diagonal generalization, could be an index of RAA. King and Dehaene (Reference King and Dehaene2014) propose using the patterns of reproducibility over time (reflected in the generalization matrix) to identify the temporal structure of neural configurations (see some examples of patterns in Figure 1).
Two examples of temporal structure defined by the generalization matrices when classifying between two scalp topographies from separate conditions/waveforms. A) Re-activated pattern: an early differentiation in scalp topography is reactivated later in the temporal course of the evoked response; B) Inverse ramping pattern: a relatively abrupt differentiation in scalp topography slowly decreases over time. Colorbar: H (highest classification accuracy), L (lowest classification accuracy).

Note that it is possible to manipulate the selection of the training and test datasets in the temporal generalization method in order to explore different temporal structures. If the same distinction is selected for both training and testing the classifier (e.g.: discriminating between attended and unattended global distracters), the resulting generalization matrix will describe the temporal evolution of the scalp topographies of that particular distinction. We will dub this as specific discrimination. On the other hand, if two different distinctions are used for training and testing such classifier (e.g.: training for discrimination between attended and unattended global distracters and testing for distinction between attended and unattended local distracters), the subsequent generalization matrix will exclude the idiosyncratic features of each of these particular distinctions and only the common features will arise. We will dub this as abstract discrimination. These common features could include the attentional selection mechanisms, independent of the stimulus format that could support RAA processes.
Here we combine the level specific letter presentation approach with the temporal generalization methodology for characterizing the RAA when attentionally selecting global and local information in compound figures. Since the presentation of stimuli corresponding to each hierarchical level is dissociated in time, the elicited ERPs (and their attentional modulation) can also be segregated. This allows to explore the temporal evolution of such attentional selection separately for each of these levels. Note that this is not possible when using the traditional Navon paradigm since both levels are always presented together in a single compound figure, thus evoking a mixed ERP response in which segregation is not possible.
In the present article, we first confirmed and extended the findings of Iglesias et al. (Reference Iglesias-Fuster, Santos-Rodríguez, Trujillo-Barreto and Valdés-Sosa2015) related to scalp topography in a larger sample of participants (in order to surmount possible limitations in the power of that study). Additionally, we characterized the detailed temporal evolution of the scalp distribution for the SN associated with global and local letter recognition. This was done by using the temporal generalization method described above (King & Dehaene, Reference King and Dehaene2014), modified for the study of inter-subject generalization patterns. Given that changes in scalp topography reflect underlying changes in neural source configuration, this approach could shed light on the discussions about the timing of processing stages in the perception of compound figures, and specially illuminate if these configurations are repeated over time, and thus specifically test if an RAA was present.
Method
Participants
Twenty four (14 females) healthy volunteers participated in our study. All had ages ranging from 23 to 32 years (M = 28.4). All of them were right-handed by self-report, had normal or corrected-to-normal vision, and none of them had a history of neuropsychiatric disorders, or were taking psychotropic drugs. All gave written informed consent prior to the experiment. The protocol was approved by the Ethics Committee of the Cuban Center for Neuroscience and was carried out according to the principles laid down in the Helsinki declaration.
Stimuli
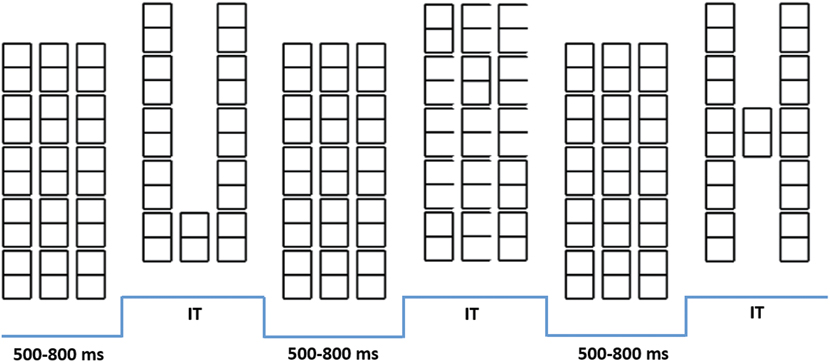
An array of ’8’ characters, with 3 columns and 5 rows, which served as mask and as baseline for constructing all stimuli was presented to all participants (Figure 2). This matrix was displayed in the center of a CRT screen, placed 40 cm in front of the participants. Light grey characters on a black background were used. Eliminating a subset of ’8’ characters of the baseline generated global stimuli, whereas removing a subset of line segments that form the ’8’ characters unveiled local letters (Figure 1). For these local letters, only ten (randomly selected) of the fifteen ’8’ characters of the initial array were changed in each trial. This was aimed at discouraging participants from focusing attention on a few positions across trials. The experimental procedure, behavioral measures, EEG recording settings and estimation of ERPs were identical to those described in Iglesias-Fuster et al. (Reference Iglesias-Fuster, Santos-Rodríguez, Trujillo-Barreto and Valdés-Sosa2015).
Part of a stimulation sequence. Here the elements included are: the baseline mask, a global “U”, mask, a local “E”, mask and finally a global “H”. IT, individually titrated stimulus durations.

Procedure
Stimulation
The stimulation procedure was divided in four blocks. In each block, 480 letters were presented, each separated from its temporal neighbors by baseline intervals ranging from 600 to 800 ms. Each block included 180 global distracters, 180 local distracters, 60 global targets and 60 local targets, displayed in a randomized order. In two of the four blocks, subjects were instructed to attend only to the global stimuli (Attend-Global blocks), and in the other two they were instructed to attend only to the local targets (Attend-Local blocks). In 12 participants, the order of presentation was global → local → global → local. In the other 12 participants the order was reversed. Subjects were instructed to report targets at the designated level by pressing one of two keys on a computer keyboard, while ignoring both target and distracter letters in the non-attended level.
Electrophysiological recordings
Electrophysiological recordings were performed with a MEDICID 64 system (Havana, NEURONIC SA.). Electrodes were placed in 58 active derivations referenced to the nose. In addition, four electrodes were used for recording the electro-oculogram: two lateral to the external border of each eye for horizontal movements, and two placed 1 cm above and below the left eye for vertical movements. The signal was amplified by a factor of 1000, and band-pass filters filtered between 0.05 and 70 Hz (–3dB down). A/D conversion was performed at 200 Hz. Data segments of 800 ms were defined for analysis, starting 100 ms before each stimulus. Each segment was visually inspected and those presenting artifacts or excessive activity in EOG were rejected. The within subject averages for each distracter condition included on the average about 180 repetitions, and those corresponding to the target about 45.
Deconvolution method
The ERP epochs for each stimulus had a large degree of overlap from responses to previous trials due to the fast-paced design employed here. This contamination is accompanied by unstable pre-stimulus baselines. We therefore estimated the average ERPs of each condition in all individuals with a novel methodology dubbed ’form-free un-mixing for ERPs’ (FUN for ERPs). The logic underlying FUN, inspired by methods developed for fMRI analysis is described below.
In fMRI deconvolution is accomplished by applying the general linear model (GLM). A design matrix is built in which each column corresponds to the convolution of a series of finite impulse response (FIR) functions with a times series that containing the onsets of one stimulus type. The GLM model assumes that
 $$Y = X\beta + \in$$
where Y is the (1 x nt) vector of fMRI raw data (nt= number of time points), X is the (nt x nest) design matrix (nest=number of different stimuli), β is the amplitude or weight vector (nest x 1) corresponding to each stimulus, and ∈ is a column vector of Gaussian white noise terms. An estimate of the amplitudes is obtained as follows:
 $$\hat{\beta } = {\left( {{X^T}X} \right)^{ - 1}}{X^T}Y$$
This approach deals effectively with the response overlap even in fast event-related fMRI designs where the inter-stimulus intervals are smaller than the duration of the hemodynamic response.
FUN consists of an adaptation of this approach. Its creates a generative model of the observed data in which the total ERP response at a given time point is expressed as a superposition of FIR filters each representing a condition-specific response. FUN for ERPs implements a Variational Bayes (VB) inversion of this generative model under a Mean Field Approximation (MFA) that exploits the standard independency assumption between different condition-specific ERPs. Particularly, the MFA used assumes that the posterior distribution of the FIR coefficients factorizes over experimental conditions. That is, the FIR coefficients corresponding to different condition-specific ERPs are assumed to be independent given the observed data. Under this MFA, the FUN for ERPs method produces posterior estimates of the FIR coefficients based on which the ERP corresponding to each experimental condition can be reconstructed. Additionally, the generative model underlying FUN for ERPs is expressed in the form of a General Linear Model (GLM) which allows for including additional regressors accounting for different types of trends and artifacts. The method also allows for accommodating available prior information (temporal smoothness for example) about the ERPs.
The mean of the pre-stimulus amplitudes was subtracted from each individual average waveform. After the average ERPs were estimated for all subjects, grand averages for the group were calculated for each condition. Difference waveforms were calculated by subtracting the waveforms generated by attended and unattended distracters for each hierarchical level, yielding selection negativity (SN), and by subtracting those elicited by attended targets and distracters, obtaining a discrimination negativity (DN).
Statistical analysis
Given the non-Gaussian distribution and small sample sizes of the ERP data nonparametric permutation tests were used for the statistical tests. Galán, Biscay, Rodríguez, Pérez-Abalo, and Rodriguez (Reference Galán, Biscay, Rodríguez, Pérez-Abalo and Rodriguez1997) and Maris and Oostenveld (Reference Maris and Oostenveld2007) can supply specific details of these tests, that can be summarized as follows. Permutation tests were used in three situations: 1) comparisons between ERP time-series waveforms; 2) comparisons between summary measures extracted from these waveforms; and 3) comparisons between scalp distributions at selected time points.
Comparisons between ERP time-series waveforms from different experimental conditions. A paired t-test at each time point for all channels was used for comparing the participants` waveforms for two conditions, first with the original condition labels and then after 1000 random permutations of the group membership labels. The proportion of t-tests for the permuted data that were greater than or equal to the original t-test results in the significance (p) of the test under the null hypothesis (i.e. labels are exchangeable because conditions do not differ). All contiguous time points with p values < .05 were grouped into clusters, and the cluster-mass index was defined as the sum of the corresponding t values. An empirical null distribution was build using the maximum cluster-mass index across all derivations. This procedure controls the overall Type I error due to multiple comparisons (Maris & Oostenveld, Reference Maris and Oostenveld2007). The significance of the cluster-mass values from the original (un-permuted) data was then estimated from this empirical distribution. This procedure was applied to compare ERPs for attended/unattended distracters, for targets/distracters, as well as for homologous pairs of left/right electrodes for each condition.
Comparisons between measures extracted from the ERP waveforms. The time point at which each component reached 50% of its total area was selected for characterizing the latencies of both SN and DN for each hierarchical level (as proposed by Luck (Reference Luck1998, Reference Luck and Handy2005)), in the average of all the posterior electrodes. The voltage values at this time point was then estimates of the amplitudes of the SN and DN components. The average of the voltage values corresponding to the above-mentioned latency for every difference waveform was calculated for a group of occipito-temporal electrodes separately for the left (T7, C5, C3, TP7, CP5, CP3, P7, P5, P3, P1, PO5 & PO3) and the right side (T8, C6, C4, TP8, CP6, CP4, P8, P6, P4, P2, PO6 & PO4) of the scalp, as inputs for a lateralization test. All pair-wise comparisons across the four difference waveforms were tested by using the same permutation test described without cluster-based correction.
Comparisons between scalp distributions at selected time points. The D statistic (Galan et al., Reference Galán, Biscay, Rodríguez, Pérez-Abalo and Rodriguez1997) was used for testing the differences in the scalp distributions of the SN and DN between the attend-local and attend-global waveforms. This test is based on the order of the electrodes when ranked by amplitude (this eliminates de amplitude/distribution confound). The D statistic is the sum of the Euclidean distances between the positions of the pairs of electrodes that have the same rank across the two conditions. The significance of D is obtained by comparing its value for the original observations with an empirical distribution of obtained after 1000 random permutations of the group membership labels (under the null hypothesis that the groups are equivalent). This permutation test is distribution free, making no assumptions about the underlying correlation structure, and it provides exact p-values for any number of subjects, time points and recording sites.
The temporal generalization methodology
The temporal generalization method described by King & Dehaene (Reference King and Dehaene2014) was used to evaluate if the topographic information (i.e. scalp distribution) distinguishing two experimental conditions at one time point can be used to classify between these same conditions in the rest of the time domain. The procedure consists of training a classification algorithm at one time point of the ERP domain and testing with the data from all the other time points. All ERP data was previously normalized to eliminate spurious effects generated by overall intensity differences. The resultant vector of ERP amplitudes across electrodes for each subject served as input for a support vector machine (SVM) classifier, as implemented in the Matlab Statistics Toolbox (Mathworks Inc.). Classifier’s training involved a sequential minimal optimization method, using a linear kernel function and a regularization parameter (C) set to 1. This adapted temporal generalization methodology was applied for discriminating between the following waveforms: (1) general attentional modulation (global attended – global unattended distracters [global SN] vs. local attended – local unattended distracters [local SN]), (2) specific global attentional discrimination (global attended vs. global unattended distracters), 3) specific local attentional discrimination (local attended vs. local unattended distracters), and (4) abstract attentional discrimination. This last assessment was estimated by averaging the results from two separate training-test sequences: (a) global attended vs. global unattended distracters as training set and local attended vs. local unattended distracters as test set; and (b) local attended vs. local unattended distracters as training set and global attended vs. global unattended distracters as test set. This produced four cross-classification matrices in the ERP time domain.
A leave-one-subject-out (LOSO) scheme was used. The algorithm was trained in n–1 participants using data from a single point of the ERP waveform, and tested in all time-points corresponding for the excluded participant to measure the classification accuracy. This procedure was iterated sequentially across all points of the time-series data and all the participants. The output produced a generalization matrix, which described the mean accuracy across cross-validations of the LOSO procedure for each training time across all time points (“generalization time”). The statistical significance for the accuracy values of each generalization matrix was assessed by using a permutation-based approach. The randomization scheme consists of flipping the condition labels for each subject with probability 1/2 and then estimating the generalization matrix under the null hypothesis that both conditions are identical. A cycle of 1000 permutations was used to construct the empirical null distribution of accuracy values, and the 95th percentile was used as a significance threshold.
Results
Behavioral data
The mean accuracy for global stimuli was about 85.13 %, whereas for local stimuli was about 81.2 %. Accuracy in the detection of global targets was significantly better than for local targets (t(23) = 2.57, p < .02).
Global ERPs
For both global and local stimuli, the ERPs were similar to those reported by Iglesias-Fuster et al. (Reference Iglesias-Fuster, Santos-Rodríguez, Trujillo-Barreto and Valdés-Sosa2015) in a smaller sample. Those associated with global distracters were characterized by several large peaks over the occipito-temporal regions of the scalp. Two large negative peaks were elicited in posterior areas for both attentional conditions, with 50% area latencies of about 185 and 290 ms after stimuli onset respectively (N1 and N2). A longer-latency (525 ms) positive peak, larger over posterior regions, was also observed.
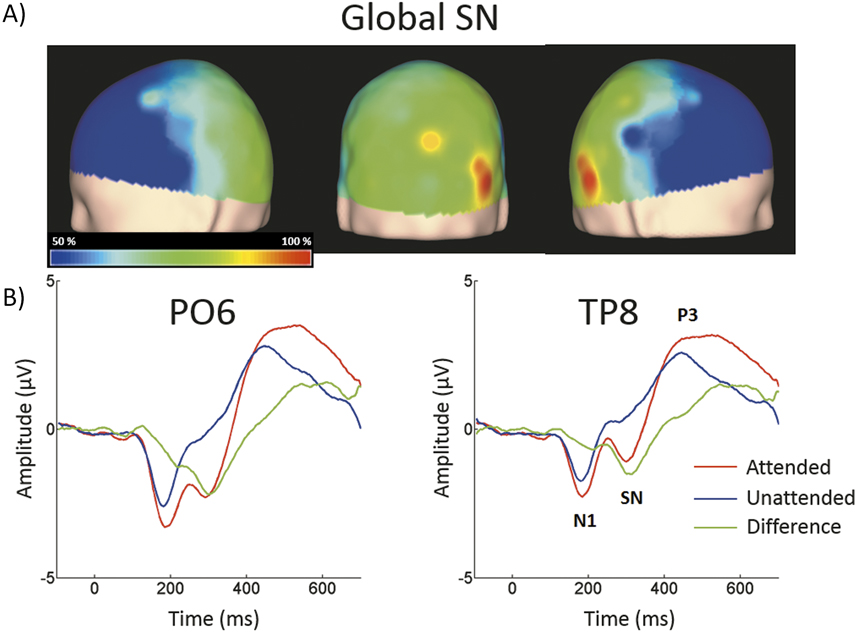
The difference between attended and ignored distracters, evincing a selection negativity (SN), was significant in 36 out of 58 active derivations, and was concentrated in posterior occipital, temporal and parietal derivations. In all these electrodes, the p-values of the cluster-mass corrected permutation tests were consistently below .001. The largest effects were found in derivations PO6 and TP8, on the right side of the scalp (Figure 3), and were significant for latencies ranging from approximately 290 to 365 ms.
Scalp topographies of the global SN and typical examples of the grand average ERPs to distracters. (A) Scalp distribution generated after subtracting ERPs elicited by unattended global distracters from those elicited by attended global distracters. The amplitudes measured at all electrodes were correspondingly interpolated. Percentages of the maximum value at the 50% area latency are shown. (B) ERPs from derivations PO6 and TP8 (were largest significant t -test values were estimated), showing responses to attended global stimuli (red solid line), unattended (blue solid line) and the difference waveform (green solid line).

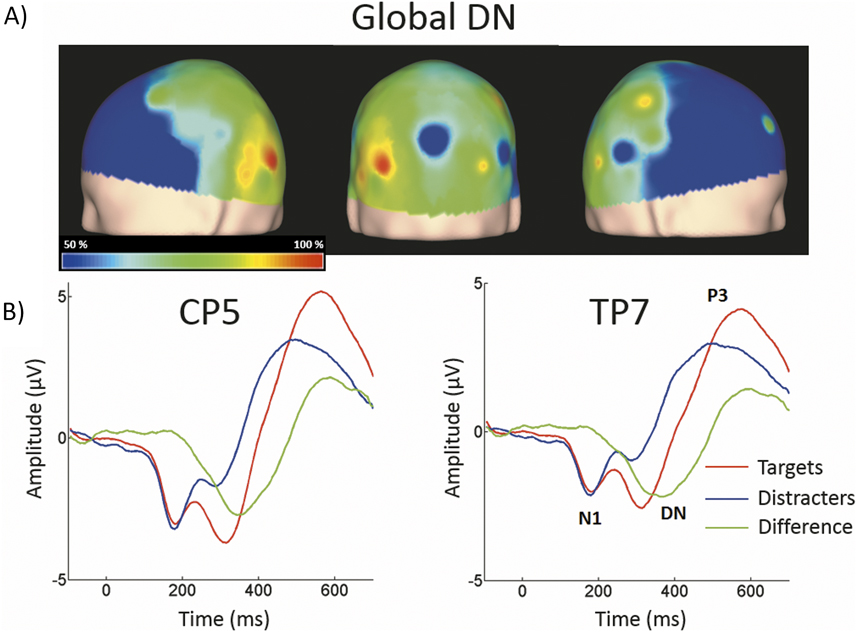
As shown in Figure 4, attended global targets produced a large N2c/P3b complex that was smaller in the responses to distracters. The P3b was largest at central and posterior derivations. For global stimuli this component spanned from 465 to 670 ms. The difference between attended targets from attended distracters was significant in 21 out of 58 active derivations, and was concentrated mainly in left temporal and parietal derivations. The largest effects were found in derivations TP7 and CP5, on the left side of the scalp. In these electrodes, the discrimination negativity (DN) was significant for latencies ranging from about 285 to 400 ms.
Scalp topographies of the global DN and typical examples of the grand average ERPs to distracters and targets. (A) Scalp distribution generated after subtracting ERPs elicited by attended global distracters from those elicited by attended global targets. The amplitudes measured at all electrodes were correspondingly interpolated. Percentages of the maximum value at the 50% area latency are shown. (B) ERPs from derivations CP5 and TP7 (were largest significant t -test values were estimated), showing responses to attended global targets (red solid line), distracters (blue solid line) and the difference waveform (green solid line).

Local ERPs
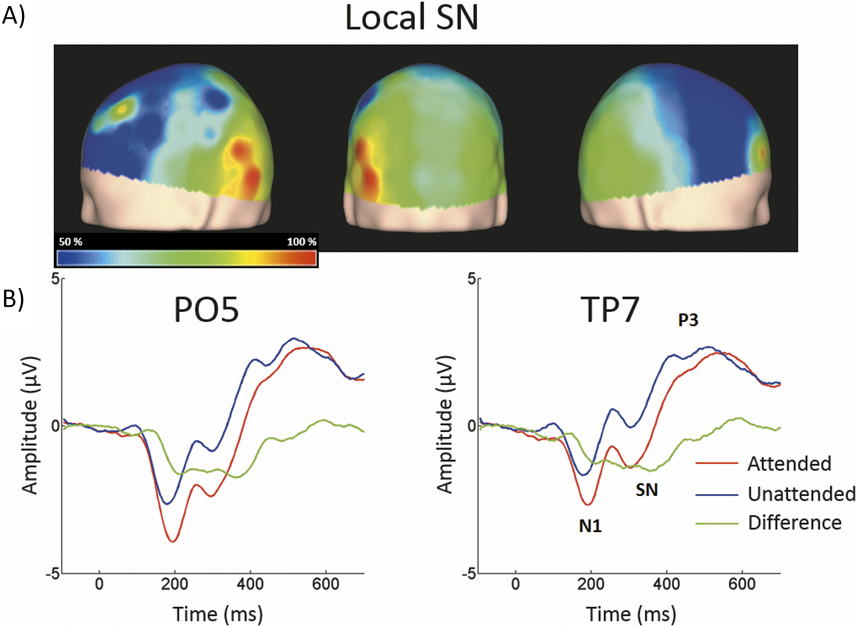
The ERPs elicited by local distracters were very similar to those corresponding to global stimuli (Figure 5). N1 and N2 50% area latencies were about 185 and 280 ms respectively. A late positive component peaking at about 505 ms was also observed. Regarding the local SN, the difference between ERPs elicited by attended and unattended distracters was significant in the permutation tests for 21 out of 58 active derivations, concentrated in posterior occipital and temporal derivations. In all these electrodes, the smallest p-values were all below .001 (cluster-mass corrected). The largest effects were found in derivations PO5 and TP7, on the left side of the scalp. In these electrodes the significant difference between attended and un-attended waveforms started and ended at about 305 and 375 ms in that order.
Scalp topographies of the local SN and typical examples of the grand average ERPs to distracters. (A) Scalp distribution of the SN obtained by subtracting ERPs to unattended global distracters from ERPs to attended global distracters. Conventions here as in Figure 3A. (B) ERPs from derivations PO5 and TP7. Conventions here as in Figure 3B.

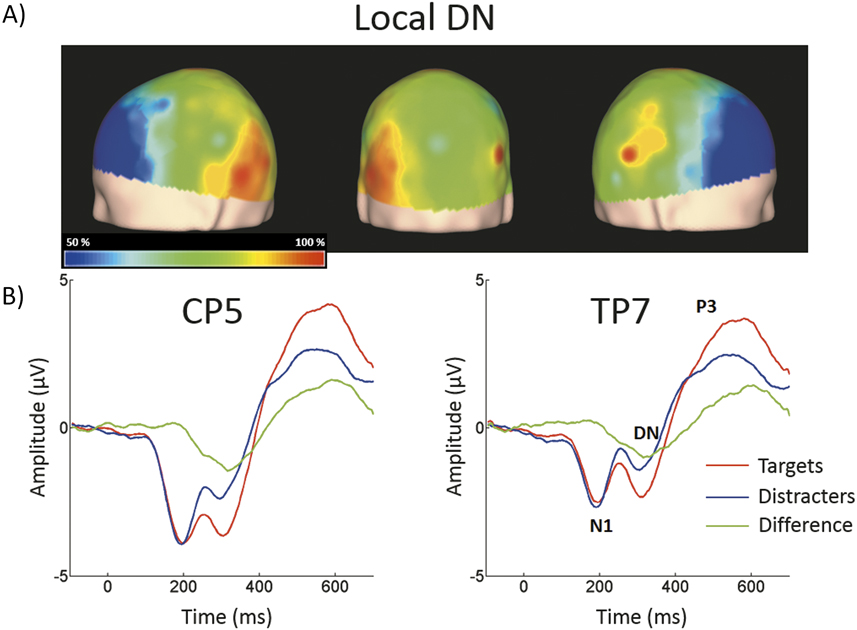
Attended local targets also produced a large N2c/P3b complex that was smaller in the responses to distracters. The P3b scalp distribution was similar to that described for global stimuli, spanning from 485 to 700 ms. The DN waveform was present in 22 out of 58 active derivations, and it was also concentrated mainly in left temporal and parietal derivations (Figure 6). The largest effects were also found in derivations TP7 and CP5, on the left side of the scalp. In these electrodes the difference between waveforms elicited by attended targets and distracters was significant for latencies ranging from about 295 to 365 ms.
Scalp topographies of the local DN and typical examples of the grand average ERPs to distracters and targets. (A) Scalp distribution of the DN generated after subtracting ERPs elicited by attended local distracters from those elicited by attended local targets Conventions here as in Figure 4A. (B) ERPs from derivations CP5 and TP7. Conventions here as in Figure 4B.

Comparisons between global and local SNs and DNs.
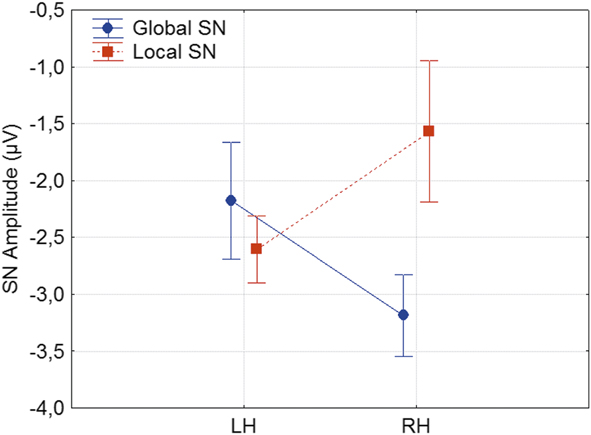
The amplitude of the local SN was significantly larger than the corresponding global SN in an early time window enclosed between 170 and 230 ms after stimulus presentation. Conversely, the amplitude of the global SN was in turn larger than the corresponding to the local SN within a later time window, defined between 260 and 325 ms. However, no significant differences were found between the 50% area latencies of the SN in global and local distracters (p > .790). The global SN waveform was about 45 ms earlier than the global DN (η2 = .302, p < .001). Similarly, the local SN was about 30 ms earlier than the local DN (η2 = .282, p < .001). Comparison of the scalp topographies of the SN of global and of local stimuli, showed significant differences (D statistics, p < .005). The permutation test using the average amplitude across posterior occipito-temporal electrodes, showed that the global SN was significantly lateralized to the right hemisphere (η2 = .111, p < .01). On the contrary, the local SN was significantly lateralized to the left hemisphere (η2 = .042, p < .04). In this SN waveform, the interaction between Hierarchical Level and Hemisphere was significant (F(1, 23) = 5.65, p < .03, η2 = .342, see Figure 7). In contrast to the SN, both the global and local DNs were significantly lateralized to the left hemisphere (η2 = .25, p < .03 and η2 = .142, p < .05 respectively), and their scalp topographies did not differ (D statistics, p > .1). In this DN waveform, the interaction between Hierarchical Level and Hemisphere was not significant F(1, 23) = .81, p > .3. On the other hand significant differences in scalp distribution were found between the SN and DN waveforms for global (D statistics, p < .01), but not for local stimuli (D statistics, p > .2).
Amplitude of the SN waveform as a function of Hierarchical Level and Hemisphere. LH: left hemisphere; RH: right hemisphere.

Temporal generalization analysis.
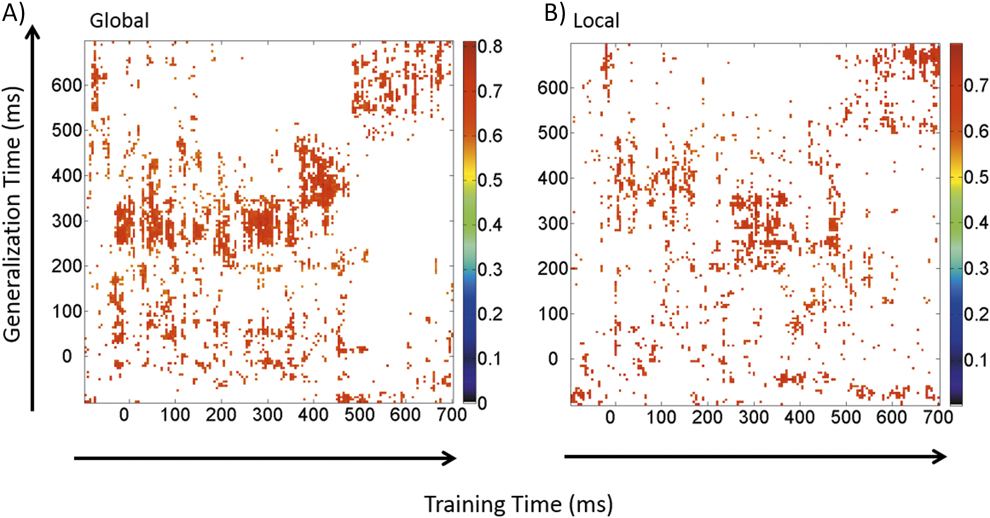
We will define “informative time regions” as those points in the matrix, defined by a specific combination of latencies from the training and test data, in which the accuracy for classification (based on differences in scalp topography between stimulus classes) is significantly above chance in the permutation test. Figure 8A shows the generalization matrix describing the temporal evolution for discrimination between attended and ignored global stimuli. In this and the subsequent matrices, columns represent the times at which the SVM classifiers were trained (training time) and rows depict those times at which the classifier was tested (generalization time). A first time region, which was informative about attended vs. unattended stimuli, was found between about 0 ms up to about 100 ms after stimulus presentation, in response to the stimulus onset. A second informative time region was obtained between about 260 and 450 ms after stimulus onset. A third informative time region was also obtained, enclosed between the same 0–100 ms time interval for the train data but tested between about 250 and 350 ms, roughly corresponding to the time course of the global SN, therefore suggesting a reactivated pattern of visual processing. Finally, a fourth informative time region was found, enclosed between about 500 and 700 ms, with a slow decreasing activity across time.
Generalization matrices describing the temporal evolution for discrimination between attended and ignored distracters. A) Global stimuli. B) Local stimuli.

Figure 8B shows the generalization matrix describing the temporal evolution for the discrimination between attended and ignored local stimuli. A first informative region was found for the attended vs. unattended discrimination, defined in the pre-stimulus interval (–100–0 ms). Between 0 ms and expanding up to around 100 ms after stimulus presentation, the classifier trained in that very same window generated a second informative time region, probably in response to the stimulus onset. A third informative region was obtained when the classifier was trained and tested between about 200 and 400 ms. A fourth informative time region was obtained when the classifier was trained in the 0–100 ms time-window, but tested between about 300 and 430 ms, roughly including most of the previously described local SN. A fifth informative time region was detected when the classifier was trained in a 350–450 ms time-window and subsequently tested between about 0 and 100 ms. This last three informative pairs also suggest a reactivated pattern of visual processing. Finally, similar to global stimuli, the classifier trained between 500 and 700 ms exhibited a slow decreasing activity across time, with significantly above-chance performance.
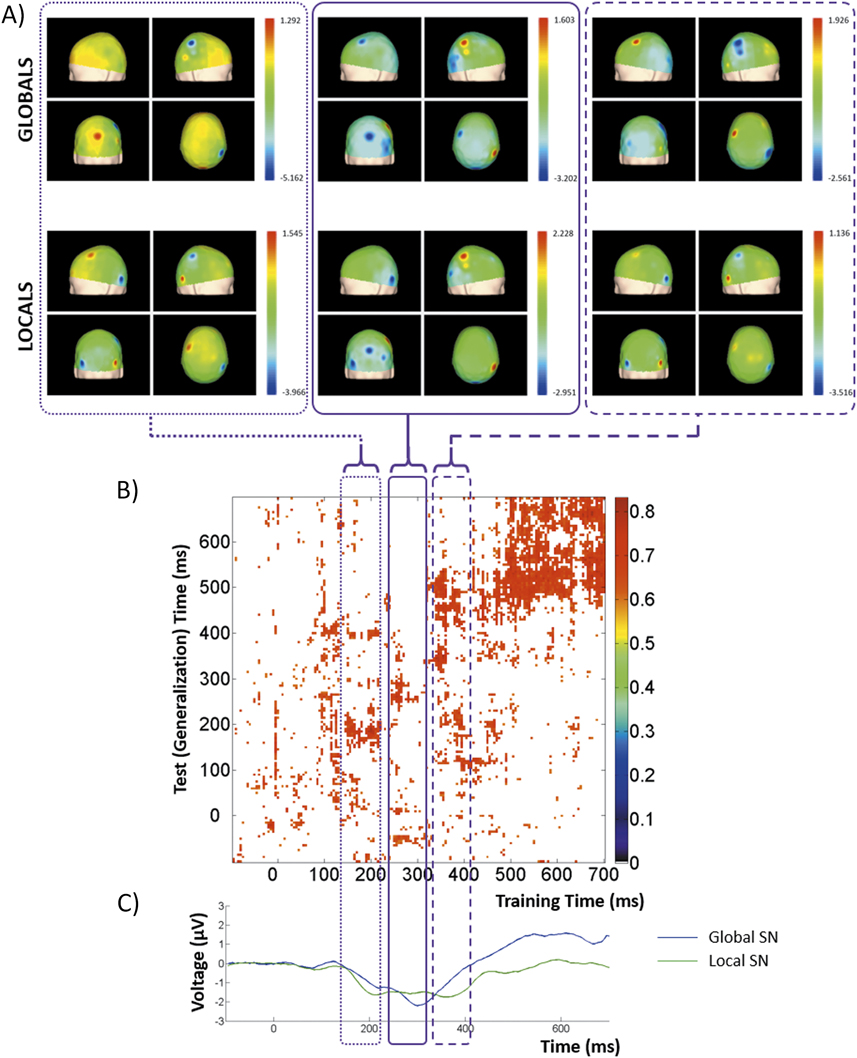
Figure 9B shows the generalization matrix describing the temporal evolution for discrimination between SN waveforms estimated for each hierarchical level. A first informative time region was defined between about 150 ms and 230 ms after stimulus presentation, probably in response to the stimulus onset. A second informative time region was obtained when the classifier was trained and tested between 250 and 320 ms. A third informative time region was obtained when trained between 330 and 410 ms, but tested between about 330 and 540 ms, roughly including most of the previously described global and local SNs and posterior activity. Finally, in a fourth informative time region, the classifier trained and tested between 500 and 700 ms exhibited a slow decreasing activity across time, with significantly above-chance performance.
A) Generalization matrices and scalp topographies at selected latencies describing the temporal evolution for discrimination between SN waveforms estimated for each hierarchical level. A) Scalp topographies at selected latencies (conventions as in figure 3A); B) Generalization matrix; C) Global and Local SNs.

Figure 9A shows the average topographies in the first three informative time regions, estimated for global and local SNs, which are also depicted in figure 9C. In the first informative time window, the scalp distributions of both SNs were mainly concentrated in right parietal electrodes, with weaker representations in posterior occipito-temporal derivations. The scalp distributions corresponding to the second informative time window involved posterior occipital derivations, most with opposite lateralization patterns when comparing global and local stimuli. Finally, the topographies resuming the third informative time region that were similar to those described for the first informative time region. Here, both the global and the local SNs were best represented in right parietal derivations.
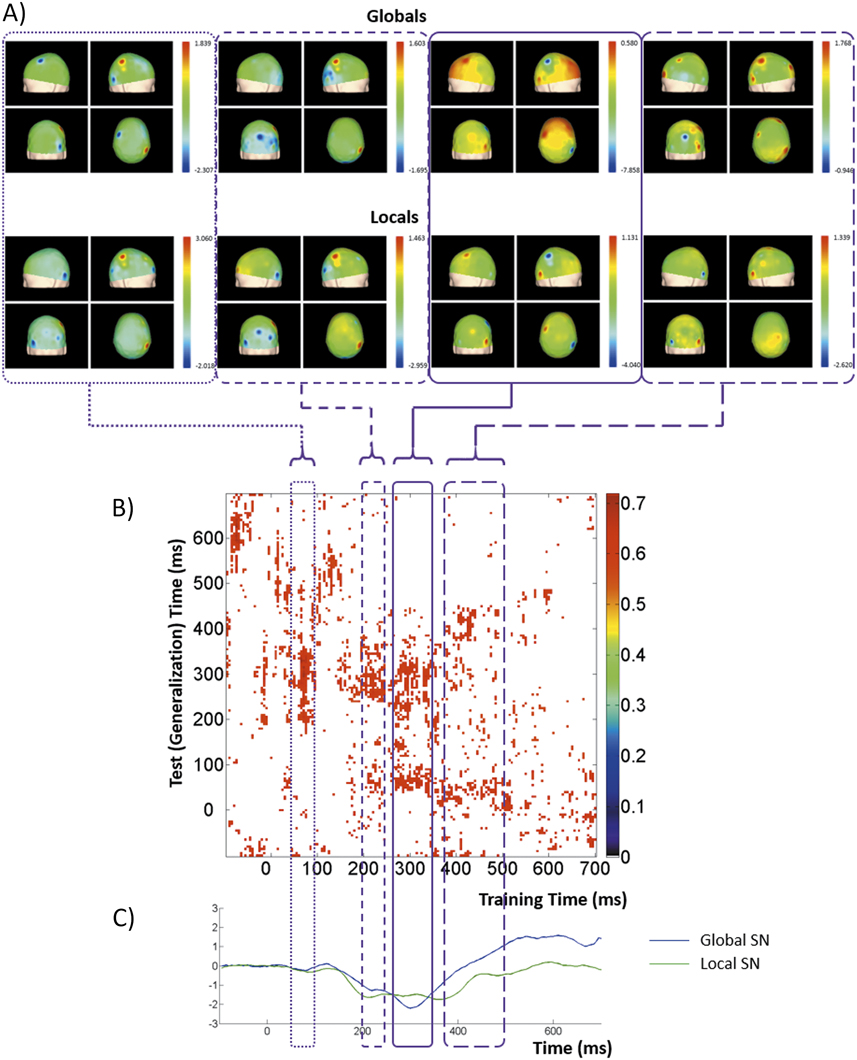
Figure 10B shows the generalization matrix describing the temporal evolution for abstract discrimination. In other words, this particular matrix was obtained by averaging the results from two separate training-test sequences: (a) global attended vs. global unattended distracters as training set and local attended vs. local unattended distracters as test set, and (b) local attended vs. local unattended distracters as training set and global attended vs. global unattended distracters as test set. Thus, it should measure the commonalities in topography for this discrimination. A first informative time region was observed when the classifier was trained between about 50 ms and 100 ms after stimulus presentation, but tested between 200 and 350 ms. A second informative time region was obtained when the classifier was trained between 200 and 250 ms, but tested between 250 and 350 ms. A third informative time region was obtained when trained between 280 and 350 ms, but tested between about 220 and 330 ms, roughly including most of the previously described global and local SNs and posterior activity. A fourth informative time region was obtained when trained between 280 and 350 ms, but tested between about 50 and 100 ms, Finally, a fifth informative time region was defined when the classifier was trained between 370 and 500 ms, but tested between 350 and 450 ms.
Generalization matrices and scalp topographies at selected latencies describing the temporal evolution for abstract discrimination. A) Scalp topographies at selected latencies (conventions as in figure 3A); B) Generalization matrix; C) Global and Local SNs.

Figure 10A shows the average topographies for all informative time regions (but averaging the regions 3 and 4), estimated for global and local SNs, which are also depicted in figure 10C. During first informative region, the both scalp distributions shared a positive activity concentrated in right parietal derivations, with clear negative activity (with opposite lateralization patterns) in posterior temporal electrodes. The scalp distribution of such negative activity becomes wider during the second informative time region, matching the initial stage of both the global and the local SNs. The SN during the third and fourth informative time regions is best represented across right parietal derivations. Finally, the fifth informative time region exhibit a posterior occipito-temporal distribution.
Discussion
An occipito-temporal SN, elicited by our modification of the Navon paradigm, was generated when attention was directed to the global and to the local stimuli. Note that our novel technique allows segregation of ERPs elicited at the two levels, which is not possible with traditional Navon figures. Moreover, by increasing the statistical power of our analysis, we extended the results from Iglesias-Fuster et al. (Reference Iglesias-Fuster, Santos-Rodríguez, Trujillo-Barreto and Valdés-Sosa2015), and clearly demonstrated opposite lateralization patterns for these SNs. There SNs were larger over the right hemisphere when elicited by global, and over the left hemisphere when generated by local, stimuli.
It is difficult to compare our work with previous ERP studies using traditional Navon stimuli in which responses to the local and the global levels are necessarily confounded due to the linkage between presentations of both levels. Perhaps a more meaningful comparison is possible with studies using high- and low-spatial frequency (HSF and LSF, respectively) gratings, which are used as proxies for the local and global level respectively. Martínez et al. (Reference Martınez, Di Russo, Anllo-Vento and Hillyard2001) examined the ERPs when selectively attending either HSF or LSF checkerboards. They found a clear lateralization to right hemisphere of the N2 component when attending LSF stimuli, but a more bilateral distribution for HSF stimuli. Similar results were obtained by Flevaris, Martínez, and Hillyard (Reference Flevaris, Martínez and Hillyard2014) but using an ingenious combination of HSF and LSF gratings and compound letters. However, although the use of HSF and LSF gratings allows successful dissociation of responses that are putatively linked to the local and global levels, it does not directly measure responses to compound letters.
In contrast to Martínez et al. (Reference Martınez, Di Russo, Anllo-Vento and Hillyard2001), the reverse lateralization patterns of the SNs for global or local stimuli described here (supported by the interaction analysis) clearly supports an opposing hemispheric specialization for these two hierarchical levels. Our positive results were probably due to a larger sample size and the clear separation of the ERPs associated to the two levels. This finding is congruent with evidence derived from psychophysics and neuropsychological studies, pointing to a greater involvement of the left/right cerebral hemispheres for processing (or perhaps just integrating) local/global stimuli, respectively (Heinze & Münte, Reference Heinze and Münte1993; Volberg & Hübner, Reference Volberg and Hübner2004; Flevaris et al., Reference Flevaris, Bentin and Robertson2011).
The temporal generalization methodology (adapted here for inter-subject analysis) identified informative time windows in the latency interval of both global and local SNs. In addition, very early informative time windows were also estimated, probably corresponding to preparatory activity and initial sensory registration periods, with latencies between 0 and 100 ms. Importantly, recurrent (reactivated) patterns were detected for both global and local stimuli. In other words, in the two levels the scalp topographies emerged during the early preparatory stages were apparently reactivated during the attentional selection processes enclosed in the SN, as an index of RAA.
In the generalization analysis exploring global and local specific discrimination effects, the informative time regions identified in the SN time window (for both global and local stimuli), suggests an extended process of attentional selection in these latencies, which in turn imposes changes in the underlying topographical representations. This supports the interpretation of this SN as an index of sustained attentional selection of global and local information in these compound figures. Moreover, the informative time region linking the SN latency interval and a very early temporal segment of the response (possibly related to preparatory activity) indicates the possibility of a reactivated pattern of visual processing (RAA). This effect seems to be stronger for the local compared to the global SN.
Note that the first informative time region, defined between about 0 and 100 ms is extremely early in visual processing. The latencies of the C1 component, as the earliest ERP waveform described in the visual pathway, has been reported between 50 and 90 ms, with estimated generators in the primary visual cortex (Hillyard & Anllo-Vento, Reference Hillyard and Anllo-Vento1998). This suggests that the aforementioned early informative time region would include not only the contribution of processes described by the C1 component, but also mainly preparatory activity.
Our results are congruent with a previously mentioned study using EEG by Flevaris et al. (Reference Flevaris, Bentin and Robertson2011) that showed that attention to LSF or HSF gratings modulated the neural activity generated by subsequently presented Navon figures. This preparatory activity (measured as alpha-band suppression) was significantly observed during the pre-Navon stimulus period, but not during the pre-grating stimulus period (Flevaris et al., Reference Flevaris, Bentin and Robertson2011). Previous studies have also shown the existence of such preparatory activity on the cellular level in paradigms involving spatial and non-spatial attentional selection. In these studies, focusing attention on a given feature or spatial location have increased the spontaneous firing rates of neurons, in addition to the modulation introduced on the responses evoked by stimulus presentation (Luck et al., Reference Luck, Chelazzi, Hillyard and Desimone1997).
In addition to commonalities, important differences were evident when comparing the generalization analyses corresponding to the discrimination between global and local SNs (Figure 9) and to the global/local abstract discrimination (Figure 10). When discriminating between global and local SNs significant effects are more evident at early stages in visual processing (down to 130 ∼ 150 ms). This supports the notion that discrimination between attentionally selecting global or local stimuli is also supported by activity from very early stages of visual processing. Interestingly, in the generalization analysis corresponding to abstract discrimination, an even earlier informative time region was obtained. These estimations could imply at least two different scenarios: (1) our measures from early stages in visual processing detected activity are insensitive to specific information formats but responsive to an abstract brain function (e.g.: selective attention); or (2) these early stages, while maintaining their sensitivity to variable information formats, are controlled by higher level operations, perhaps by feedback connections, who are then insensitive to those format variations.
Interestingly, in all generalization matrices shown here, for both global and local stimuli, there are temporal gaps between informative time regions. In particular, there is a clear discontinuity between the early informative time region described in latencies close to the stimulus presentation and those corresponding to the SN latency interval. There could be two explanations for this. On one hand, it could suggest the appearance of a large common ERP component that “swamps” other activities. This same new component (or even perhaps a larger contribution from noise) could disrupt the discrimination. On the other hand, “activity-silent” mechanisms could be involved. This is particularly important for understanding the dynamics of working memory functions and stimulus processing (Stokes, Reference Stokes2015). This supports that long-lasting explicit activity is not always critical for maintaining the continuity of some brain functions, like working memory and visual attention, but can be subserved by other mechanisms (e.g.: transient patterns of functional connectivity) (Barak & Tsodyks, Reference Barak and Tsodyks2014). This explicit activity can be re-elicited once the task-relevant conditions are fulfilled. These apparent ‘gaps’ in our generalization matrices could index silent stages in brain processing. This hidden brain states could bridge apparently separated processing steps, like those mentioned before in during early and later perceptual processing.
In any case, the distinction between these alternatives and those proposed when discussing global/local abstract discrimination must involve more precise estimations of the neural substrates supporting these responses. Topographical analyses, although effective when concluding between different scalp distributions, are limited when more subtle differences need to be characterized (Murray, Brunet & Michel, Reference Murray, Brunet and Michel2008). Note that more than one brain current source distributions could generate the same scalp topography. Thus, a further study exploring the temporal structure of these responses based on their estimated cerebral generators is mandatory.
Note that there is an ongoing discussion about the preferred methodology for such estimation. On one hand, the use of dipolar solutions poses the problem of obtaining a priori the correct estimates of the number of sources involved (Michel, Murray, Lantz, et al., Reference Michel, Murray, Lantz, Gonzalez, Spinelli and de Peralta2004). This issue has been addressed by several studies, including previous physiological assumptions, functional imaging data or mathematical estimation methods (Michel et al., Reference Michel, Murray, Lantz, Gonzalez, Spinelli and de Peralta2004). However, no consensus has been reached and, on the other hand, methods that do not need this a priori assumption, like distributed source models, have received increased attention. Studies including this type of inverse solutions have estimated generators devoted to global and local processing in several areas of the parietal, temporal and occipital cerebral cortices, but failing to evince differences in their lateralization pattern (Han et al., Reference Han, Fan, Chen and Zhuo1999) or separating the individual contribution of each hierarchical level. It is our believe that a combination of the LSLP approach, a distributed source modeling of the elicited ERPs/ERFs and a generalization matrix analysis of the resulting brain generators would overcome the limitations of the present study and supply conclusive information about the temporal dynamics of attentionally selecting global or local visual stimuli.