I. INTRODUCTION
Improving the tribological performance of contacting surfaces by texturing is a relatively new technique. Surface texturing has proven to reduce friction,Reference Qiu and Khonsari1–Reference He, Zheng, Pu, Zhang and Hu4 wear and seizer.Reference Wang and Kato5 Various applications like piston/cylinder,Reference Quazi, Fazal, Haseeb, Yusof, Masjuki and Arslan2,Reference Tomanik6 mechanical seals,Reference Wang, Huang, Liu, Li and Wang7 and cutting toolsReference Ling, Liu, Xiong, Grzina, Cao, Wang, Xia and Talwar8 have been textured to improve their tribological performance. Mechanisms by which micro/nano textures improve the tribological behavior mentioned in the literature are: increases the load carrying capacity through a hydrodynamic effect, reduces third body abrasion by trapping wear particles, provides lubricant in mixed lubrication regime by acting as a second lubrication source and reduces the rise in temperature at contact by keeping the lubricant at the interface.Reference Ahmed, Masjuki, Varman, Kalam, Habibullah and Al Mahmud9–Reference Arslan, Masjuki, Varman, Kalam, Quazi, Al Mahmud, Gulzar and Habibullah12
In the last few years, effects of surface texturing have been investigated on diamond-like carbon (DLC) coated surfaces in oil-lubricatedReference Pettersson and Jacobson13,Reference Arslan, Masjuki, Varman, Kalam, Mufti, Gulzar, Quazi, Ghazali and Abdollah14 sliding conditions. DLC coatings are increasingly being used to improve the tribological performance of engineering components like bearings, gears, seals, metal cutting, and forming tools, magnetic hard disks and biomedical, due to their hardness and excellent mechanical and tribological properties.Reference Kalin, Velkavrh, Vižintin and Ožbolt15 Because of the higher tribological performance, the use of DLC in automotive components is also increasing. The performance of DLC coating is influenced by temperature, relative humidity etc. As automotive components are subject to higher temperatures, loads, and oxidative environments, to maintain the performance of DLC at these harsh conditions, DLC is doped with hydrogen, various metals, nitrides, and carbides.Reference Neville, Morina, Haque and Voong16 Surface texturing has recently been considered as one of the methods to maintain and enhance the tribological performance of DLC coating.Reference Arslan, Masjuki, Varman, Kalam, Quazi, Al Mahmud, Gulzar and Habibullah12 Most of the work done in this regard is at room temperature. It is well known that DLC coatings possess lower thermal stability at higher temperatures. Therefore, in the present study, the authors have investigated the effect of textures on hydrogenated amorphous carbon (a-C:H) DLC coating at various temperatures.
II. SPECIMEN PREPARATION
M2 steel was used as a substrate material with an average hardness of 58 HRC. The samples were cut into 15 mm × 15 mm pieces. Surface roughness of the substrate was reduced by polishing with sand papers of various grit sizes ranging from 100 to 3000. Afterward, the samples were polished with diamond suspension with varying particle sizes (6–1 µm). After polishing, the average roughness of samples was 35 nm. The counter ball material was 100Cr6 bearing steel with a diameter of 6.35 mm and average roughness of 40 nm.
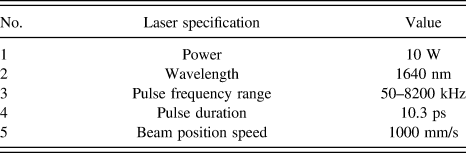
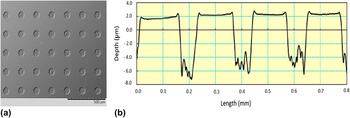
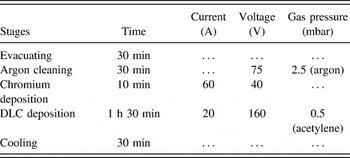
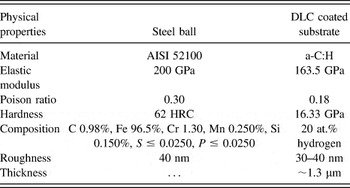
Micro textures with approximate dimensions of dimple depth, diameter, and density of 8 µm, 100 µm, and 20% were created on the substrate using a Pico second laser with a power of 10 W and a wave length of 1.06 µm. The specifications of used laser are mentioned in Table I. After surface texturing, the micro bulges around the dimples were removed by light polishing with a diamond suspension of 0.5 µm particle size. After surface texturing, the DLC coating was deposited by hybrid magnetron sputtering. Figure 1(a) shows the scanning electron micrograph of textured DLC and Fig. 1(b) shows the 2D profile of textured coating. The deposition parameters are mentioned in Table II. Composition and important properties of materials used in the tribological testing are mentioned in Table III.
Pico second laser specifications.

(a) SEM topographical image of textured sample, (b) 2D profile of textured dimples.

The deposition parameter of a-C:H DLC coating.

Composition and important properties of the tribological pair.

III. TRIBOLOGICAL TESTING PROCEDURE
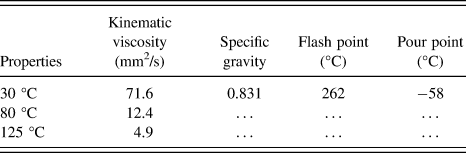
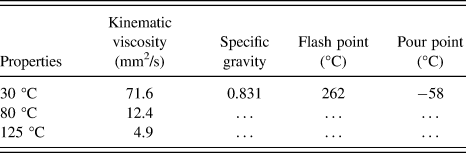
To evaluate the a-C:H DLC coating performance under various temperatures, a reciprocating sliding tribological testing apparatus with a ball on a flat configuration was used. The diameter of ball was 6.35-mm. Poly alpha olefin base oil was used as a lubricant; the properties of lubricant are mentioned in Table IV. The load, speed, and temperatures were selected to simulate the cam/tappet contact. Experimental conditions used are as follows: load = 100 N; temperature = 30, 80, and 125 °C; frequency = 5 Hz; test duration was 2 h and stroke length was 2.5 mm. This load corresponds to the Hertz contact pressure of 2.36 GPa. The contact pressure at the cam lobe and valve tappet interface is usually 0.6 GPa; we selected a higher contact pressure because laboratory testing is typically much shorter and higher contact pressure can accelerate the measureable wear. Various samples are denoted according to the temperature at which they are tested and whether they are textured or not; e.g., C-30 is for DLC coated sample tested at 30 °C and TC-30 is for textured coated sample tested at 30 °C. Before each test, the samples were cleaned with acetone in an ultrasonic bath. After testing, the specimens were rinsed with n-heptane before wear track characterization. After the removal of the tribolayers (if any), the wear rate was measured by calculating the wear volume using the weight loss method. An average of three measurements was taken to calculate the wear volume. Finally, the wear rate was calculated by V = kFs (Archard equation), where V is the wear volume, k is the specific wear rate coefficient, F is the normal load, and s is the total distance traveled.
Properties of lubricant used for tribological testing.
IV. COATING CHARACTERIZATION
Nano indentation technique (Hysitron, Inc., Model No. TI750 UBI™, Minneapolis, Minnesota) was used to investigate the mechanical properties of DLC coating. A scanning electron microscope (SEM) incorporated with energy dispersive spectroscope (EDS) (Hitachi, Model No. TM3030, Tokyo, Japan) and an atomic forced microscopy (AFM) (Q-ScopeTM 250/400, Ambios Technology) were used to analyze the wear track surface morphology. An EDS was used to analyze the elemental composition of the wear track and Raman spectroscopy was used to analyze the structural changes after the sliding test.
V. RESULTS AND DISCUSSIONS
A. Adhesion, hardness and Young's modulus
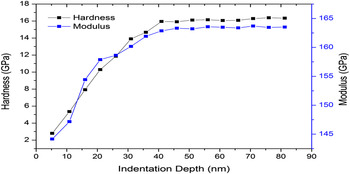
Hardness and Young's modulus of DLC coating was investigated with the nano indentation technique (Hysitron, Inc., Model No. TI750 UBI™). Nano indentation is a very powerful technique used to analyze the mechanical properties of thin film coatings on a nano-meter scale.Reference Fang and Chang17 The indent depth selected was 80 nm. An indentation depth of less than 10% coating thickness was selected so that the measurements were not influenced by the substrate.Reference Tsui, Vlassak and Nix18 Displacement control function was used. One indentation was used for depth. Six indentations were performed for each point to obtain a statistical representation of measurements. The indentations were performed outside the dimples, because the load was carried mainly by the DLC coated surface. Figure 2 shows the change in nano hardness and in the modulus with indentation depth. The values leveled off at the end, which indicated that the substrate did not affect the measurement. DLC coating showed hardness and Young's modulus of 15.5 and 145 GPa.
Hardness and Young's modulus variation with indentation depth of DLC coated bearing steel.

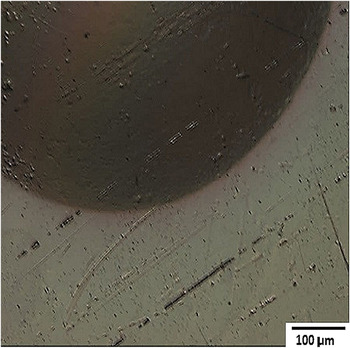
DLC coating adhesion was determined using the Rockwell C test. The classification of this test was based on the German standard VDI 3198, which has been previously used to evaluate DLC coating adhesion.Reference Ronkainen, Koskinen, Varjus and Holmberg19 In this test, the types of defects were classified as HF1–HF6: HF1 indicates the highest adhesion and HF6 indicates the lowest adhesion. Figure 3 shows the Rockwell C indentation on DLC coated steel. No signs of coating spallation and delamination were observed. Coating showed higher adhesion and can be classified as HF1.
Indent of Rockwell-C adhesion test on DLC coated substrate.

B. Friction and wear
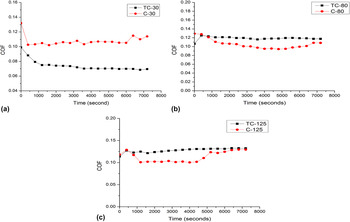
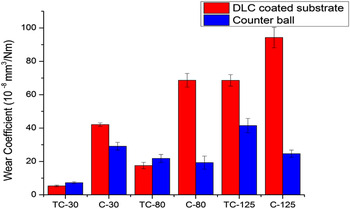
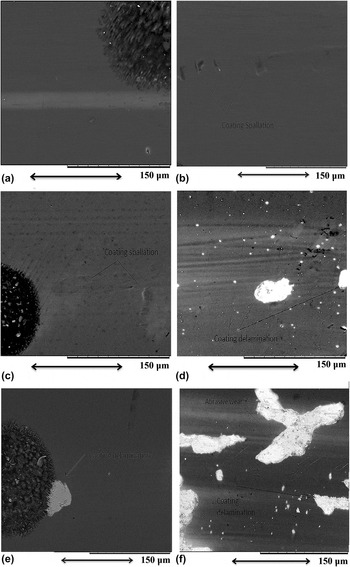
Figure 4 shows the friction coefficient variation with time for textured coated and un-textured coated samples. Textured coated samples showed relatively stable coefficient of friction (COF) with time compared to un-textured coated samples. As the temperature increases, the COF for un-textured DLC decreases, whereas it increases for textured DLC. TC-30 (textured coated at 30 °C) showed lower COF compared to C-30 (coated at 30 °C) throughout the friction test [Fig. 4(a)]. Figure 4(b) shows that COF curve of TC-80 (textured coated at 80 °C) was lower than C-80 (coated at 80 °C) at the start of the test and, after 1000 s, the COF reduced for C-80, whereas TC-80 remained stable till the end of the test; however, C-80 showed an increase in COF after 4600 s. COF, in the case of C-125 (coated at 125 °C) and TC-125 (textured coated at 125 °C), showed a sudden increase in the start. As the test progressed, COF reduced for C-125 until 5400 s; afterward, it increased and did not stabilize till the end of the friction test [as can be seen in Fig. 4(c)]. After the initial instability, COF, in case of TC-125, steadily increased to 0.132 at the end of the test [Fig. 4 (c)]. The reason for the decrease in COF of un-textured DLC at 80 and 125 °C may be due to higher graphitization transformation. The reduction in COF due to graphitization has been noticed previously.Reference He, Zheng, Pu, Zhang and Hu4 Due to graphitization, the coating layer becomes soft and the load bearing capacity reduces and wear increases.Reference Kalin, Roman, Ožbolt and Vižintin20 This could be the reason for the higher wear rate in the case of un-textured DLC at 30, 80, and 125 °C, as can be seen in Fig. 5. The increase in COF for un-textured DLC at the later part of friction testing may be due to coating delamination, as is observed in the SEM images [Figs. 6(d) and 6(f)].
Variation of friction coefficient as a function of time for textured and un-textured a-C:H DLC coating at various temperatures (a) 30 °C, (b) 80 °C, and (c) 125 °C.

Wear coefficient for textured and un-textured a-C:H DLC coating at various temperatures.

SEM images of textured and un-textured a-C:H DLC coating at various temperatures (a) TC-30, (b) C-30, (c) TC-80, (d) C-80, (e) TC-125, and (f) C-125.

In the case of textured DLC, COF increases with the increase in temperature [Figs. 4(a)–4(c)], which is different from un-textured DLC. This may be due to the suppression of graphitization by the textures; and lowering of lubricant viscosity with temperature may reduce the lubricant film thickness. Due to this, TC-125 COF behavior started to depend upon lubrication property of DLC coating. The reduction in graphitization transformation can explain the lower increase in the wear rate of textured DLC compared to un-textured DLC at various temperatures tested (Fig. 5). The wear rate increases with the increase in temperature for textured and un-textured DLC (Fig. 5). Wear coefficient results nearly followed the COF trend in the textured DLC case, whereas, in the case of un-textured DLC, it was opposite to the COF trend. This opposite trend of un-textured DLC can be explained by the fact that graphitization helps in reduction of COF; however, the adverse effect of graphitization transformation is increased wear rate. Textured DLC showed lower wear compared to un-textured DLC at 30, 80, and 125 °C. The friction and wear performance of DLC coating deteriorates with the increase in temperature.Reference Bremond, Fournier and Platon21 It was observed in a previous study that the tribological performance of DLC coating starts to change around 100 °C.Reference Vanhulsel, Blanpain, Celis, Roos, Dekempeneer and Smeets22 However, the textured DLC showed higher wear resistance compared to the un-textured DLC even at temperature above 100 °C.
The lower COF [Fig. 4 (a)] and wear rate (Fig. 5) of TC-30 compared to C-30 may be due to the textures, which retain lubricant, enhance the lubricant film thickness, and capture the wear debris. Textured DLC showed higher COF at 80 and 125 °C, which may be due to the lowering of lubricant viscosity by the increase in temperature. This phenomenon can reduce the lubricant film thickness between the tribo-pairs, thus increasing COF.
C. Raman analysis
Raman spectroscopy was used to investigate the graphitization behavior of DLC coating. Raman spectra was collected with an InVia Raman microscope (Gloucestershire, United Kingdom) with an argon ion laser and an excitation wave length of 514 nm. A 10% laser power was used to minimize the influence of the substrate in the measurements. Three Raman measurements were taken to present a statistical representation of results so that the inaccuracies resulting from peak fitting could be minimized.
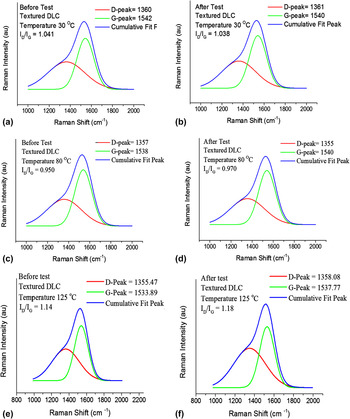
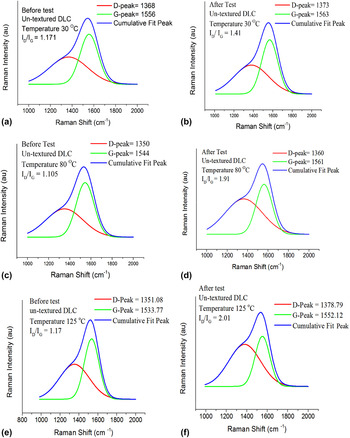
Figures 7 and 8 shows the Raman spectra for textured and un-textured DLC samples before and after sliding tests at various temperatures. Raman spectra were fitted into D and G peaks for quantitative analysis. The G peak indicates the stretching vibration of sp 2 carbon in C=C chains and aromatic rings, whereas the D peak indicates the breathing mode of sp 2 carbon in the aromatic rings.Reference Casiraghi, Ferrari and Robertson23 The shift in the G peak and increase in the I D/I G ratio indicate an increase in the sp 2 fraction in the DLC film.Reference Casiraghi, Ferrari and Robertson23,Reference Ferrari and Robertson24 The G peak, in the case of the sample [TC-30 (Fig. 7)] did not shift to a higher frequency and the I D/I G ratio did not increase. This indicates that, at lower temperatures, textured DLC did not show graphitization transformation. This result confirms that the lower COF, as seen in sample TC-30, was not because of graphitization, rather, the mechanism of textures mentioned in Sec. I was responsible for this. In the case of C-30 (Fig. 8) G peak shifted from 1556 to 1563 cm−1 and I D/I G ratio increased from 1.17 to 1.41. This shows that at 30 °C graphitization transformation occurred for un-textured DLC. In the case of sample C-80, the G peak shifted from 1544 to 1561 cm−1 and the I D/I G ratio increased from 1.10 to 1.91, which shows that, at 80 °C, graphitization occurred (Fig. 8). For the textured sample TC-80, the G peak shifted from 1538 to 1540 cm−1 and the I D/I G ratio increased from 0.950 to 0.970 (Fig. 7). This change is very small compared to the un-textured DLC at 80 °C. In the case of sample C-125, the G peak shifted from 1533 to 1552 cm−1 and the I D/I G ratio increased from 1.17 to 2.01 (Fig. 8). This shows that, as the temperature increased from 80 to 125 °C, the graphitization transformation increased. In the case of TC-125, the G peak shift and increase in the I D/I G ratio were from 1533 to 1537 cm−1 and 1.14 to 1.18, respectively (Fig. 7), which indicates a lower graphitization transformation. The Raman analysis show that graphitization transformation of textured DLC was too low compared to un-textured DLC.
Raman spectra for textured DLC at various temperatures (a) TC-30 (before test), (b) TC-30 (after test), (c) TC-80 (before test), (d) TC-80 (after test), (e) TC-125 (before test), (f) TC-125 (after test).

Raman spectra for un-textured DLC at various temperatures (a) C-30 (before test), (b) C-30 (after test), (c) C-80 (before test), (d) C-80 (after test), (e) C-125 (before test), and (f) C-125 (after test).

The atomic structure of a-C:H coating consists of sp 3, sp 2, and monovalent hydrogen bonds.Reference Neville, Morina, Haque and Voong16 The release of hydrogen from the DLC matrix triggers the transformation from a sp 3 structure to a graphite-like sp 2 structure. Graphitization can occur because of higher contact temperature and/or high contact stress.Reference Haque, Morina, Neville, Kapadia and Arrowsmith25,Reference Mobarak, Masjuki, Mohamad, Kalam, Rashedul, Rashed and Habibullah26 Haque et al.Reference Haque, Morina, Neville, Kapadia and Arrowsmith25 suggested that due to the micrometer-sized wear particles produced during the sliding test, the contact pressure reduces the graphitization temperature to as low as 95 °C. These particles can be generated from counter ball wear.Reference Haque, Morina, Neville, Kapadia and Arrowsmith25 Ding et al.Reference Ding, Wang, Wang, Wang, Hu and Xue27 proposed that, due to fatigue wear mechanisms, DLC wear debris can be created at the contact, which can lower the graphitization temperature. This can explain the graphitization transformation at 30 °C in our study. The lower graphitization in the case of textured DLC at higher temperatures may be due to multiple factors, including the wear debris trapping ability and the lubricant retention ability of micro dimples. Textures can remove the wear debris from the contacting surface, which can lessen the increase in contact pressure due to the wear particles between the tribo-pairs. Additionally, by keeping the lubricant at the interface, they can lower the rise in temperature due to friction-induced heating. In the case of textured mechanical seals, Xiao and KhonsariReference Xiao and Khonsari28 observed that micro dimples could lower the interface temperature by keeping lubricant at the interface.
D. Wear track analysis
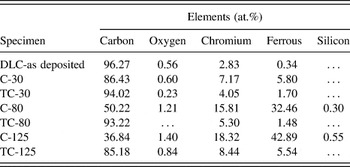
Figure 6 shows the SEM images of wear tracks. EDS quantitative analyses of the SEM images, are shown in Table V. Polishing wear was observed in the case of TC-30 [Fig. 6(a)]. The polishing wear process is the one in which micro grooves are not seen before the complete removal or delamination of coating. The brighter areas present on the wear tracks are due to the thinning of coating and exposure of sliver colored CrN. This phenomenon has been observed previously by Haque et al.Reference Haque, Morina, Neville, Kapadia and Arrowsmith25 C-30 showed coating spallation on the wear track [Fig. 6(b)]. TC-80 exhibited coating spallation, but micro scratches were not present [Fig. 6(c)]. C-80 exhibited coating delamination in a few spots, and micro scratches were also present on the wear track [Fig. 6(d)]. TC-125 showed coating spallation on the wear track [Fig. 6(e)]. C-125 exhibited scratch marks and extensive coating delamination [Fig. 6(f)]. C-125 showed a higher increase of Fe and decrease of C compared to deposited DLC coating (Table IV), which indicates that coating peeled off during the sliding test. TC-125 showed less increase in Fe and decrease in C compared to C-125 (can be seen in Table V). The scratches present on C-80 and C-125 indicate the abrasive wearing of coating by the wear particles present at the interface [Figs. 6(d) and 6(f)]. The brighter areas present on the wear tracks are due to exposure of sliver colored CrN interlayer [as shown in Figs. 6(d) and 6(f)]. The absence of the abrasive wear marks on TC-30, TC-80, and TC-125 may be due to the textures [Figs. 6(a), 6(c), and 6(e)], which trap these wear particles and causes lower abrasive wearing.
EDS analysis of a-C:H coating at various temperatures.

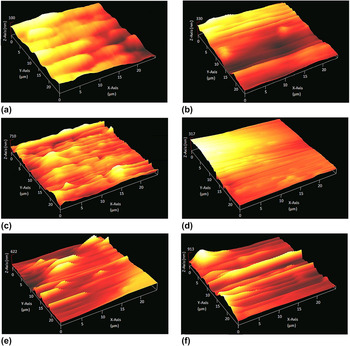
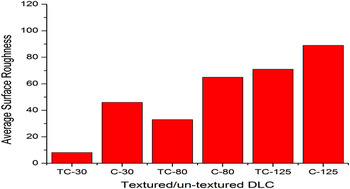
To further analyze the wear track profile, AFM was used. Figure 9 shows the AFM images of samples at various temperatures. Un-textured coated samples showed sharp grooves that can be created by the wear particles present at the interface [can be seen in Figs. 9(d)–9(f)]. These particles scratch the surface during sliding. Textured coated samples showed smoother wear tracks compared to un-textured samples [can be seen in Figs. 9(a)–9(c)]. As has been discussed in the previous paragraph, the wear particle capturing ability of textures helps in reducing the formation of sharp grooves on the track. Figure 10 shows the average roughness (R a) of the samples. TC-30 showed the lowest R a value of 8.34 nm and C-125 showed the highest average roughness of 89.13 nm. The general trend followed by all the samples is that average surface roughness increases with the increase in temperature. However, this increase is lower in the case of textured samples.
AFM images of textured and un-textured DLC (a) TC-30, (b) TC-80, (c) TC-125, (d) C-30, (e) C-80, and (f) C-125 samples.

Average surface roughness (R a) of textured/un-textured DLC coated samples at various temperatures.

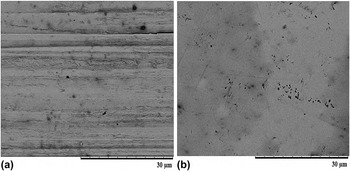
Figure 5 shows the wear rate of the counter ball, in the case of textured and un-textured DLC samples. The steel ball, which rubs against sample C-30, showed severe scratches, indicating abrasive wearing [Fig. 11(a)], whereas the ball that rubbed against sample TC-30 showed mild wear [Fig. 11(b)]. The reduction in wear of the TC-30 counter ball can be caused by dimples behaving as micro-hydrodynamic bearings that enhanced hydrodynamic pressure to provide additional lift; as a result, oil film thickness increased. This phenomenon, in the case of nonconformal contact, has been previously observed.Reference Wang, Liu, Zhou and Zhu29 In the case of textured DLC, the counter ball wear rate increases with the increase in temperature (Fig. 5). At 80 and 125 °C, the un-textured DLC showed lower wear rate than textured DLC. The reduction in wear rate in the case of un-textured DLC can be attributed to the fact that, due to graphitization, a graphitic transfer film forms on the counter surface, which provides an easy slip between the contacting surfaces.Reference Donnet30 In the case of textured DLC, the increase in wear rate of the counter ball with regard to temperature can be due to the lowering lubricant viscosity with temperature, which reduces the lubricant film thickness. Because graphitization was lower for textured DLC at 80 and 125 °C (Fig. 7), therefore, with the reduction in the film thickness, the ball wear rate increased for textured DLC samples.
SEM images of counter balls which rub against un-textured and textured DLC coating (a) C-30 and (b) TC-30.

VI. SUMMARY AND CONCLUSIONS
The effect of micro textures was investigated on the tribological performance of a-C:H DLC coating at various temperatures for nonconformal contact in lubricated sliding conditions. The operating conditions were similar to cam/tappet in an automotive engine.
(1) The results show that micro textures improved the wear resistance of a-C:H DLC coating compared to un-textured DLC at 30, 80, and 125 °C temperatures. This was due to textures behaving as fluid/wear debris reservoirs, whereas, at higher temperatures, this was due to the suppression of coating graphitization and textures behavior as fluid/wear debris reservoirs.
(2) At a lower temperature, 30 °C, textured DLC showed lower friction and wear compared to un-textured DLC.
(3) As the temperature increased to 80 and 125 °C, the textured DLC showed higher COF compared to un-textured DLC. This finding can be explained by the lowering of oil film thickness because the oil viscosity lowered with the increase in temperature.
(4) Results indicate that textured a-C:H coating can be used as a wear resistant coating in automotive cam/tappet system.
ACKNOWLEDGMENTS
The author would like to thank Ministry of Higher Education (MOHE) of Malaysia for HIR-MOHE Project (UM.C/HIR/MOHE/ENG/07) and University of Malaya Research Grant (UMRG), Project Nos. RP016-2012B and RP016-2012A. This work was originally accepted for and presented at Malaysian International Tribology Conference 2015.