


1. Introduction
Since the pioneering work of Prandtl (Reference Prandtl1926), the system composed of a circular cylinder, rigidly mounted in a cross-current and subjected to a forced rotation about its axis, has been the object of intense research, due to its fundamental interest as a paradigm of symmetry breaking in fluid dynamics and its applications to flow control (e.g. Modi Reference Modi1997). Beyond the Magnus effect, the imposed rotation may lead to the suppression of the von Kármán vortex street and associated force fluctuations, as well as in the emergence of a myriad of two- and three-dimensional flow regimes (Díaz et al. Reference Díaz, Gavaldà, Kawall, Keffer and Giralt1983; Kang, Choi & Lee Reference Kang, Choi and Lee1999; Mittal & Kumar Reference Mittal and Kumar2003; Stojković et al. Reference Stojković, Schön, Breuer and Durst2003; Pralits, Giannetti & Brandt Reference Pralits, Giannetti and Brandt2013; Radi et al. Reference Radi, Thompson, Rao, Hourigan and Sheridan2013; Navrose & Mittal Reference Navrose and Mittal2015; Rao et al. Reference Rao, Radi, Leontini, Thompson, Sheridan and Hourigan2015).
Previous studies have focused on a rotating cylinder placed at normal incidence, i.e. cylinder axis perpendicular to the oncoming flow. The present work aims at exploring the influence of a deviation from this canonical configuration, by inclining the rotating cylinder in the current. Such inclined configurations are frequently encountered in real physical systems, maybe more often than the perfectly normal one. Considering the variety of flow regimes arising downstream of a rotating circular cylinder, this study may also provide some insights into the inclination effects for other, non-axisymmetric, bluff body wakes.
The impact of body inclination has been well documented for a circular cylinder in the absence of rotation (Van Atta Reference Van Atta1968; Ramberg Reference Ramberg1983; Kozakiewicz, Fredsøe & Sumer Reference Kozakiewicz, Fredsøe and Sumer1995; Lucor & Karniadakis Reference Lucor and Karniadakis2003; Thakur, Liu & Marshall Reference Thakur, Liu and Marshall2004; Zhao, Cheng & Zhou Reference Zhao, Cheng and Zhou2009; Zhou et al. Reference Zhou, Razali, Zhou, Chua and Cheng2009; Willden & Guerbi Reference Willden and Guerbi2010; Bourguet & Triantafyllou Reference Bourguet and Triantafyllou2015). Examples of flow patterns developing in the wake of a non-rotating, circular cylinder placed at low and large inclination angles are visualized in figure 1, at a Reynolds number (Re) equal to  $100$. The inclination angle (
 $\theta$) refers to the angle between the oncoming flow direction and the plane perpendicular to the cylinder axis, as indicated in figure 1, i.e.
 $\theta =0^\circ$ corresponds to the normal incidence. The Reynolds number is based on the body diameter and the magnitude of the current velocity component normal to its axis (
 $U_\perp$). For
 $\theta =30^\circ$ (figure 1a), the flow is similar to that observed at normal incidence and consists of vortex rows shed parallel to the body. In contrast, for
 $\theta =75^\circ$ (figure 1b), the larger inclination induces an oblique orientation of the vortices, which are neither parallel to the body nor perpendicular to the current. In prior works, special attention was paid to the independence principle (IP). The IP states that the flow behaviour is determined by
 $U_\perp$ while the influence of the component of the current aligned with the cylinder axis is negligible. The appearance of oblique vortex shedding was often associated with a departure from the IP, typically for
 $\theta >40^\circ$ (e.g. Willden & Guerbi Reference Willden and Guerbi2010). In the above examples, the IP is valid for
 $\theta =30^\circ$. Yet, for
 $\theta =75^\circ$, it leads to an underestimation of the cross-flow force fluctuation amplitude and vortex formation frequency by
 $80\,\%$ and
 $150\,\%$ respectively, compared with those actually measured under oblique shedding.
Flow patterns downstream of a cylinder inclined in the current at  $Re=100$, in the absence of rotation: instantaneous iso-surfaces of spanwise vorticity (
 $\omega _z=\pm 0.35$) for (a)
 $\theta =30^\circ$ and (b)
 $\theta =75^\circ$. Arrows denote the oncoming flow. The regime names indicated in the panels will be introduced in §§ 3 and 4. Part of the computational domain is shown.

The switch from parallel to oblique vortex shedding depicted in figure 1 illustrates the impact of body inclination in the absence of rotation. This impact remains to be studied for a rotating cylinder, in particular to clarify the robustness of the trends previously identified at normal incidence, and to shed light on the possible emergence of novel flow regimes. An attempt is made here on the basis of three-dimensional numerical simulations, at  $Re=100$. The different regimes encountered for
 $\theta =0^\circ$ at
 $Re=100$ have been described in a recent work (§ 3 in Bourguet Reference Bourguet2020). Moreover, some typical behaviours induced by the rotation and observed at higher Re are already present at
 $Re=100$, e.g. vortex shedding suppression, reappearance of low-frequency unsteady regimes. In addition to the reference
 $\theta =0^\circ$ configuration, three values of
 $\theta$ are considered and the analysis is carried out in two steps. First, focus is placed on low inclination angles (
 $\theta =15^\circ$ and
 $\theta =30^\circ$), i.e. slight deviations from normal incidence, for which the IP is valid in the absence of rotation (§ 3). Second, the influence of a large inclination angle, that leads to a clear departure from the IP, is examined for
 $\theta =75^\circ$ (§ 4). For each value of
 $\theta$, the rotation rate (
 $\alpha$), defined as the ratio between body surface velocity and
 $U_\perp$, is progressively varied from
 $0$ to
 $5.5$, in order to provide a continuous vision of flow evolution. This range of
 $\alpha$ encompasses the two unsteady flow regions and three-dimensional transition reported for
 $\theta =0^\circ$ in the above mentioned study.
2. Formulation and numerical method
The physical system is visualized in figure 1. The cylinder is rigidly mounted and its axis is aligned with the  $z$ axis. Its length and diameter are denoted by
 $L$ and
 $D$. It is placed in an incompressible, uniform oncoming flow of velocity magnitude
 $U$ and parallel to the
 $(x,z)$ plane. The flow dynamics is predicted by the three-dimensional Navier–Stokes equations. The body inclination angle (
 $\theta$) is defined as the angle between the oncoming flow velocity and the
 $x$ axis. The normal and axial components of the oncoming flow designate the components parallel to the
 $x$ and
 $z$ axes. Their magnitudes are
 $U_\perp =U\cos (\theta )$ and
 $U_\parallel =U\sin (\theta )$, respectively. The magnitude of the normal component is used together with the fluid density (
 $\rho _f$) and
 $D$, to non-dimensionalize the physical variables;
 $U_\perp$ is preferred to
 $U$ as reference velocity magnitude for more clarity in the comparison with the normal incidence case and assessment of the IP validity. The Reynolds number is defined as
 $Re=\rho _f U_\perp D/\mu$, where
 $\mu$ denotes the fluid viscosity. The cylinder is subjected to a forced, counter-clockwise, steady rotation about its axis. The rotation is controlled by the rotation rate
 $\alpha =\varOmega D/(2U_\perp )$, where
 $\varOmega$ is the angular velocity of the cylinder. The
 $x$- and
 $y$-axis directions are referred to as the in-line (IL) and cross-flow (CF) directions. The force coefficients are defined as
 $C_{\{x,y\}}=2 F_{\{x,y\}} /(\rho _f D U_\perp ^2)$ where
 $F_{x}$ and
 $F_{y}$ are the dimensional sectional fluid forces in the IL and CF directions.
The values of Re and cylinder aspect ratio ( $L/D$) are set to
 $100$ and
 $24$, as in a previous work concerning a rotating cylinder at normal incidence (Bourguet Reference Bourguet2020). Considering the possible influence of the aspect ratio, it has been verified that increasing
 $L/D$ to
 $50$ and
 $80$ has no impact on flow features (e.g. parallel/oblique vortex shedding), including for irregular, three-dimensional initial conditions. Four inclination angles are examined in the main analysis,
 $\theta \in \{0^\circ ,15^\circ ,30^\circ ,75^\circ \}$, and
 $\alpha$ ranges from
 $0$ to
 $5.5$. Intermediate values of
 $\theta$ are also considered to clarify some aspects of regime transitions and IP validity ranges (Appendix).
The flow equations are solved by the parallelized code Nektar (spectral/ $hp$ element method; Karniadakis & Sherwin Reference Karniadakis and Sherwin1999), as in Bourguet (Reference Bourguet2020). The computational domain (
 $350D$ downstream and
 $250D$ in front, above and below the cylinder), boundary conditions (no-slip condition on the cylinder surface, flow periodicity on the side boundaries) and discretization (
 $3975$ elements in the (
 $x,y$) plane) are those employed in the above mentioned work, where validation results were presented. In particular, a large computational domain is considered to avoid any spurious blockage effects at high rotation rates (Mittal & Kumar Reference Mittal and Kumar2003). In order to select the non-dimensional time step (
 $0.0005$), polynomial order in the
 $(x,y)$ plane (
 $4$) and number of Fourier modes in the
 $z$ direction (
 $128$), a convergence study was carried out for
 $\theta \in \{30^\circ ,75^\circ \}$ and
 $\alpha \in \{2,5\}$. The relative differences on force statistics are lower than
 $1\,\%$ when dividing the time step by
 $2$ or increasing the polynomial order from
 $4$ to
 $5$.
The simulations are initialized with the established flow past a stationary cylinder at the selected inclination angle, then the rotation is started. The analysis is based on long time series (more than  $30$ cycles in periodic cases) collected after convergence of force statistics.
3. Low inclination angle
The flow past the rotating cylinder placed at normal incidence ( $\theta =0^\circ$) exhibits a variety of regimes when
 $\alpha$ is varied between
 $0$ and
 $5.5$: steady or unsteady, two- or three-dimensional, with more or less regular structures (Bourguet Reference Bourguet2020). This range of rotation rate values is examined here for two low inclination angles,
 $\theta =15^\circ$ and
 $\theta =30^\circ$.
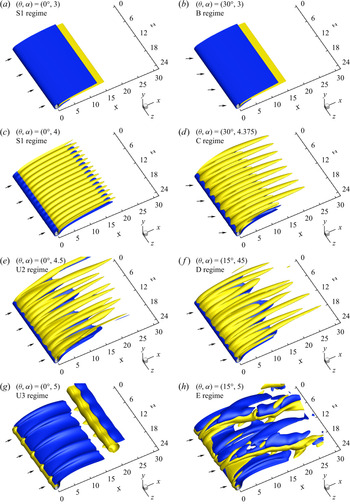
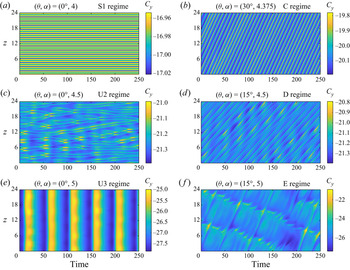
Side-by-side visualizations of the instantaneous wake patterns and time series of the CF force coefficient, observed for selected values of  $\alpha$, at normal incidence (
 $\theta =0^\circ$; left) and low inclination angles (
 $\theta \in \{15^\circ ,30^\circ \}$; right), are presented in figures 2 and 3, respectively. It is recalled that the reference velocity magnitude used in the definition of
 $\alpha$ and non-dimensionalization of the physical variables is
 $U_\perp$. This choice is made in order to assess the validity of the IP, which states that the flow behaviour is governed by
 $U_\perp$ instead of
 $U$. The side-by-side comparison proposed in figures 2 and 3 illustrates the persistence of several flow features when the body is inclined. It also emphasizes a marked effect of the inclination in some specific ranges of
 $\alpha$ (e.g. figure 2g,h).
Flow patterns downstream of the rotating cylinder at normal incidence (a,c,e,g) and low inclination angles (b,d,h,j): instantaneous iso-surfaces of spanwise vorticity ( $\omega _z= \pm 0.05$) for (a)
 $(\theta ,\alpha )=(0^\circ ,3)$, (b)
 $(\theta ,\alpha )=(30^\circ ,3)$, (c)
 $(\theta ,\alpha )=(0^\circ ,4)$, (d)
 $(\theta ,\alpha )=(30^\circ ,4.375)$, (e)
 $(\theta ,\alpha )=(0^\circ ,4.5)$, (f)
 $(\theta ,\alpha )=(15^\circ ,4.5)$, (g)
 $(\theta ,\alpha )=(0^\circ ,5)$ and (h)
 $(\theta ,\alpha )=(15^\circ ,5)$. Arrows denote the oncoming flow. Flow regime is specified in each panel. Part of the computational domain is shown.

Selected time series of the CF force coefficient along the span for (a)  $(\theta ,\alpha )=(0^\circ ,4)$, (b)
 $(\theta ,\alpha )=(30^\circ ,4.375)$, (c)
 $(\theta ,\alpha )=(0^\circ ,4.5)$, (d)
 $(\theta ,\alpha )=(15^\circ ,4.5)$, (e)
 $(\theta ,\alpha )=(0^\circ ,5)$ and (f)
 $(\theta ,\alpha )=(15^\circ ,5)$. Flow regime is specified in each panel.

Maps of the flow regimes as functions of  $\alpha$ are presented in figure 4, for
 $\theta \in \{0^\circ ,15^\circ ,30^\circ \}$. The unsteady and steady flow regimes are indicated in yellow and white colours, respectively. The typical frequencies of flow unsteadiness are quantified by the span-averaged spectra of
 ${C}_y$ fluctuation (
 $\tilde {\phantom {a}}$) time series. The spectra are obtained via fast Fourier transform; the spectral amplitudes are the span-averaged magnitudes of the Fourier modes. Selected spectra are plotted in figure 5. In the maps (figure 4), the dominant frequencies or ranges of dominant frequencies are denoted by grey symbols. In the latter case, the ranges encompass all the frequencies associated with amplitudes larger than
 $40\,\%$ of the peak value. Due to the axial component of the current, the flow past the inclined body is always three-dimensional. However, its structure can be invariant along the span (figure 2b) or not (figure 2d). In the maps, the regions where flow structure exhibits spanwise modulations are indicated by oblique blue stripes. For
 $\theta =0^\circ$, the successive flow regimes are designated by a letter (U stands for unsteady, S for steady) and a number in order to rank them; the first unsteady regime is named U1, the first steady regime S1, the second unsteady regime U2, etc. This systematic nomenclature was also employed in Bourguet (Reference Bourguet2020). For clarity, other names are used in the inclined body cases. For
 $\theta = 15^\circ$ and
 $\theta = 30^\circ$, the successive regimes are identified by capitals (A, B, etc.). Regime names are specified in red in the maps.
Flow regimes as functions of the rotation rate for (a)  $\theta =0^\circ$, (b)
 $\theta =15^\circ$ and (c)
 $\theta =30^\circ$. The different regimes are delimited by black dashed lines. Regime names (U1, U2, U3, S1 and S2 for
 $\theta =0^\circ$; A, B, C, D, E and F for
 $\theta \in \{15^\circ ,30^\circ \}$) are specified in red. Oblique blue stripes denote the regions where flow structure exhibits spanwise modulations. The unsteady/steady flow regimes are indicated in yellow/white. The dominant frequencies (grey circles) or ranges of dominant frequencies (intervals delimited by grey triangles) of the CF force fluctuation (based on span-averaged spectra of
 $\tilde {C}_y$), are plotted in each unsteady flow region; in (b,c), for comparison, black crosses represent the dominant frequencies for
 $\theta =0^\circ$.

Span-averaged frequency spectrum of the CF force coefficient fluctuation for (a)  $(\theta ,\alpha )=(30^\circ ,1)$, (b)
 $(\theta ,\alpha )=(30^\circ ,4.375)$, (c)
 $(\theta ,\alpha )=(15^\circ ,4.5)$ and (d)
 $(\theta ,\alpha )=(15^\circ ,5)$. The spectral amplitudes are normalized by their maximum value. Flow regime is specified in each panel. In (a,d), a blue dashed line denotes the frequency identified at normal incidence.

Each map in figure 4 is composed of two unsteady flow regions and spanwise modulations emerge in the high- $\alpha$ range: the global evolution of the flow as a function of
 $\alpha$ is thus comparable for
 $\theta \in \{0^\circ ,15^\circ ,30^\circ \}$.
For low  $\theta$ (
 $\theta \in \{15^\circ ,30^\circ \}$), no significant effect of body inclination is noted up to
 $\alpha \approx 3.7$. The critical values of
 $\theta$ for the emergence of inclination effects in this range of
 $\alpha$ are addressed in the Appendix. The A and B regimes are similar to the U1 and S1 regimes (also known as ‘mode I shedding’ and ‘steady state I’ in the literature (e.g. Rao et al. Reference Rao, Radi, Leontini, Thompson, Sheridan and Hourigan2015)), respectively. For
 $\alpha <1.8$ (U1/A regimes), the flow is invariant along the span, unsteady and periodic, as illustrated by a typical frequency spectrum in figure 5(a). Two counter-rotating, spanwise vortices aligned with the cylinder axis form per period. The rotation causes an asymmetry in the strength of the positive and negative vortices but the flow structure is comparable to that depicted in figure 1(a). Flow frequencies, which remain close to the Strouhal frequency (i.e. vortex shedding frequency for
 $(\theta ,\alpha )=(0^\circ ,0)$,
 $\,f_{St} = 0.16$; Williamson Reference Williamson1996), are identical in the three cases. In the spectrum plotted in figure 5(a), a blue dashed line denotes the vortex shedding frequency at normal incidence; in the maps, for
 $\theta >0^\circ$, black crosses represent the dominant frequencies identified for
 $\theta =0^\circ$. In all three cases, as also reported in prior works for
 $\theta =0^\circ$ (e.g. Kang et al. Reference Kang, Choi and Lee1999), vortex shedding ceases when
 $\alpha$ is increased above
 $1.8$ and the steady, spanwise-invariant flow is composed of layers of vorticity of opposite signs and deflected upwards (S1/B regimes). As shown in figure 2(a,b), the vorticity distribution downstream of the inclined body is indiscernible from that observed at normal incidence for the same value of
 $\alpha$.
In contrast, a low inclination angle is found to alter the flow regimes beyond  $\alpha \approx 3.7$, around the second unsteady flow region. At normal incidence, the flow undergoes three-dimensional transition for
 $\alpha \approx 3.7$, as also noted in previous studies (Pralits et al. Reference Pralits, Giannetti and Brandt2013; Rao et al. Reference Rao, Leontini, Thompson and Hourigan2013), but it remains steady until
 $\alpha \approx 4.15$. This scenario is modified once the cylinder is inclined since spanwise modulations and flow unsteadiness arise simultaneously, around
 $\alpha = 3.9$ and
 $\alpha = 4.2$, for
 $\theta =15^\circ$ and
 $\theta =30^\circ$, respectively. For
 $\theta =0^\circ$, the three-dimensional region of the steady S1 regime is characterized by a regular spanwise alignment of streamwise tongues of vorticity with a typical wavelength of
 $1.6$ body diameters (figures 2c and 3a). This pattern resembles the structure of ‘mode E’ issued from stability analysis (Rao et al. Reference Rao, Radi, Leontini, Thompson, Sheridan and Hourigan2015). For
 $\theta =15^\circ$ and
 $\theta =30^\circ$, the wake patterns encountered in the C regime are comparable to those observed in the three-dimensional region of the S1 regime, except that the tongues of vorticity are slanted in the direction of the axial flow component (figure 2(d); the value of
 $\alpha$ differs from that considered in figure 2(c) because the C regime occurs in a slightly higher
 $\alpha$ range for
 $\theta =30^\circ$). The slant angles with respect to the
 $x$ axis are lower than
 $\theta$, for example
 $9^\circ$ vs
 $\theta =30^\circ$ in the case depicted in figure 2(d). Therefore, the vorticity tongues are not strictly aligned with the current. The vorticity tongues move along the span towards increasing
 $z$, due to the axial flow. This is visualized via
 $C_y$ time series in figure 3(b). Vorticity tongue motion leads to periodic fluctuations of frequencies ranging from
 $0.1$ to
 $0.14$ (figure 5b). The spanwise convection velocity is of the order of
 $70\,\%$ of
 $U_\parallel$. The spanwise wavelength may vary from one case to the other and deviate from that observed in the three-dimensional region of the S1 regime, e.g.
 $1.6$ diameters for
 $(\theta ,\alpha )=(15^\circ ,4.2)$ vs
 $3$ diameters for
 $(\theta ,\alpha )=(30^\circ ,4.375)$. As discussed in the Appendix, the orientation of the vorticity tongues and flow unsteadiness actually arise as soon as
 $\theta >0^\circ$, i.e. below
 $\theta =15^\circ$. Overall, the C regime represents a slanted, unsteady version of the three-dimensional part of the S1 regime.
When  $\alpha$ is further increased, the D regime emerging close to
 $\alpha =4.5$ is similar to the U2 regime observed for
 $\theta =0^\circ$ (figure 2e,f). The shape of the wake in these regimes resembles those occurring in the S1/C regimes, with comparable spanwise wavelengths (2–3 diameters), but the alignment of the vorticity tongues is more erratic. Similar patterns were reported by Radi et al. (Reference Radi, Thompson, Rao, Hourigan and Sheridan2013) and Navrose & Mittal (Reference Navrose and Mittal2015). The flow is unsteady. Its time evolution is less regular and involves ranges of frequencies (figure 5c). The principal effect of body inclination resides in the orientation of the vorticity tongue motion in the direction of the axial flow (increasing
 $z$, with convection velocities close to those measured in the C regime), while no preferential orientation appears for
 $\theta =0^\circ$; this phenomenon can be visualized in
 $C_y$ time series in figure 3(c,d).
A major difference is identified between the inclined and normal incidence configurations in the last regime of the second unsteady region, around  $\alpha =5$. For
 $\theta =0^\circ$, the U3 regime (also referred to as ‘mode II shedding’; Rao et al. Reference Rao, Radi, Leontini, Thompson, Sheridan and Hourigan2015) is characterized by the periodic shedding of a single, large-scale spanwise vortex per cycle, at low frequency compared with the U1 regime, typically close to
 $0.02$ (figures 2g and 3e). It has been reported under two-dimensional flow assumption (e.g. Stojković et al. Reference Stojković, Schön, Breuer and Durst2003) even though it is actually three-dimensional (Radi et al. Reference Radi, Thompson, Rao, Hourigan and Sheridan2013; Navrose & Mittal Reference Navrose and Mittal2015), with a spanwise wavelength of the order of
 $5$ diameters at
 $Re=100$ (Bourguet Reference Bourguet2020). The regime developing for
 $\theta =15^\circ$ and
 $\theta =30^\circ$ (E regime) also exhibits low-frequency fluctuations (figure 5(d) where the U3 regime frequency is denoted by a blue dashed line) but the spatial organization is substantially modified: it is irregular, streamwise oriented, without dominant spanwise wavelength (figures 2h and 3f). As in the C and D regimes, a global propagation of flow structure is noted in the direction of the axial component. Yet, it is less clearly defined and the propagation may occasionally occur in the opposite direction. Additional results presented in the Appendix indicate that the single-sided vortex shedding vanishes beyond a critical value of
 $\theta$ between
 $10^\circ$ and
 $15^\circ$. The fact that a slight deviation from
 $\theta =0^\circ$ suffices to disrupt the single-sided vortex shedding suggests a high sensitivity of the U3 regime to external disturbances. Such sensitivity was also observed when the rotating cylinder, placed at normal incidence, was subjected to low-amplitude vibrations (figure 16(b) in Bourguet Reference Bourguet2020); the irregular flow pattern visualized in this case is comparable to that depicted in figure 2(h).
Beyond  $\alpha =5.15$ and up to
 $\alpha =5.5$ (S2/F regimes, also known as ‘steady state II’ for
 $\theta =0^\circ$; Rao et al. Reference Rao, Radi, Leontini, Thompson, Sheridan and Hourigan2015), the flow is steady, spanwise invariant and its structure, which is the same in all three cases, is close to that described in the S1/B regimes.
The statistics of fluid forces presented in figure 6 corroborate the above observations. For each  $\theta$, the evolutions of the span- (
 $\langle \phantom {a}\rangle$) and time-averaged (
 $\bar {\phantom {a}}$) values of
 $C_x$ and
 $C_y$, as well as the span-averaged, root-mean-square values of their fluctuations are plotted as functions of
 $\alpha$. As previously indicated,
 $U_\perp$ is used as reference velocity magnitude to non-dimensionalize the forces. At low inclination angles (
 $\theta =15^\circ$ and
 $\theta =30^\circ$), force statistics are identical to those reported for
 $\theta =0^\circ$ below
 $\alpha \approx 3.7$ and globally match their trends over the entire parameter space. In particular, the reduction of
 $\langle \bar {C}_x\rangle$ which becomes negative around
 $\alpha = 4$ and the departure of
 $\langle \bar {C}_y\rangle$ from the potential flow prediction (
 $C_y=-2{\rm \pi} \alpha$; dotted line), are not impacted by the inclination. Some deviations can be noted in the second unsteady flow region; in order to locate the typical
 $\alpha$ ranges where the flow is unsteady for low
 $\theta$, the unsteady flow regions identified for
 $\theta =15^\circ$ are indicated in yellow in the plots. Around
 $\alpha =4$, low-amplitude force fluctuations appear in the C regime (
 $\theta =15^\circ$, figure 6c), as expected due to the unsteady nature of this regime, while the flow remains steady for
 $\theta =0^\circ$ (S1 regime). In addition, the switch from the single-sided vortex shedding (U3 regime) to the irregular E regime (horizontally striped area), once the body is inclined, is accompanied by an alteration of fluid force coefficients, whose fluctuations can be amplified (IL direction) or reduced (CF direction).
Force statistics as functions of the rotation rate, for  $\theta \in \{0^\circ ,15^\circ ,30^\circ ,75^\circ \}$: span-averaged values of the (a,b) time-averaged force coefficients and (c,d) root-mean-square values of the force coefficient fluctuations in the (a,c) IL and (b,d) CF directions. Yellow/white areas indicate the unsteady/steady flow regions for
 $\theta =15^\circ$, in order to locate the typical
 $\alpha$ ranges of flow unsteadiness for low
 $\theta$; horizontal grey stripes denote the E regime region. In (a), a plain black line indicates
 $\langle \bar {C}_x\rangle =0$. In (b), a black dotted line represents the potential flow prediction of the CF force coefficient.

To summarize, the limited influence of body inclination emphasized in this section shows the robustness of prior observations made for  $\theta =0^\circ$ and the validity of the IP to capture the general trends of the flow. Some noticeable effects of the axial current are, however, uncovered around the second unsteady flow region. Once the body is inclined, flow unsteadiness is found to reappear simultaneously with the spanwise modulations of its structure, which propagate in the axial flow direction, while the single-sided vortex shedding regime vanishes. The impact of a large
 $\theta$ is examined in the next section.
4. Large inclination angle
In order to investigate the influence of a large deviation from the normal incidence configuration, the body is now inclined at  $\theta =75^\circ$. In the absence of rotation, as previously mentioned and visualized in figure 1(b), such an inclination angle results in an oblique orientation of the vortex rows, associated with a departure from the IP.
Typical wake patterns and CF force coefficient time series, encountered once the inclined cylinder rotates, are presented in figures 7 and 8. They substantially differ from those reported in § 3. A map of the flow regimes as functions of  $\alpha$ is plotted in figure 9. Contrary to what was observed for low
 $\theta$, the flow is found to be unsteady and its structure to vary along the span over the entire range of
 $\alpha$. As in figure 4, the frequency ranges represented in the map encompass all the frequencies of amplitudes larger than
 $40\,\%$ of the peak value. Three distinct regimes can be identified. In the map and in the following, they are designated by Roman numerals (I, II, III) to avoid confusion with those appearing for low
 $\theta$ values.
Same as figure 2 at large inclination angle ( $\theta =75^\circ$;
 $\omega _z=\pm 0.35$) for (a)
 $\alpha =1.7$, (b)
 $\alpha =2$, (c)
 $\alpha =2.5$ and (d)
 $\alpha =4$.

Same as figure 3 for  $\theta =75^\circ$: (a)
 $\alpha =1.5$, (b)
 $\alpha =1.7$, (c)
 $\alpha =2$ and (d)
 $\alpha =4$.

Same as figure 4 for  $\theta =75^\circ$. Regime names (I, II and III) are specified in red.

Up to  $\alpha \approx 1.7$ (I regime), the flow is periodic and composed of obliquely shed, counter-rotating vortices, as for
 $\alpha =0$ (figure 1b), but with an asymmetry in the strength of the positive and negative vortices due to the rotation. At each spanwise location, the structure of the flow visualized in the (
 $x,y$) plane closely resembles that observed under parallel shedding. The vortices are peeling off from the cylinder as they form, which results in a slanted spatio-temporal evolution of
 $C_y$ (figure 8a). Regardless the value of
 $\alpha$ within this regime, the angle of the vortex rows remains close to
 $35^\circ$ relative to the cylinder axis. The shedding frequency is close to
 $0.4$, vs
 $0.16$ for
 $\theta =0^\circ$ (black crosses in the map). A deviation from the IP prediction towards higher frequencies was also noted in prior works concerning non-rotating cylinders, when the vortex rows were less inclined than the body relative to the current (Ramberg Reference Ramberg1983; Bourguet & Triantafyllou Reference Bourguet and Triantafyllou2015). It should be mentioned that a scaling of the shedding frequency based on the magnitude of the current velocity perpendicular to the vortex rows,
 $U\cos (\theta -35^\circ )$ instead of
 $U_\perp$, still departs from the normal incidence case value.
The transition between the I and II regimes, close to  $\alpha =1.7$, is visualized in figures 7(a) and 8(b). The above described oblique vortex shedding is found to be combined with a regular pattern almost perpendicular to the vortex rows. This pattern corresponds to the typical structure of the II regime, depicted in figure 7(b). It is characterized by vorticity tongues of spanwise wavelengths close to
 $2$ diameters, spanwise convection velocities similar to those observed in the C and D regimes, i.e.
 $60\,\%$ to
 $70\,\%$ of
 $U_\parallel$, and large slant angles of
 $50^\circ$ approximately (relative to the
 $x$ axis). An inversion of the positive and negative vorticity layers can also be noted, compared with the S1/C/U2/D regimes (figure 2c–f). An example of
 $C_y$ time series in the II regime is presented in figure 8(c). Flow unsteadiness involves ranges of much higher frequencies than the oblique vortex shedding occurring in the I regime, typically 1.2–1.4. During regime transition (figures 7a and 8b), the incommensurable frequencies associated with both phenomena, i.e. oblique vortex shedding and propagation of perpendicular vorticity tongues, coexist. This coexistence is illustrated by the force frequency spectrum in figure 10(a), which consists of the superposition of the spectra associated with both phenomena. The peak associated with the oblique vortex shedding and that related to the vorticity tongues are indicated in the spectrum; their frequency ratio is
 $3.7$. It can be observed that the frequency of the oblique shedding identified in the I regime (
 $0.39$ for
 $(\theta ,\alpha )=(75^\circ ,1.5)$; blue dashed line) is not altered by the presence of the perpendicular vorticity tongues during regime transition.
Same as figure 5 for  $\theta =75^\circ$: (a)
 $\alpha =1.7$ and (b)
 $\alpha =4$. In (a), a blue dashed line denotes the oblique vortex shedding frequency for
 $(\theta ,\alpha )=(75^\circ ,1.5)$ (I regime).

The III regime that develops when  $\alpha$ is further increased represents a disordered version of the II regime (figures 7c,d and 8d). Up to
 $\alpha =4$, the level of irregularity of the spatial structure tends to increase with
 $\alpha$, and the width of the corresponding broadband frequency ranges exhibits some variability (figure 9). The spectrum of
 $\tilde {C}_y$ for
 $\alpha =4$ is plotted in figure 10(b). Beyond
 $\alpha =4$, flow shape and frequency content do not significantly change until
 $\alpha =5.5$. In spite of the disordered nature of the III regime, some features of the II regime (e.g. wavelength, slant angle) are still identifiable close to the cylinder.
The statistics of fluid forces associated with these new flow regimes are plotted in figure 6 (green square symbols). The forces present temporal fluctuations throughout the parameter space, in accordance with the suppression of the steady flow regimes. Even if the overall trends of the time-averaged force coefficients are comparable in the low- $\alpha$ range, especially under counter-rotating vortex shedding, in general, force coefficient statistics do not match those reported for
 $\theta =0^\circ$, and thus the IP prediction. Large deviations can be noted, with the absence of negative
 $\langle \bar {C}_x\rangle$ and amplifications of force coefficient fluctuations which are much more pronounced than those induced by low
 $\theta$. For example, the IL fluctuation amplitudes are multiplied by
 $4.5$ for
 $\alpha =5$ (figure 6c).
The present results highlight a complete reorganization of flow evolution scenario over the entire range of  $\alpha$, accompanied by a major divergence from the IP.
5. Conclusion
The impact of body inclination on the flow past a rigidly mounted cylinder subjected to a forced rotation has been investigated numerically at  $Re=100$, up to
 $\alpha =5.5$.
A low inclination angle ( $\theta \in \{15^\circ ,30^\circ \}$) has a limited influence on the global evolution of the flow with
 $\alpha$, since the two unsteady flow regions and the emergence of spanwise modulations of flow structure in the high-
 $\alpha$ range are preserved. Such limited influence shows the low sensitivity of prior observations reported for
 $\theta =0^\circ$ towards slight deviations from this canonical configuration, as well as the possibility of predicting the principal trends of the flow and fluid forces via the IP, based on the normal component of the current only.
A closer examination, however, reveals some effects of the axial flow component beyond  $\alpha \approx 3.7$, around the second unsteady flow region. Two elements can be noted. First, the steady, spanwise-varying flow regime vanishes. Flow unsteadiness reappears simultaneously with spanwise modulations, which propagate along the body. The second unsteady flow region thus consists of three distinct regimes instead of two for
 $\theta =0^\circ$. Second, the periodic, single-sided vortex shedding is replaced by a radically different regime, characterized by an irregular, streamwise-oriented structure.
In contrast, placing the cylinder at large inclination angle ( $\theta =75^\circ$) leads to a major reorganization of flow evolution scenario over the entire range of
 $\alpha$. This reorganization includes the disappearance of all steady flow regimes and the occurrence of three successive regimes whose structures (oblique vortex shedding, strongly slanted vorticity tongues) reflect the pronounced asymmetry of the configuration; it is accompanied by a dramatic enhancement of fluid force coefficient fluctuations, far from the IP prediction.
Acknowledgements
This work was performed using HPC resources from CALMIP (grants 2020-P1248 and 2021-P1248).
Funding
This research received no specific grant from any funding agency, commercial or not-for-profit sectors.
Declaration of interests
The author reports no conflict of interest.
Appendix. Complements on regime transitions and IP validity
In the range of rotation rates where the flow is invariant along the span at normal incidence, i.e. below  $\alpha \approx 3.7$, the impact of body inclination is imperceptible up to
 $\theta =50^\circ$ approximately. The transition from parallel vortex shedding (U1/A regimes) to oblique vortex shedding (I regime) occurs for a critical value of
 $\theta$ between
 $50^\circ$ and
 $55^\circ$. Up to this critical value, the flow is identical to that observed at normal incidence and the IP is valid. This is visualized in figure 11(a) by the ratio between the vortex shedding frequencies in the inclined body case and at normal incidence, for
 $\alpha =0$ and
 $\alpha =1$. The deviation from the frequency ratio of
 $1$, under oblique shedding, follows the trend reported by Van Atta (Reference Van Atta1968) for
 $\alpha =0$ at comparable Re values (blue dashed line in the plot). In the spanwise-invariant flow region of the steady S1/B regimes, the effect of body inclination arises for a critical
 $\theta$ between
 $70^\circ$ and
 $75^\circ$, where the flow becomes unsteady as illustrated in figure 11(b) by selected time series of
 $C_y$ at midspan point, for
 $\alpha =3$. The IP remains valid below this critical inclination angle.
Flow regimes vs inclination angle: (a) ratio between the vortex shedding frequencies in the inclined body case and at normal incidence as a function of the inclination angle, for  $\alpha \in \{0,1\}$ (the ratio of
 $1$ is denoted by a plain black line, the trend reported by Van Atta (Reference Van Atta1968) for
 $\alpha =0$ is represented by a blue dashed line and the regions of parallel/oblique vortex shedding are indicated in white/grey); (b) selected time series of the CF force coefficient at midspan (
 $z=12$) for
 $(\theta ,\alpha )=(70^\circ ,3)$ and
 $(\theta ,\alpha )=(75^\circ ,3)$; (c,d) same as figure 3 for (c)
 $(\theta ,\alpha )=(5^\circ ,4)$ and (d)
 $(\theta ,\alpha )=(10^\circ ,5)$.

In the higher- $\alpha$ range, where the flow exhibits spanwise modulations at normal incidence (striped area in figure 4a), the impact of cylinder inclination is visible as soon as
 $\theta >0^\circ$, since it induces a preferential orientation of the spanwise patterns and of their propagation. This orientation in the direction of the axial flow, i.e. towards increasing
 $z$, is depicted in figure 11(c,d) via time series of
 $C_y$ along the span for
 $\alpha \in \{4,5\}$ and low inclination angles. In particular, the spanwise propagation of the vorticity tongues and the associated disappearance of the steady, spanwise-varying flow regime, around
 $\alpha =4$, occur as soon as the body is inclined. Therefore, the IP is not strictly valid once
 $\theta >0^\circ$. It is, however, recalled that, for low
 $\theta$ values, it may provide an estimate of the dominant trends of the flow and fluid forces, as shown in figure 6. In spite of the above mentioned orientation, the low-frequency, single-sided vortex shedding developing close to
 $\alpha =5$ is found to persist up to a critical
 $\theta$ value located between
 $10^\circ$ and
 $15^\circ$, beyond which an irregular, streamwise-oriented pattern emerges (figure 2h).