Since the Gallup Poll’s inauguration in the mid-twentieth century, the mean level of public support for the president has evolved into one of the most anxiously watched quantities in the political arena. The survey is a readily accessible measure of the ‘Chief Executive’s’ stock of political capital.Footnote 1 As such, scholars have shown its critical influence on a range of political outcomes from legislative success in Congress, to congressional and presidential electoral fortunes and even to the propensity of presidents to exercise military force abroad.Footnote 2
However, particularly in today’s intensely polarized political environment, the variance of presidential approval – its volatility, predictability and anticipated stability over repeated polls – may be just as important as its mean level at any given moment. Indeed, in a country almost evenly divided along party lines, for much of its tenure in office the Bush administration has focused on solidifying its conservative base and minimizing the volatility in Republican support for the president, even at the expense of pursuing policies that might appeal to the ‘median respondent’.Footnote 3
To illustrate the importance of variance, consider the 2004 election season, when the president’s popularity rating hovered just north of 50 per cent. If, as numerous studies suggest, presidential approval is a strong predictor of the actual outcome at the ballot box, high variance about that mean could foreshadow political disaster.Footnote 4 Instability in popular support for the president yielding significantly different estimates of mean approval from poll to poll – even in the absence of any exogenous shock – signals an electorate that could swing either way on election day. Repeated polling could return a result in the mid 50s or mid 40s with equal probability, one foreshadowing a convincing victory, the other a catastrophic defeat. Through a carefully orchestrated campaign, Karl Rove and the other architects of the Bush re-election victory aimed primarily to reduce this uncertainty by stabilizing the president’s level of popular support around its modest, yet ‘good enough’, mean.Footnote 5
Increasingly, students of public opinion have emphasized the political importance of variance and response instability, particularly in presidential approval.Footnote 6 However, these studies have largely failed to examine how the effect of many traditional explanatory variables on approval volatility is mediated by groups’ partisan predispositions to support or oppose the president.
In this article, we examine the effect of major events and war on the variance in approval among the president’s partisan supporters, opponents and independents. An extensive literature probes the conditions under which the American public rallies round or punishes the president in the wake of major international and domestic events.Footnote 7 In a similar vein, numerous studies have explored the influence of combat casualties on support for the ‘Commander in Chief’ and the debate about whether their effect on opinion is invariant or conditional on the public’s perceptions of the mission’s prospects for success, elite consensus or dissension, or even the nature of the military venture itself.Footnote 8 While important differences remain between different schools of thought, all of these studies share a common focus – they only examine the effect on mean approval of events and casualties. Here we take a different approach: we explore the effects of these same factors on the volatility of presidential support.
For the president’s co-partisans, adverse developments, such as combat casualties and negative rally events, conflict with their partisan proclivities to rally around their standard bearer in the Oval Office. As such, these individuals’ approval choices should be more unstable across repeated queries, and at the aggregate level this should produce greater error variance and heightened volatility of approval around the group’s predicted mean. Conversely, positive developments reinforce partisan leanings and decrease the variance in presidential support. For opposition party identifiers, the logic is reversed.
We examine these expectations within contemporary theories of survey response, and test them using Gallup presidential approval data, disaggregated by partisan identification, and individual-level panel data from the 1980 National Election Study. Across partisan groups, the empirical results strongly accord with theoretical expectations: factors that reinforce partisan predispositions both decrease volatility at the individual level and lower variance in the aggregate, while those that conflict with a group’s partisan leanings increase approval variance.
Variance and models of the survey response
At least since Phillip Converse’s seminal article in 1964, scholars have recognized the importance of variance and volatility in public opinion data and its implications for policy making.Footnote 9 Yet for decades most scholars had either treated response volatility as evidence that the public lacked ‘true preferences’ on questions of major importFootnote 10 or dismissed it as an artefact of measurement error.Footnote 11 More recently, however, advances in our understanding of the cognitive dynamics producing survey responses have shed new light on the root causes of response instability and offered insights into how real world developments may produce changes in variance over time.
Instead of conceptualizing the survey response as the expression of a ‘true attitude’, a growing number of scholars have begun to understand it as a temporary construct formed from a well of internally-conflicted competing considerations.Footnote 12 Simple ‘off the top of the head’ models posit that the survey response is drawn merely from the first consideration that comes to mind when the question is asked,Footnote 13 while other models argue that individuals average across a range of salient considerations when constructing their responses.Footnote 14 Both models, however, locate the source of response variance in the same place: the presence or absence of conflicting considerations underlying the survey response.Footnote 15
In the ‘top of the head’ model, the presence of conflicting considerations raises the possibility that at one moment an individual may recall a perspective that moves him to answer a question in a given way, while at a later moment the same individual may recall a different consideration leading him to respond to an identically worded question in the opposite manner. From the averaging perspective, the presence of conflicting considerations leads to ambivalence, which in turn produces response instability across repeated queries.Footnote 16
Applying these perspectives to the variance in presidential approval suggests that the influence of many factors, such as major events and armed conflicts, will not be uniform across all partisan groups; rather it will depend on whether these developments reinforce or conflict with respondents’ partisan predispositions to support or oppose a sitting president.Footnote 17 Therefore, to investigate the effect of well-known explanatory variables on approval variance we must disaggregate the approval series by partisan identification.
For members of the president’s party, adverse developments conflict with partisan predispositions to support their party leader in the White House.Footnote 18 Building on prior research at the individual level, because these respondents now possess strong, highly salient conflicting considerations on which to draw when forming their survey response, their support for the president should be less stable and more susceptible to sudden change. Conversely, for opposition party identifiers, these negative developments reinforce partisan predispositions to oppose the president. Far from creating ambivalence, they may decrease it.
For positive developments, such as traditional ‘rally around the flag’ events, the dynamic is essentially reversed. These provide alternative considerations when judging the president’s job performance for opposition party identifiers that conflict with their negative partisan bent. As a result, positive events should raise variance for members of the opposition, while having no effect or even decreasing approval volatility among the president’s fellow partisans.
Finally, because independents lack strong partisan predispositions to support or oppose the president, we expect external developments to have little impact on the variance in their approval. Such developments, positive and negative, neither conflict with nor reinforce standing partisan predispositions. However, independents may have higher base levels of variance reflecting their greater levels of uncertainty in how to evaluate a president towards whom they feel no partisan attachment or resentment.Footnote 19
These individual-level dynamics may also drive changes in approval variance at the aggregate level. For example, if political conditions arise that make many individual partisans less stable in their response to the approval question, then variance in support for the president at the aggregate level may also increase. One poll may yield a high level of support for the president, yet because individual evaluations are unstable, a second poll may yield a considerably lower estimate, even in the absence of major political or economic changes. While our models of mean approval would predict no change in the overall level of support for the president, if the political environment has made many partisans more ambivalent and internally conflicted when they evaluate the president’s job performance, we may observe substantial variance around the predicted mean.
Modelling aggregate approval variance
As statistical methods have evolved, Converse’s basic observation that there is considerable instability in individual survey responses has spurred a growing body of research into how political and environmental factors influence both the probability with which survey respondents give a certain answer and the stability of their responses over time or repeated queries.Footnote 20 For example, Charles Franklin showed that a candidate’s campaign tactics influenced not only the average level of voters’ perceptions of his or her positions but also their certainty in their evaluations.Footnote 21 R. Michael Alvarez and John Brehm used heteroscedastic probit models to analyse the factors driving volatility in survey responses on a range of issues from affirmative action to abortion. And in a similar vein, Luke Keele and Jennifer Wolak demonstrated the importance of conflicting core values to explaining volatility in individuals’ party identification.Footnote 22
However, until recently, scholars have paid little attention to variance in aggregate-level opinion series, even when these fluctuations are of clear political importance, as with presidential approval. Although new research has brought an increasingly advanced array of methodological tools to bear on the venerable Gallup series, most analyses have treated non-constant variance as a statistical nuisance and simply employed heteroscedasticity-consistent standard errors.Footnote 23 However, two recent studies have sought not merely to correct for heteroscedasticity, but also to examine the factors driving these changes in the variance over time.Footnote 24 One of these studies, by Paul Gronke and John Brehm, examined changes in the volatility of support for the president across multiple presidencies; however, the results of their analysis are mixed and sensitive to specification.Footnote 25 Our theory suggests a possible explanation for the lack of consistent findings: the effects of many variables on approval variance should be in opposite directions for different partisan groups. Therefore, neglecting partisanship may obscure the countervailing influence of the same factors on different groups.
Because our theory suggests that each explanatory variable’s effect on the approval variance is conditional on respondents’ partisan predispositions to support or oppose the sitting president, the analysis examines three approval series from the beginning of Eisenhower’s term in 1953 to June 2006.Footnote 26 The first series tracks support for the president among his fellow partisans, the second among his partisan opponents and the third among independents.
To model the mean of presidential approval, we adopt a simple specification with standard explanatory variables common in the literature. For all three partisan series, the model for mean approval includes two dummy variables capturing positive and negative events drawn from Paul Brace and Barbara Hinckley, and from Gronke and Brehm, and updated by the authors; quarterly measures of the Index of Consumer Sentiment, capturing Americans’ perceptions of the health of the economy; a Watergate dummy variable; measures of the number of American combat casualties in Vietnam during the Johnson administration and in Iraq in the six months preceding each poll; and a measure of lagged approval.Footnote 27 To allow for different base levels of support across presidents due to personal factors not captured in the model, all specifications also include unreported presidential fixed effects.
Theoretical expectations are straightforward. Since John Mueller’s seminal study on the relationships between public opinion and the wars in Korea and Vietnam, most scholars have found that support for the ‘Commander in Chief’ declines as battlefield casualties mount.Footnote 28 Although there is some scholarly scepticism, we expect a similar pattern in Iraq.Footnote 29 Approval scholars have long documented that the Index of Consumer Sentiment (ICS), which measures both Americans’ prospective and retrospective evaluations of the economy, is a strong predictor of popular support for the president.Footnote 30 As the ICS increases, so, too, should support for the president. Finally, positive events should generate rallies in popular support behind the president, particularly from members of the opposition party, while negative events, including Watergate, should lead to dips in support.Footnote 31
We first examined the stationarity of all three partisan series. In each case, augmented Dickey–Fuller tests allow us to reject the null hypothesis of a unit root, p < 0.01.Footnote 32 After running diagnostic ordinary least squares (OLS) regressions, Breusch–Godfrey tests for all three series show strong evidence of autocorrelation; autocorrelation and partial autocorrelation functions suggest an MA(1) error process.Footnote 33 After modifying our mean model to account for the MA(1) error process, we observe no further evidence of autocorrelation.
We now turn to the model for the variance. In the same way as a standard linear regression model, our model for mean approval assumes:


But instead of assuming a constant variance (σ2 = α0), we employ a multiplicative heteroscedastic model and reparameterize the variance as a linear function of explanatory variables, allowing it to change over time:Footnote 34

However, as in Gronke and Brehm’s study, Lagrange multiplier tests showed evidence that the variance at time t is conditional on the variance at time t−1 for all three partisan series.Footnote 35 Accordingly, we modify our parameterization of the variance term to account for a first order autoregressive conditional heteroscedastic (ARCH) process.Footnote 36 As a result, the variance at a given moment is modelled as both a function of substantive variables of interest (Zt) and of the squared residuals from the previous period  :

To test our theory that the effect of an explanatory variable on variance will depend on whether it conflicts with or reinforces a group’s partisan predispositions, the variance model includes the positive and negative major event variables and Vietnam and Iraq combat casualties. However, approval volatility may also change systematically over the course of a president’s term. At the outset of a new administration, respondents have little information on which to base their evaluations of presidential job performance. As time passes, political learning may occur and the information available to respondents increases. If uncertainty can also produce approval variance, then volatility may be highest in the honeymoon period and decline over the course of an administration.Footnote 37 To account for this, we include a simple counter for the number of months elapsed in a presidential administration. Finally, the variance model also includes dummy variables for each president allowing the intercept to vary by administration. The complete variance equation is:

To reiterate, the expected effects of the event and casualties variables on approval variance are conditional on whether each conflicts with or reinforces a group’s partisan predispositions to support or oppose the president. For members of the president’s party, negative events and combat casualties in Vietnam and Iraq all provide alternative bases on which to evaluate the president’s job performance that conflict with these respondents’ natural inclination to support a president of their own party. Such developments should increase approval volatility about the estimated mean. Conversely, positive events reinforce existing partisan predispositions and consequently may decrease variance in support.
For the president’s partisan opponents, the expected effect of each variable on approval variance is essentially reversed. Positive events now clash with partisan and ideological predispositions to oppose a president from the other party. Negative events and mounting battle deaths, by contrast, reinforce these respondents’ inclination to oppose the president. As a result, the same factors that increased variance for the president’s co-partisans should decrease variance in his approval ratings among his partisan opponents.
For independents, who lack strong partisan predispositions one way or the other, there is little potential for conflict or reinforcement and hence we expect these factors to have no effect on their approval variance.
Results and discussion
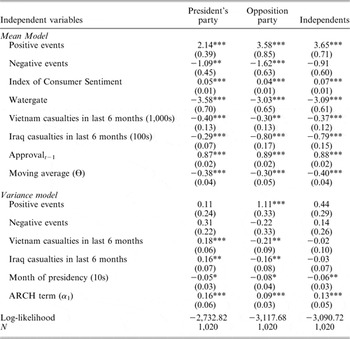
Table 1 summarizes the results for all three partisan approval series. The results for the models of mean approval are virtually identical across the partisan series and strongly accord with previous research. In each case, combat casualties in the last six months, negative events (albeit a statistically insignificant effect for independents) and the unfolding of the Watergate scandal all decreased support for the president’s job performance, while positive rally events and rising consumer sentiment increased popular support for the ‘Chief Executive’.
Factors Driving the Changes in the Mean and Variance of Presidential Approval Disaggregated by Party, 1953–2006

Note: All significance tests are two-tailed; all models report robust standard errors; all models of the mean and variance include fixed effects for each administration.
*p < 0.10; **p < 0.05; ***p < 0.01.
However, Table 1 makes plain that many of these same factors’ influence on the volatility of approval is not uniform, but rather depends critically on each group’s partisan affect towards the president. The first column examines the factors driving variance among the president’s co-partisans. While positive events, which should reinforce these respondents’ partisan predispositions to support the president, had no statistically significant effect on variance, the coefficient for negative events is positive and only narrowly fails to reach conventional levels of statistical significance. Because they pose conflicting considerations on which the party faithful may judge their standard bearer, negative events inject volatility into their support for the president. Thus, although the effect of negative events on mean approval is rather modest, the model results raise the possibility that negative events may further weaken the president by undermining the stability and predictability of his approval among his partisan base.
Also consistent with theoretical expectations, American combat casualties raise variance among the president’s partisan base. The coefficients for both Vietnam and Iraq casualties in the preceding six months are positive and strongly statistically significant.Footnote 38 Like other negative events, American battle deaths provide co-partisans with a highly salient alternative basis on which to evaluate the president that conflicts with their partisan predisposition to support him. In so doing, casualties pose a dual problem for the president: they both depress his mean level of support and increase the variance in his support among his partisan core.
The results also suggest that approval volatility decreases over the course of a presidential term, as the coefficient for the month of administration counter variable is both negative and statistically significant. And finally, the unreported presidential fixed effects show that Ford and Carter had the highest levels of approval volatility among their partisan allies while George W. Bush has enjoyed the most stable support from his partisan identifiers. This latter finding dovetails nicely with recent research emphasizing the remarkable stability of Bush’s support among his partisan base.Footnote 39
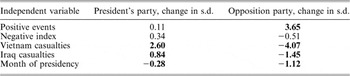
To explore the substantive impact of each variable on approval variance, the first column in Table 2 presents a series of first differences showing the change in the standard deviation of the distribution of 1,000 approval simulations from the model in column 1 of Table 1 produced by a shift of each independent variable from its 10th to 90th percentile (0 to 1 for dummy variables), while holding all other variables constant at their means or medians.Footnote 40 Although the negative event coefficient narrowly missed conventional levels of statistical significance, substantively its estimated effect on approval variance is considerable; each negative event increased the standard deviation of the president’s co-partisans’ support by more than a third of a point. Similarly, casualties greatly increased the variance in approval, as 10th to 90th percentile shifts in Vietnam and Iraq casualties boosted the standard deviation in co-partisan support for the president by 2.60 and 0.84 points respectively.
First Differences Illustrating Changes in the Standard Deviation of Approval Caused by 10th to 90th Percentile Shift in Each Variable

Note: Changes that are statistically significant, p < 0.10, are in bold.
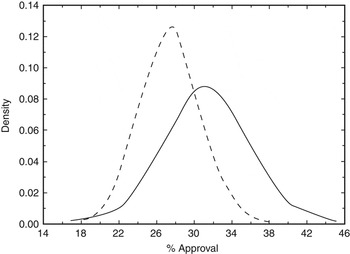
To illustrate the effects of such shifts on approval variance graphically, Figure 1 presents kernel density plots of two sets of simulations, varying the levels of American casualties suffered in Vietnam in the preceding six months from 0 to 8,100 (90th percentile) while holding all other variables constant at their means or medians. Each curve represents the expected distribution of answers Gallup may observe if it asked the approval question of 1,000 different groups in identical political and economic environments. The shapes of these distributions can be as politically important as their means for they provide important information about the predictability of support for the president in the current political context. Dispersed distributions suggest considerable variance around the model’s predicted mean, while distributions with lower standard deviations suggest that observed levels of support for the president rarely deviate wildly from the model’s predicted mean value.
Kernel density of simulated approval ratings among president’s co-partisans with varying levels of combat casualties in Vietnam in the preceding six months Notes: Solid line = No casualties. Dashed line = 8,100 casualties (90th percentile).

Among the president’s co-partisans, the effect of this shift in Vietnam casualties on mean approval is quite modest, approximately a 3 percentage point decline. However, the effect of this shift in casualties on the shape of the two distributions is dramatic. The simulations suggest that before war erupted in the jungles of Southeast Asia, Democrats’ support for the Johnson administration clustered tightly in the mid 70s. Only on rare occasions would we expect to observe a rating in the 60s and, absent an exogenous shock, the probability of observing a rating in the 50s is virtually nil. However, after full-fledged American intervention in Vietnam, high casualties inject considerable volatility and unpredictability into co-partisan support for the president. In these simulations, the expected value for Democratic support for Johnson remains around 70; however, simulated observations in the mid to low 60s are common and a number even dip into the 50s. Thus, perhaps the greatest effect of the Vietnam War on support for Johnson among his partisan base was not its direct impact on the mean level of approval he enjoyed but its dramatic effect on the volatility and predictability of Democratic support for his job performance around that mean.
The second column in Table 1 shows the starkly different effects of the very same explanatory factors on approval variance among opposition party identifiers. Whereas the model for approval among the president’s co-partisans showed no relationship between positive rally events and changes in variance, the coefficient for partisan opponents’ approval is strongly positive, substantively large and highly statistically significant. Thus, when viewed from a variance perspective, the long-studied rally effect takes on a new dimension. Consistent with Matthew Baum’s findings, the mean models show that in the immediate aftermath of a positive event the president’s partisan opponents, who by virtue of their much lower base levels of support have the greatest potential for movement, give presidents a strong boost in support as they rally around the flag.Footnote 41 However, this new evaluative frame is in direct conflict with their partisan predispositions to oppose the president. The presence of conflicting internal considerations and the resulting ambivalence should render this increase unstable; accordingly, at the aggregate level we observe higher levels of variance around the model’s slightly higher expected mean value.
Furthermore, a variance perspective dovetails with Richard Brody and Catherine Shapiro’s emphasis on elite discourse and the size and duration of a popular rally.Footnote 42 When opposition party elites criticize administration policy they trigger respondents’ pre-existing reasons for disapproving of the president and exacerbate the internal conflict within those who may have initially rallied behind the White House. Such a strategy may both decrease the mean level and inject more volatility into the president’s support, weakening his ability to leverage any sustained, consistent gains to his political advantage.
Also consistent with theoretical expectations, the coefficient for negative events, which had a strong positive impact on variance in the partisan identifiers’ approval series, is negative, albeit statistically insignificant, in the model of opposition party approval. If anything, negative events seem to reinforce opposition identifiers’ partisan predispositions not to support the sitting president.
In a similar vein, the effect of wartime casualties was dramatically different for opposition party identifiers from what it was for the president’s co-partisans. Whereas high levels of combat casualties in both the Vietnam and Iraq eras increased approval variance for the president’s partisan allies, they decreased variance in support among his partisan opponents. For this group of respondents, the negative frame provided by high war costs reinforces group partisan predispositions to oppose the president. Thus, for wartime presidents, casualties pack a double punch, slashing both the mean level of his support among the partisan opposition and decreasing the level of volatility around this lower mean.
Finally, for opposition partisans the results again suggest that approval volatility decreases over the course of a presidential administration. The logic here may mirror that of the ‘rally round the flag’ effect. During the honeymoon period, even partisan opponents may rally around the new president; yet, as time progresses, information about the new denizen of the Oval Office accumulates. As opposition partisans update their evaluation of the president’s job performance accordingly, approval volatility decreases.
With respect to the presidential intercept variables, the most interesting trend is that, on average, across administrations the base level of variance is considerably higher for the president’s partisan opponents than for his co-partisans. For members of the opposition party, the innate compulsion to rally round the president as the ‘Chief of State’, a national symbol and often the most visible and revered leader of the federal government, conflicts with their basic partisan incentives to oppose him.Footnote 43 As such, the base level of approval volatility is considerably higher for this group than for the president’s partisan supporters.
The second column of first differences in Table 2 examines the effect of each variable on approval variance among opposition party identifiers. Positive events dramatically increased the standard deviation of the error variance by over 3.5 points. Conversely, combat casualties in Vietnam and Iraq substantially depressed volatility in support for the president by approximately −4 and −1.5 points respectively. And finally, ceteris paribus, the standard deviation of opposition party approval was almost a full point lower in the fifth year of a presidential administration than in the first.
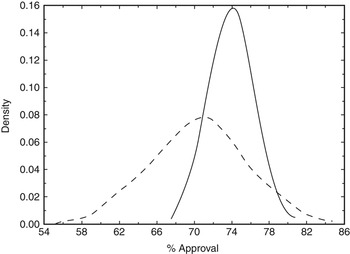
To illustrate the effects of rally events and wartime casualties on opposition party approval variance graphically, Figures 2 and 3 present kernel density plots of two sets of simulations adjusting the positive rally event and Iraq casualties variables while holding all other variables constant at their means or medians. The solid line curve in Figure 2 shows the distribution of simulated approval ratings estimated with no rally event, while the dashed line curve reveals the distribution of simulated approval ratings if a positive rally event occurred. While rally events do give presidents a small boost in approval on average, they also dramatically increase the unpredictability of opposition party identifiers’ approval of the president. The simulations suggest that in the wake of a rallying event repeated queries may show a much wider range of aggregate support for the president among his partisan opponents, sometimes considerably higher than the mean value and sometimes considerably lower. Thus, while presidents do enjoy a boost in support from rallying events, this benefit is tempered by increased volatility around the new expected mean value.
Kernel density of simulated approval ratings among president’s partisan opponents with and without a positive rally event Notes: Solid line = No rally event. Dashed line = Rally event.

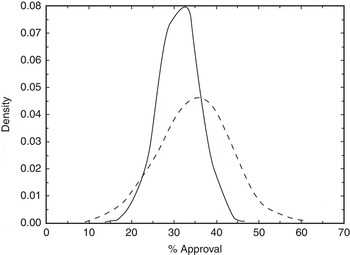
Kernel density of simulated approval ratings among president’s partisan opponents with varying levels of combat casualties in Iraq in the preceding six months Notes: Solid Line = No casualties. Dashed Line = 456 casualties (90th percentile).

Finally, Figure 3 focuses on the impact of Iraq War casualties on variance in Democratic support for President George W. Bush. The solid curve represents simulations of Democratic approval if there were no casualties in Iraq in the preceding six months, while the dashed curve summarizes simulations with 456 casualties (90th percentile) in otherwise identical political and economic circumstances. The two curves illustrate the double effect of Iraq on Democratic support for the president: casualties both decreased the expected mean level of Democratic support for Bush and made the density curve of simulated approval ratings more tightly clustered around this lowered mean. While observations of Democratic approval in the mid 30s and even 40s are common in the zero casualties simulations, they are virtually non-existent in the high casualties variant.
The third column in Table 1 replicates an identical model on approval among independents. Because independents do not possess strong partisan predispositions toward the president which positive or negative developments can conflict with or reinforce, our theory suggests these factors should have little influence on approval variance. The results largely accord with this theoretical expectation. None of the events or casualties coefficients in the variance model are statistically significant. The coefficient closest to statistical significance is for positive rally events, which suggests that rally events may have an effect on independents that mirrors their influence on opposition partisans. While positive events do produce a non-trivial boost in independent approval, this increase may come at the cost of increased volatility around this higher expected value. Such an effect would be consistent with the extensive scholarly literature warning about the transience and unpredictability of many ‘rally around the flag’ effects. The only significant effect is for the month of administration variable. This negative relationship suggests that approval volatility for independents, as for partisan opponents and co-partisans, may also decline over the course of a president’s tenure in office. And finally, the unreported fixed effects show that the average base level of variance for independents, as for partisan opponents, is significantly higher than for the president’s co-partisans.
Modelling individual-level approval volatility
The preceding models strongly suggest that approval variance at the aggregate level rises or falls in accordance with whether major domestic, international or military events are in conflict with or reinforce a group’s partisan predispositions toward the incumbent. Faced with adverse developments, such as high combat casualties or a negative world event, the president’s co-partisans have new, conflicting bases on which to judge him. We argued that these individuals are less stable in their support for the president, which in turn generates greater variance at the aggregate level. By contrast, these same developments confirm the president’s opponents in their negative partisan assessments. Such individuals, we hypothesize, should be quite steadfast in their opposition, decreasing approval variance. However, with aggregate-level data alone we cannot conclude that the hypothesized mechanisms at the individual level are driving the observed variance in the aggregate model.Footnote 44
To explore these theoretical micro-foundations directly, we shift from the aggregate to the individual level and investigate whether respondents with conflicting partisan, economic and foreign policy considerations are indeed more volatile in their approval choices over time. While there is a dearth of panel data on presidential approval, the 1980 National Election Study, which asked the approval question of the same panel of respondents three times over the course of the election season, does afford an important opportunity to examine whether respondents with conflicting considerations on which to judge the president’s job performance were more volatile than their peers. Because the United States was not at war in 1980, we cannot perform a direct test of the relationships between casualties and variance observed at the aggregate level. However, we are able to examine how individuals’ opinions on the two most important issues of the day – the state of the economy and the president’s handling of the hostage crisis in Iran – interacted with partisanship to drive approval instability from survey to survey.
In total, over a third of the panel respondents changed their approval answer at least once during the three polls, while almost 10 per cent of respondents did so twice.Footnote 45 Our theory suggests that the probability of switching approval choices is not uniform across all citizens. Rather, respondents whose views on the economy and Iran conflicted with their partisan predispositions to support or oppose Carter should be the most unstable in their approval choices and consequently the most likely to switch.Footnote 46 By contrast, respondents whose views on the state of the economy and Carter’s handling of the Iranian crisis reinforced their partisan predispositions should be least likely to exhibit volatility in their approval choices.
To measure respondents’ opinions on these two dimensions on which they might evaluate Carter’s job performance, we utilized two questions from the NES panel. The first question asked respondents whether their incomes had outpaced the cost of living in recent years of high inflation. For Democrats, a positive personal economic situation reinforces their partisan predispositions to support Jimmy Carter and should render their support more stable. By contrast, for Republicans a favourable personal economic outlook contrasts with their partisan incentives to oppose the sitting president. These Republicans should be more volatile in their approval choice and more susceptible to change over time than their partisan peers.
The second question investigated individuals’ evaluations of Carter’s handling of the single most important ongoing international development of 1980: the crisis in the Middle East precipitated by Iranian revolutionaries’ seizure of hostages from the American Embassy in November 1979. Again, the effect of a respondent’s support for Carter’s handling of the Iranian crisis on his or her job approval volatility should be conditional on partisanship. For Democrats, support for Carter’s Iran policy reinforces partisan incentives to rally behind the president and should decrease volatility. Conversely, Republicans who supported Carter’s handling of the Iran crisis possess conflicting bases on which to evaluate him and the result should be greater volatility in their approval responses across polls.
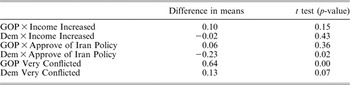
Table 3 affords a preliminary analysis of the effect of holding an evaluation of Carter on each of these two dimensions that either reinforced or conflicted with respondents’ partisan predispositions on the average number of switches within that group. The first column reports the difference in means between respondents who either were gaining economically or approved of Carter’s handling of Iran and those who did not, disaggregated by partisanship. The second column presents a measure of statistical significance for each difference in means between the two groups.
Difference in Average Number of Approval Switches Between Conflicted and Non-Conflicted Partisans

Note: GOP = Republican.
Even this simple bivariate analysis supports many of our theoretical expectations. Republicans whose personal economic fortunes and evaluation of Carter’s handling of the Iranian hostage crisis conflicted with their partisan predispositions switched their approval choice more frequently across surveys than did their partisan peers. Conversely, Democrats who enjoyed rising incomes and who approved of Carter’s dealings with Iran switched their approval choices fewer times than did their fellow Democrats. The last two rows in Table 3 push the analysis a step further and investigate whether individuals with conflicting opinions and partisan predispositions on both dimensions, whom we label ‘very conflicted’, switched their approval choices most frequently across surveys. Among Republicans, these individuals both approve of Carter’s Middle East policy and enjoy rising incomes. The opposite marks conflicted Democrats. Theoretically, we expect such jarring incongruities between economic circumstances, opinions on foreign affairs and partisanship to produce heightened response instability. And the differences in means tests strongly support this hypothesis. Very conflicted Republicans switched over 0.6 more times on average than other Republicans, while very conflicted Democrats switched on average 0.13 more times than other Democrats across the three surveys.
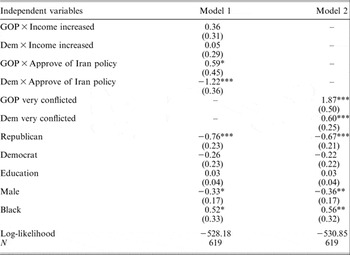
As a further test, the ordered logit models in Table 4 examine the effect of being in each of these six groups on approval switching while controlling for a number of other factors including respondent partisanship, gender, race and education levels.Footnote 47 The first model examines the effect of holding economic and foreign policy views conflicting with partisan predispositions separately. The second model examines whether individuals who held views conflicting with their partisanship on both dimensions were especially likely to shift their opinion of President Carter.
Ordered Logit Models of Approval Switches Across Three 1980 NES Surveys

Note: All significance tests are one-tailed; all models report robust standard errors. GOP = Republican.
*p < 0.10; **p < 0.05; ***p < 0.01.
Beginning with the economy, the coefficient for Republicans whose incomes had outpaced inflation is indeed positive as expected but misses conventional levels of statistical significance. However, the size of the estimated effect is substantively quite large. Simulations suggest that Republicans who had enjoyed personal economic success during Carter’s tenure were 10 per cent more likely to switch their approval choices at least once over multiple surveys than were their partisan peers. By contrast, the coefficient for strong personal economic fortunes for Democrats is substantively trivial.
With respect to individuals’ views on Iran, we again find that internal conflict leads to greater approval instability, while reinforcing foreign policy and partisan considerations decrease variance. Republicans who supported Carter’s handling of the hostage crisis were considerably more conflicted and unstable in their approval judgements than were their fellow partisans. Simulations suggest that these Republicans were 15 per cent more likely to switch their approval at least once over the three surveys than were their peers who opposed Carter’s stance towards Iran. By contrast, the effect for Democrats of approving of the administration’s Iran policy on approval volatility was diametrically opposite. For these Democrats, the president’s foreign policy actions reinforced their partisan predispositions to support him, and their likelihood of switching their approval responses one or more times decreased by 25 per cent accordingly.
The second model in Table 4 examines whether ‘very conflicted’ respondents, whose views on both dimensions conflicted with their partisan predisposition, were particularly likely to switch their approval choices across surveys. For both partisan groups, coefficient estimates, as seen in column 2, are strong and highly significant. These effects are also substantively impressive. Simulations suggest that ‘very conflicted’ Republicans were more than twice as likely to switch their evaluations of Carter at least once than were their co-partisans, while ‘very conflicted’ Democrats were 14 per cent more likely to change their approval answer one or more times than their peers. Consistent with both theory and aggregate data analysis, collision between partisanship and ‘the real world’ breeds response instability.
Control variables perform similarly across models. We find strong evidence that Republicans were considerably less volatile across the three 1980 approval surveys than were Democrats. While this result is in conflict with our findings at the aggregate level, which suggested that on average across fifty years of presidential history approval variance is lowest among the president’s co-partisans, the reasons for the divergence are clear. Democrats in 1980 were hopelessly torn between their partisan loyalties to Carter and external realities undermining Carter’s presidency: stagflation, the energy crunch, Iran, and the Soviet invasion of Afghanistan first and foremost among them. All of these same developments, by contrast, reinforced Republicans’ predispositions to oppose the incumbent president. As a result, the considerably lower levels of Republican volatility accord closely with theoretical predictions, if not with the aggregate level results for all presidencies.
Finally, the models provide no evidence that volatility varies with a respondent’s educational attainment or with other measures of political information estimated in alternative specifications. The models do find some differences along demographic lines and suggest that African Americans were particularly volatile in their support for Carter, while men were less volatile on average in their approval choices than women.
In sum, results from these individual level analyses of approval volatility across the three 1980 NES panel approval queries strongly accord with theoretical expectations. Republicans whose personal economic fortunes and judgement of the president’s performance in the Iran hostage crisis conflicted with their partisan predispositions to oppose the president were more volatile in their approval choices than their peers. Conversely, Democrats who supported Carter’s Iran policies were considerably less volatile in their approval responses than were other Democrats who opposed the president’s actions. Finally, Democrats and Republicans whose personal finances and foreign policy views both conflicted with their partisan predispositions were the most unstable in their approval decisions.
Conclusion
Public opinion scholars have long focused almost exclusively on changes in the mean of a time series at the expense of a systematic analysis of the factors driving changes in its variance. This omission is particularly striking in the expansive literature on public support for the president, given the clear political importance of approval volatility.
Recently, a few studies have begun to investigate changes in approval volatility, yet they have largely failed to explore how partisanship moderates many factors’ influence on variance. The preceding analysis of approval volatility at both the individual and aggregate levels demonstrated the critical importance of alternative frames on which to evaluate the president that either conflict with or reinforce respondents’ partisan predispositions. For the president’s co-partisans, adverse developments, such as negative events and combat casualties, that conflict with their partisan attachments to the president render their opinions less stable and consequently inject greater uncertainty around the model’s predictions for their aggregate level of support. Conversely, positive evaluative frames that reinforce partisan predispositions either have no effect or even decrease approval variance. For opposition party identifiers, the same negative developments decrease variance, while positive events increase the volatility of their support.
Future research should continue to examine the forces driving volatility in presidential approval at both the aggregate and individual levels, as well as in popular attitudes to other major issues of political import. For example, changes in the volatility of support for withdrawing American forces in Iraq or for various other aspects of the president’s foreign and domestic programmes may be as substantively and politically important as changes in the mean.