1. Introduction
The quality deterioration in common pool resources (CPRs) due to production processes has been well documented in the textile industry (Ranganathan et al., Reference Ranganathan, Jeyapaul and Sharma2007; Arumugam and Elangovan, Reference Arumugam and Elangovan2009; Kant, Reference Kant2012). Following housing, transportation, travel and food, the clothing industry is most responsible for environmental degradation (European Environment, Reference European Environment2014) and water waste is a byproduct of this industry. As reported by the World Bank in 2019, coloring and dyeing processes account for 17–20 per cent of modern water contamination worldwide (Kant, Reference Kant2012). Water used by the textile industry is untreated most of the times and contains harmful toxic substances like mercury, lead and arsenic, which could pose a threat to aquatic and human life (Sultana et al., Reference Sultana, Islam, Saha and Al-Mansur1970; Awomeso et al., Reference Awomeso, Taiwo, Gbadebo and Adenowo2010).Footnote 1
Textile companies usually draw water from a nearby CPR for dyeing and finishing processes. After using this water, they are often required to treat the toxic water before letting it back into the river or lake. For example, textile industries in Bangladesh fall under the category of Red Industries and, according to the “Bangladesh Environment Conservation Act” and “Environmental Conservation Rules”, they have to treat water following the standard of national discharge quality (as reported by Sharif and Hannan, Reference Sharif and Hannan1999; Huq, Reference Huq2003).
Considering the above issues, we study a CPR game in which firms’ appropriations affect the future quality of the resource; however, firms can also choose to exert abatement efforts that improve the quality of the CPR. We aim to understand how appropriations that deteriorate quality affect firms’ strategic behavior when exploiting a CPR. We pose the following questions: is overexploitation emphasized by a future loss of quality of the CPR? Can abatement efforts reduce the overexploitation of the CPR?
The tragedy of the commons has been extensively analyzed; since Ostrom (Reference Ostrom1990) several papers have examined the strategic behavior of agents exploiting a CPR and how their appropriations exacerbate overexploitation (McKean, Reference McKean1982; Baland and Platteau, Reference Baland and Platteau1996; Brunckhorst and Coop, Reference Brunckhorst and Coop2003). This literature has been expanded by considering the role of uncertainty in the exploitation of a CPR.Footnote 2 For a comprehensive discussion about the strategic use of CPRs, see Espinola-Arredondo and Muñoz-García (Reference Espinola-Arredondo and Muñoz-García2021). These studies, however, mainly focus on the total stock of the resource, ignoring how appropriations affect the quality of the CPR.
Zeitouni and Dinar (Reference Zeitouni and Dinar1997) study water consumption considering the ground water quality-quantity management problem using a dynamic optimal control model. Unlike our paper, they do not examine intertemporal externalities or abatement efforts. Roseta-Palma (Reference Roseta-Palma2003) presents an alternative model for the joint quality-quantity management of a resource by examining the dynamic interaction between the stock of water quantity and the stock measure of water quality. However, she does not consider costly abatement efforts. Erdlenbruch et al. (Reference Erdlenbruch, Tidball and Zaccour2014) study the strategic interaction between farmers and a regulating water agency to determine the optimal level of groundwater quantity and quality extractions. Martín-Herrán and Rubio (Reference Martín-Herrán and Rubio2023) examine an oligopoly framework considering pollution abatement and the correlation between environmental damages and pollution stock. However, both papers focus on environmental policy and adopt a hierarchical relationship between a regulator and several agents leading to a Stackelberg framework. Our model, in contrast, focuses on the strategic interaction between firms that exploit the same CPR, explicitly characterizing the effects of appropriations on the next period extraction. We contribute to this literature by identifying contexts in which abatement efforts mitigate the overexploitation of the CPR.
In a recent study, Colombo and Labrecciosa (Reference Colombo and Labrecciosa2022) examine how an increase in the quality of a renewable CPR affects stationary stock, equilibrium strategies and welfare. They find that social welfare decreases as the quality of the resource improves. However, they consider that a share of the resource stock is affected by quality deterioration. In contrast, we allow for an entire deterioration of the resource due to the production process and consider abatement efforts, that is, the possibility of restoring the initial quality of the CPR. In addition, appropriations of the CPR are used as an input in the production process as opposed to a finished good.
We examine a two-stage game where, in the first stage, firms simultaneously decide their appropriation levels and, in the second stage, considering that first-period appropriations affect the quality of the CPR, they again choose their appropriations. We re-examine the two-stage game by allowing firms to abate in the first period and identify socially optimal appropriation levels, comparing them with the benchmark case. We find that first-period appropriations increase when the quality rises. That is, better quality of the CPR induces firms to overuse the resource. We also observe that first-period appropriations with abatement decrease when the regeneration rate increases. This result implies that, as the resource becomes more abundant, firms appropriate less in the first period. However, an improvement in the quality of the resource induces abating firms to increase their appropriations in the first period. This finding highlights the importance of considering interactions between quality and regeneration rate. Previous literature also examining a two-period model states that first-period appropriations increase in regeneration rate (Espinola-Arredondo and Muñoz-García, Reference Espinola-Arredondo and Muñoz-García2021), however, our results indicate that this is not the case when the quality of the CPR deteriorates. In addition, first-period appropriation levels with abatement are higher than without abatement. Therefore, cleaning the resource triggers more appropriation if it is abundant; this result is exacerbated by a less expensive abatement effort.
We also show that first-period socially optimal appropriations are lower than appropriations with and without abatement, indicating an overuse of the CPR. This finding is emphasized when the quality of the stock, regeneration rate, and abatement costs increase. Hence, a more abundant resource and a more expensive cleaning process induce overexploitation and calls for comprehensive management policies. The difference between first-period appropriations with abatement and socially optimum appropriations shrinks when the quality of the resource is poor. Hence, abatement efforts are important to fight the overuse of the resource and policy makers should carefully evaluate in which contexts they need to support these activities to protect the CPR. In order to identify in which cases abatement induces overexploitation or underexploitation of the resource, we develop a ranking. We find that first-period appropriation levels without abatement are higher than with abatement, followed by socially optimum levels. This result holds if the quality of the resource is good. Therefore, the tragedy of the commons is more likely to arise in healthy CPRs. However, this ranking is reverted (indicating an underuse of the CPR) if the regeneration rate and quality are sufficiently low.
The remainder of this paper is organized as follows. Section 2 develops the model. Section 3 discusses the equilibrium results without abatement, with abatement and at the social optimum. Section 4 concludes.
2. Model
We examine a two-stage complete information game between two symmetric firms. Consider firms $i$ and $j$
 competing for the use of a CPR (i.e., water) which is an input in their production process. Each firm appropriates an amount $w_k$
 where $k = \{i,\, j\}$
 and the total stock of the resource is denoted by $\omega$
 which is strictly positive. Firms also use other inputs, $x_k$
 , which are acquired at a cost $c$
 . The total output is a function of $w_k$
 and $x_k$
 in period $t$
 , that is, $f(w_{kt},\, x_{kt}) = \sqrt {w_{kt}x_{kt}}$
 where $t = 1,\,2$
 .Footnote 3
The intrinsic quality of the CPR is denoted by $\gamma$ , where $0<\gamma \leq 1$
 . If $\gamma$
 is close to 1, the quality of the CPR is high, but a value close to 0 indicates low quality. For compactness, we consider that the total quality of the stock is represented by $\theta = \gamma \omega$
 . Therefore, the interaction between the total stock, $\omega$
 , and the quality of the CPR, $\gamma$
 , represents two cases: (i) the total stock is unaffected by deterioration, $\gamma$
 =1, thus preserving its high quality, or (ii) a positive deterioration, $\gamma >0$
 , affects the stock and, hence, its total quality decreases. In addition, every firm faces an extraction cost in period 1 of ${w_{k1}(w_{i1}+w_{j1})}/{\theta }$
 , where $w_{i1}$
 and $w_{j1}$
 denote the amount of water that firms $i$
 and $j$
 appropriate from the CPR in period 1, respectively. The extraction cost decreases when the quality improves as less pollution facilitates extraction, but it increases in the other firm's appropriation, representing a higher cost from using a depleted resource.Footnote 4
Every firm chooses an abatement effort, $z_{k1}$ , to clean the resource in period 1, which improves its quality in the following period. Abatement cost is ${\beta z_{k1}^2}/{2}$
 , where $\beta > 0$
 represents the per unit abatement cost and and it increases in the abatement effort. Therefore, each firm $k$
 has the following first-period profit:

In the second period, firms continue to use the resource, appropriating an amount $w_{k2}$ and acquiring other inputs $x_{k2}$
 . The CPR can regenerate at a rate $r$
 , which is strictly positive. If $r<1$
 , the regeneration rate is low which can be interpreted as drought. However, if $r>1$
 , the rate is high, representing a context of abundant rain which increases the stock, and when $r =1$
 , the CPR fully regenerates. In addition, the quality of the stock deteriorates at a rate $d$
 , where $d>0$
 due to the extraction process in period 1. High values of $d$
 represent a more severe deterioration.Footnote 5 Each firm faces the same extraction cost of ${w_{k2}(w_{i2}+w_{j2})}/{r(\theta -d w_{{i1}}(1-z_{{i1}})-d w_{{j1}}(1-z_{{j1}}))}$
 , where low quality increases the extraction cost in the second period.Footnote 6 This cost function accounts for the effect of deterioration produced by first-period extraction on second-period costs. The regeneration rate interacts with the quality of the CPR, for instance, if the quality is high but the regeneration rate is low ($r$
 tends to zero), the extraction cost becomes higher than when the CPR fully regenerates. Lastly, a higher deterioration produced by the extraction process increases the extraction cost. However, firms can reduce the deterioration of the stock by choosing a higher abatement effort in period 1.Footnote 7 Thus, the second-period profit for each firm $k$
 is

The structure of the game is as follows: ($i$ ) in period 1 each firm independently and simultaneously decides input levels $w_{i1}$
 and $w_{j1}$
 , other inputs $x_{i1}$
 and $x_{j1}$
 , and how much to abate $z_{i1}$
 and $z_{j1}$
 ; ($ii$
 ) in period 2, each firm chooses input levels $(w_{i2},\, w_{j2},\, x_{i2},\, x_{j2})$
 facing an intertemporal externality. We first examine a benchmark case in which firms do not abate (hence, decisions variables are $w_{k1},\, w_{k2},\, x_{k1}$
 and $x_{k2}$
 , where $k=\{i,\,j\}$
 ), and compare our results to a context in which they abate in period 1 (decision variables also include $z_{k1}$
 ).
3. Equilibrium results
In this section, we first examine the equilibrium results when firms do not abate, and then study the case in which they do abate, and present comparisons between appropriations without and with abatement. Finally, we identify the socially optimal appropriations and compare them with the results without and with abatement.
3.1. Without abatement
Operating by backward induction and taking first-order conditions with respect to $w_{k2}$ and $x_{k2}$
 where $k = \{i,\, j \}$
 , we obtain the following best response functions:

and

where $k \neq l$ . As expected, the last term of firm $k$
 's best-response function indicates that water extraction activities are strategic substitutes. Therefore, if firm $j$
 exploits the CPR more intensively, there is less of the resource available for firm $i$
 . We next present Lemma 1 which summarizes our findings in the second-period. All proofs are relegated to the online appendix.
Lemma 1 Second-period appropriation and input levels for each firm $k$ , where $k=\{i,\,j\}$
 , are

and

which are positive if $d< {\theta }/{w_{i1}+w_{j1}}$ .
Second-period appropriations are increasing in $\theta$ . That is, an increase in the quality of the CPR increases appropriations. Similarly, a higher regeneration rate induces more appropriations. However, it depends on a sufficiently low CPR deterioration, i.e., $d < {\theta }/{w_{i1} + w_{j1}}$
 . Finally, second-period appropriations decrease in first-period appropriations of both firms.
We next examine first-period equilibrium results. Firm $k$ 's aggregate profits are $\pi _{k1} + \delta \pi _{k2}$
 , where $\delta \in [0,\,1]$
 is the discount rate. In addition, profits in both periods are affected by firms’ appropriations in period 1, which is often observed in CPR games. Hence, firm $k$
 's aggregate profit becomes

Taking first-order conditions with respect to $w_{k1}$ and $x_{k1}$
 , we obtain the following best response functions:

Firm $k$ 's appropriation is decreasing in $\delta$
 , indicating that if firm $k$
 assigns a higher weight to second-period profits, it extracts less in period 1. It is also decreasing in quality deterioration $d$
 . In addition, $x_{k1}$
 decreases in $c$
 , that is, an increase in the price of other inputs decreases the demand for $x_{k1}$
 . We next discuss the equilibrium results of our benchmark case.
Proposition 1 The equilibrium appropriations without abatement and input levels for each firm $k,$ where $k = \{i,\, j\},$
 in the first and second period are:


which are positive if $r \in [{36 (6c-d)}/{d^2 \delta },\, {36 c }/{\delta d}]$ and $c < {d}/{3}$
 .
Firms appropriate positive amounts if the regeneration rate is sufficiently high. Note that a very low regeneration rate, i.e., $r < {36 (6c-d)}/{d^2 \delta }$ , does not allow firms to use the CPR. In addition, first-period appropriations are increasing in the quality of the stock, $\theta$
 (see online appendix). That is, firms appropriate more in period 1 when the quality of the CPR improves. However, first-period appropriations are decreasing in the regeneration rate. Intuitively, if the resource becomes more abundant, firms reduce their use of the CPR in period 1. That is, anticipating a lower scarcity, firms find it less necessary to overuse the resource in period 1, thus reducing second-period extraction costs and increasing second-period appropriations. In addition, if deterioration is nil, $d=0$
 , first-period appropriations are unaffected by the regeneration rate.Footnote 8 Lastly, first-period appropriations are decreasing in the discount rate and quality deterioration. Thus, if firms assign a higher weight to second-period profits, the intertemporal externality becomes more relevant and consequently they appropriate less in the first period. Quality deterioration amplifies this externality which ultimately induces a lower first-period appropriation.
We also observe that second-period appropriations increase in the quality of the stock of the CPR. However, this result holds if the quality deterioration is sufficiently low. A higher deterioration degrades the quality of the stock which induces firms to appropriate less in the following period. Regarding the discount rate, it has an opposite effect than that discussed for first-period appropriations. In this context an increase in $\delta$ induces higher appropriations in the second period. In addition, if the regeneration rate increases, second-period appropriations increase for all admissible parameter values. In addition, second-period appropriations are increasing in the cost of other inputs. However, this result holds if the deterioration of the CPR is sufficiently low (see online appendix).
3.2. With abatement
We next examine the case in which firms are able to abate pollution. Using a process similar to the one used in the previous section, we solve the game by backward induction and focus on second-period profits. Taking first-order conditions with respect to $w_{k2}$ and $x_{k2}$
 , we obtain results similar to those in Lemma 1, since firms do not abate in period 2. Hence, we focus on first-period profits allowing for abatement. Firm $k$
 's aggregate profit is

where the first term in brackets represents first-period profits, including the abatement cost, and the second term is the discounted second-period profit. Taking first-order conditions, we obtain the following best response functions for every firm $k$ :

where $k \neq l$ . Compared to the setting without abatement, the best response function $w_{k1}(w_{l1})$
 is now affected by abatement cost, $\beta$
 . In addition, the abatement effort is increasing in first-period water appropriations and it becomes zero when deterioration is absent, $d = 0$
 . This indicates that a more intensive use of the CPR requires a higher abatement effort. We next examine the equilibrium results with abatement.
Proposition 2 The equilibrium appropriations with abatement and input levels for each firm $k,$ where $k=\{i,\,j\},$
 in the first and second period are


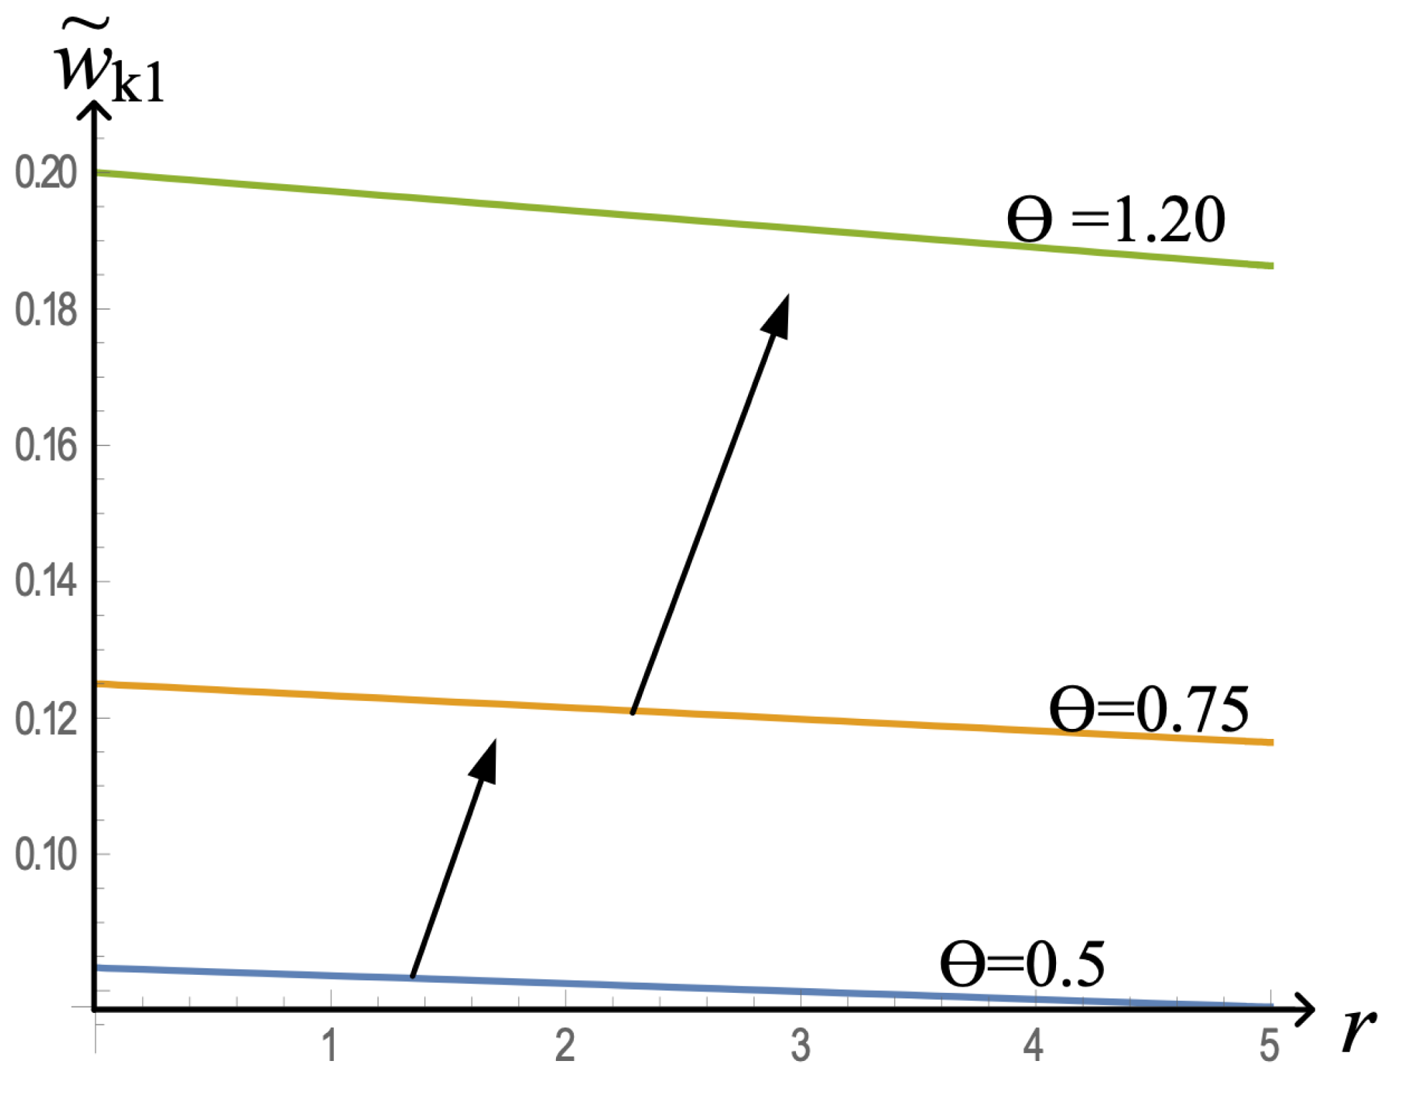
Similarly to in Proposition 1, first-period appropriations increase in the quality of the stock for all admissible values of $r$ . Figure 1 depicts firm $k$
 's first-period appropriations with respect to the regeneration rate.Footnote 9 We observe that appropriations decrease when the regeneration rate increases (downward sloping curve in figure 1). However, as the quality of the CPR, $\theta$
 , improves (worsens), first-period appropriations shift upward (downward, respectively). This indicates that, irrespective of other parameters, better inherent quality of the CPR induces more appropriations.
First-period appropriation when $\theta$ changes.

More generally, first-period appropriations are decreasing in the regeneration rate for all admissible values of $r$ . Intuitively, higher regeneration rates induce firms to appropriate less in the first period since the resource becomes less scarce. Additionally, if the abatement cost, $\beta$
 , increases, firms decrease their first-period appropriations for all admissible values of $r$
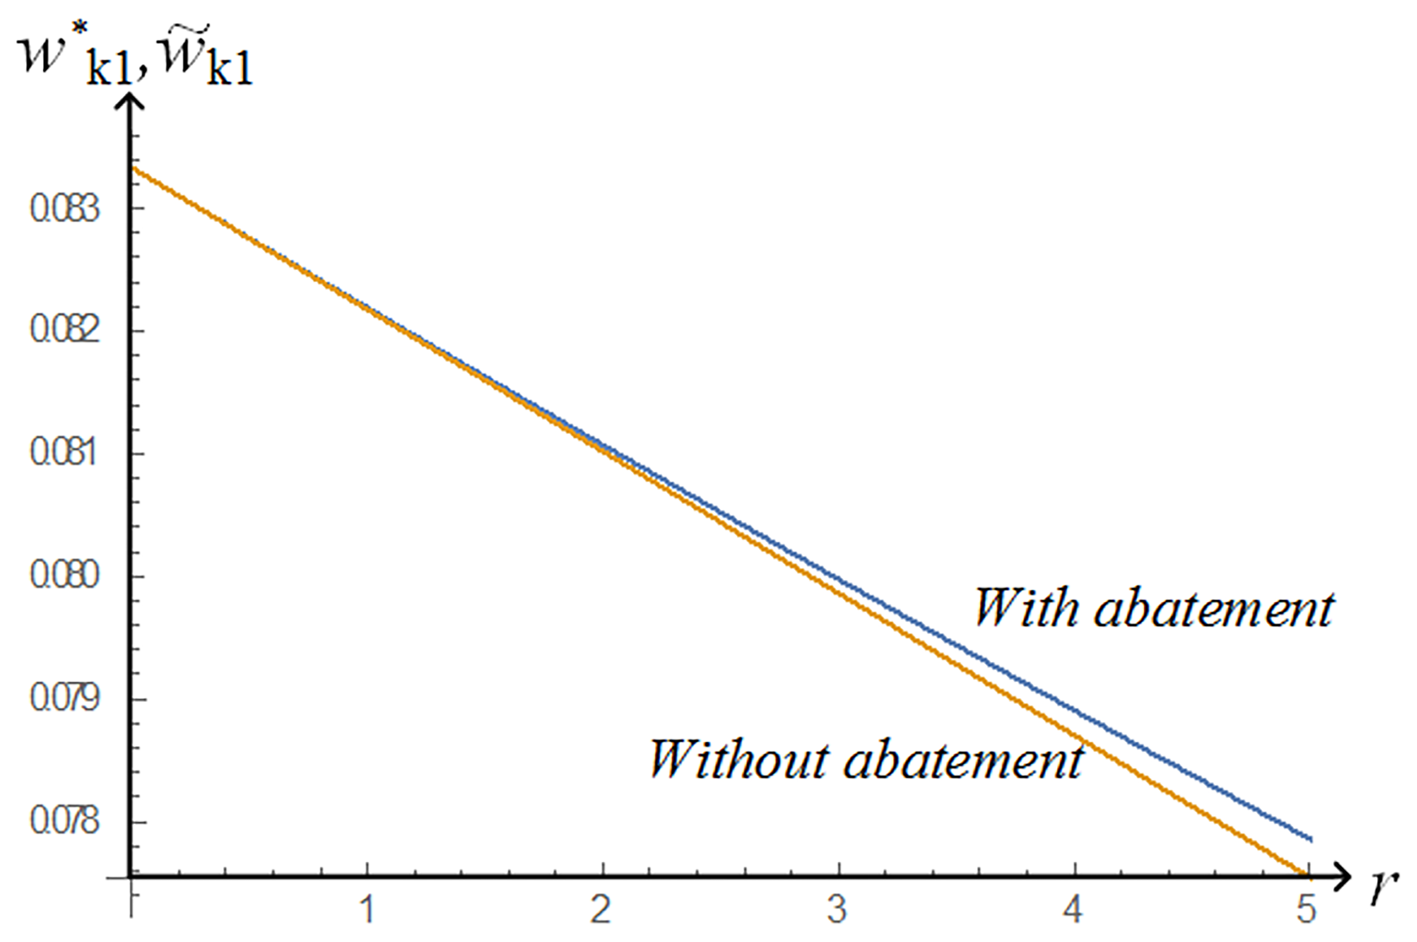
 . Similarly, abatement efforts decrease when the abatement cost increases. (For more details, see the proof of Proposition 2 in the online appendix.) We next compare first-period appropriations with and without abatement (see figure 2).
First-period appropriations with and without abatement.

Figure 1 shows that firm $k$ appropriates more resources when it abates than otherwise. In both cases, firms reduce their first-period appropriations when the regeneration rate increases. Therefore, the tragedy of the commons is ameliorated by the abundance of the resource. However, abatement induces firms to appropriate more when the resource regenerates more rapidly than otherwise.
3.2.1. Equilibrium comparisons without and with abatement
Lemma 2 provides a more general comparison between appropriations without and with abatement.
Lemma 2 First-period equilibrium appropriations without abatement, $w_{k1}^*$ , are higher than with abatement, $\tilde {w}_{k1}$
 , if

is positive, which holds if $r<{36c}/{\delta d} \equiv r^*$ .
Abatement imposes an additional cost on firms in period 1. As a result, firms appropriate less compared to the case when they do not abate if the regeneration rate is sufficiently low. The regeneration rate improves the quality of the resource in the next period, hence, if firms anticipate that the CPR's regeneration rate is low, they need to exert a higher abatement effort to reduce the negative effect of deterioration. As a consequence, firms’ total cost (production and abatement) increases, inducing them to appropriate less. The condition on the regeneration rate becomes less demanding when the quality deterioration decreases, since it requires a lower abatement effort, allowing the abating firm to appropriate more.
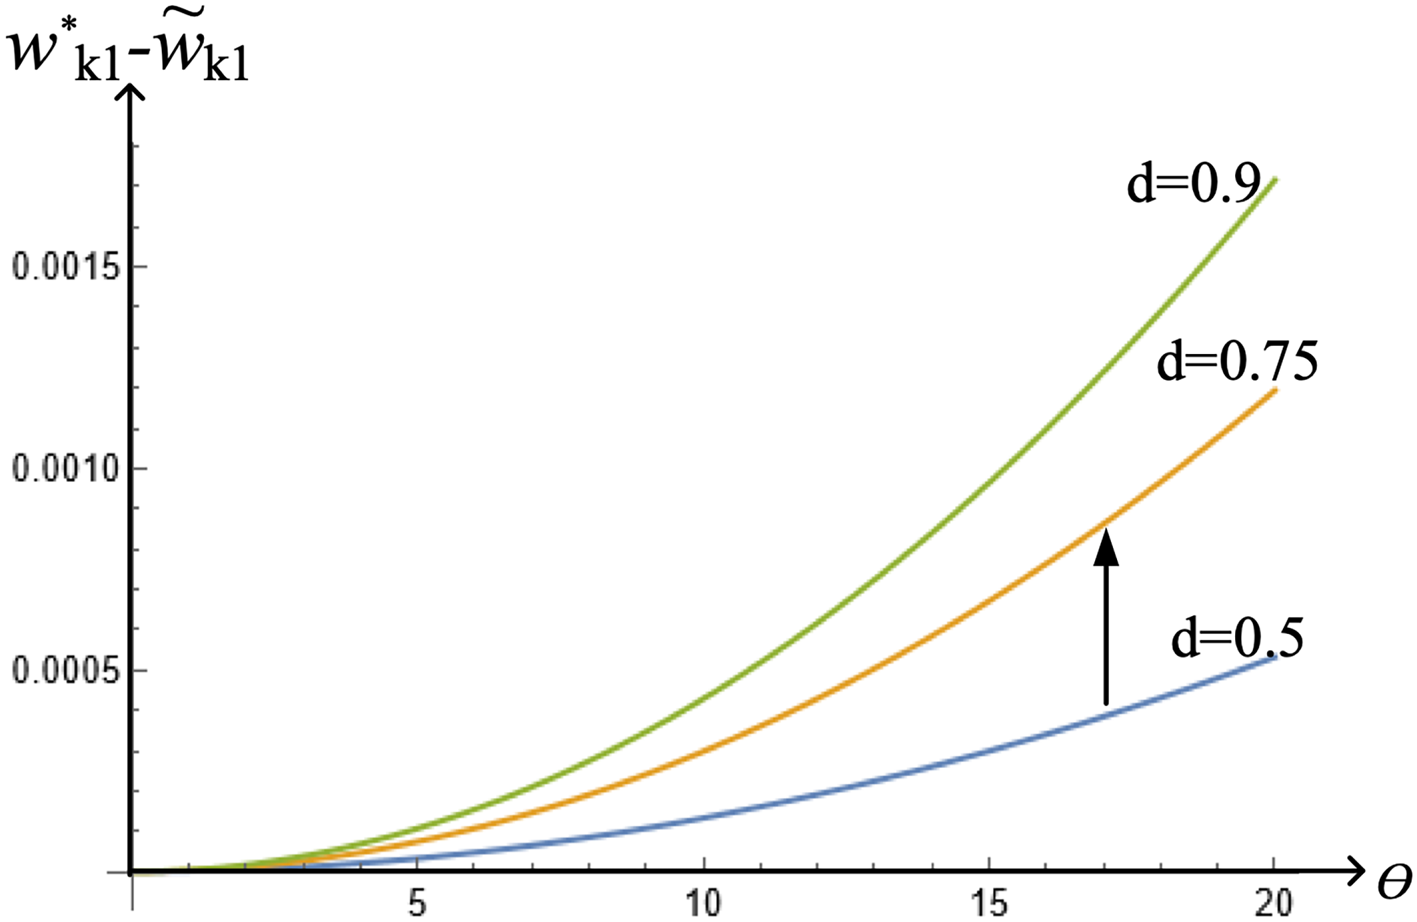
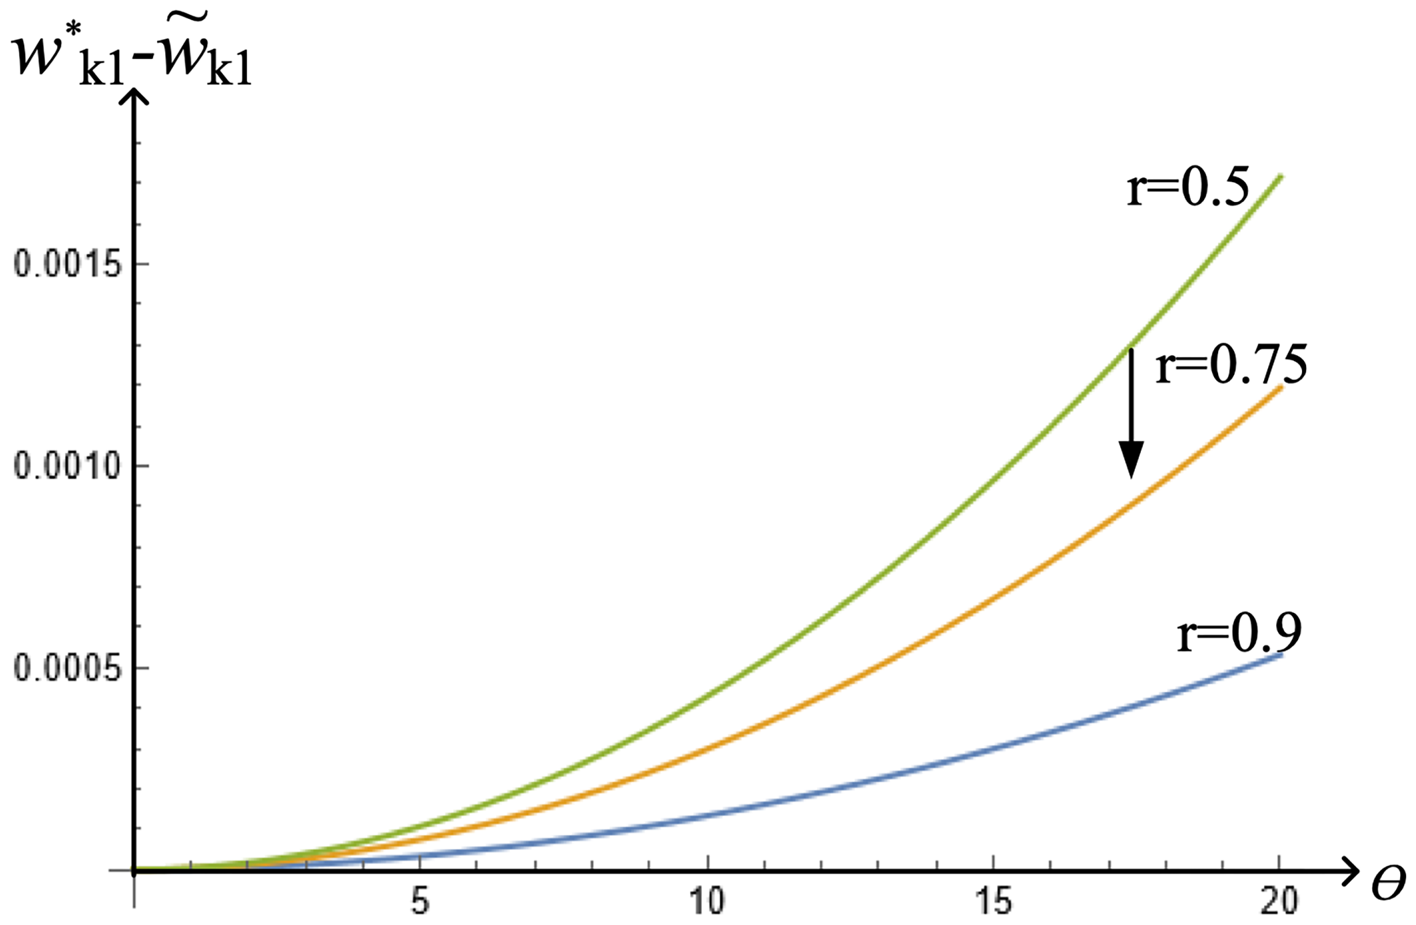
We next examine how the difference in Lemma 2, $w_{k1}^* - \tilde {w}_{k1}$ , is affected by changes in the deterioration rate $d$
 (see figure 3) and the regeneration rate $r$
 (see figure 4).
Changes in the deterioration rate, $d$ .

Changes in the regeneration rate, $r$ .

Figure 3 shows that an increase in $d$ expands the difference between appropriations. This is an interesting result, since a higher deterioration expands the difference between appropriations without and with abatement. We observe that an increase in $d$
 affects both firms’ first-period appropriations; however, an abating firm is more affected (given the additional cost), ultimately reducing its appropriations more rapidly and thus expanding the difference between them. In the case of regeneration rate, $r$
 , we observe that the difference shrinks when $r$
 increases (see figure 4). However, in this context the abating firm is more impacted than otherwise. As the regeneration rate increases, firms reduce their abatement effort in period 1. A higher $r$
 reduces the abatement cost, allowing them to appropriate more, getting closer to those that do not abate.
We next compare the difference between second-period appropriations with and without abatement.
Lemma 3 Second-period equilibrium appropriations with abatement, $\tilde {w}_{k2},$ are higher than without abatement, $w_{k2}^*,$
 if

is positive, which holds if $r < {r^*}/{2}$ .
Abatement effort in period 1 internalizes the production externality and enables firms to appropriate more in the second period. We next observe how the difference between second-period appropriations with and without abatement, $\tilde {w}_{k2} - w_{k2}^*$ , is affected by changes in the discount rate $\delta$
 and abatement cost $\beta$
 .
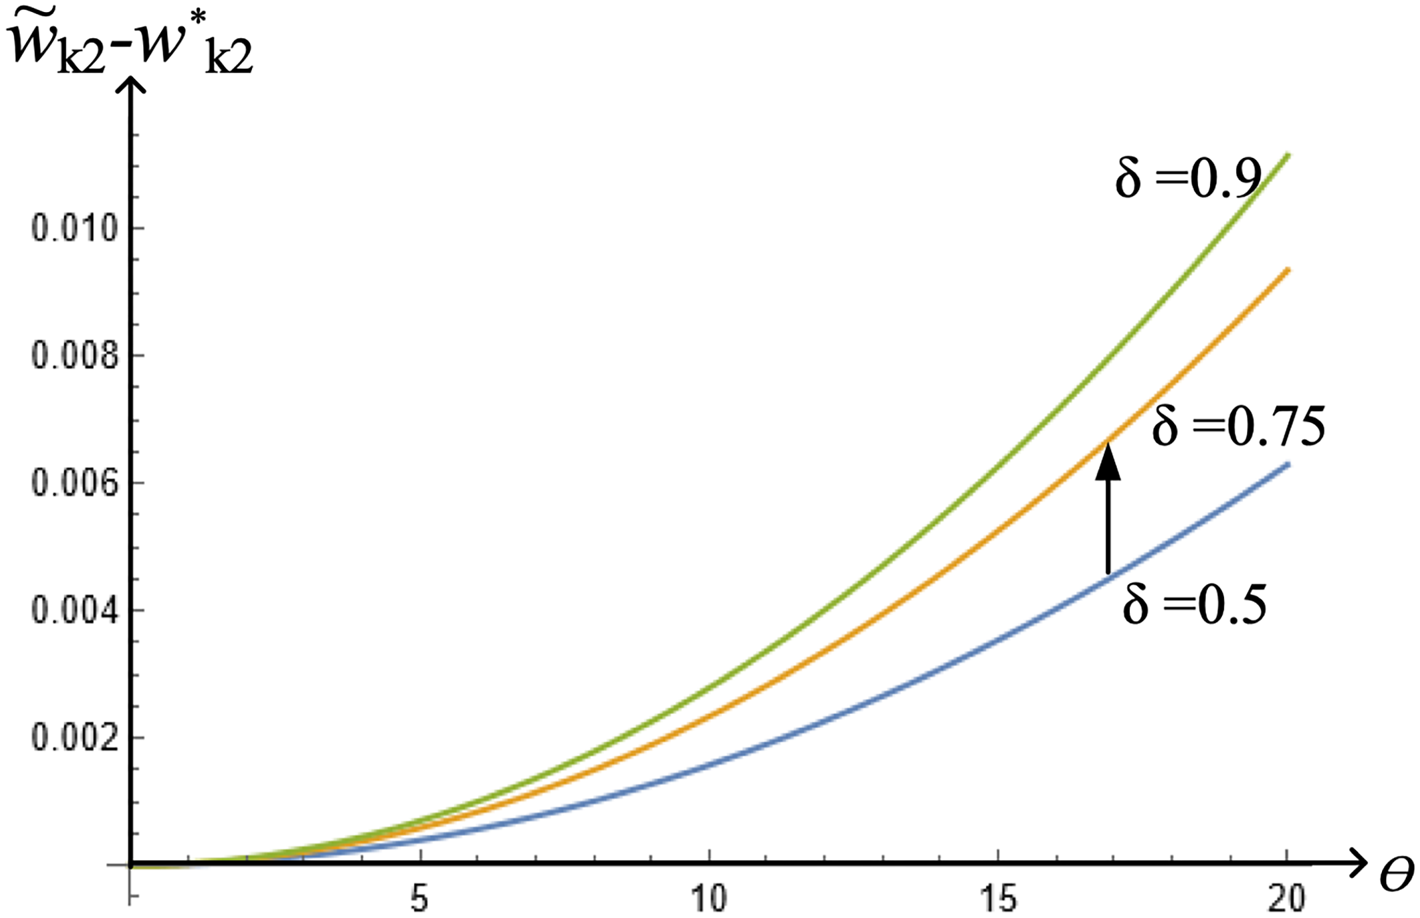
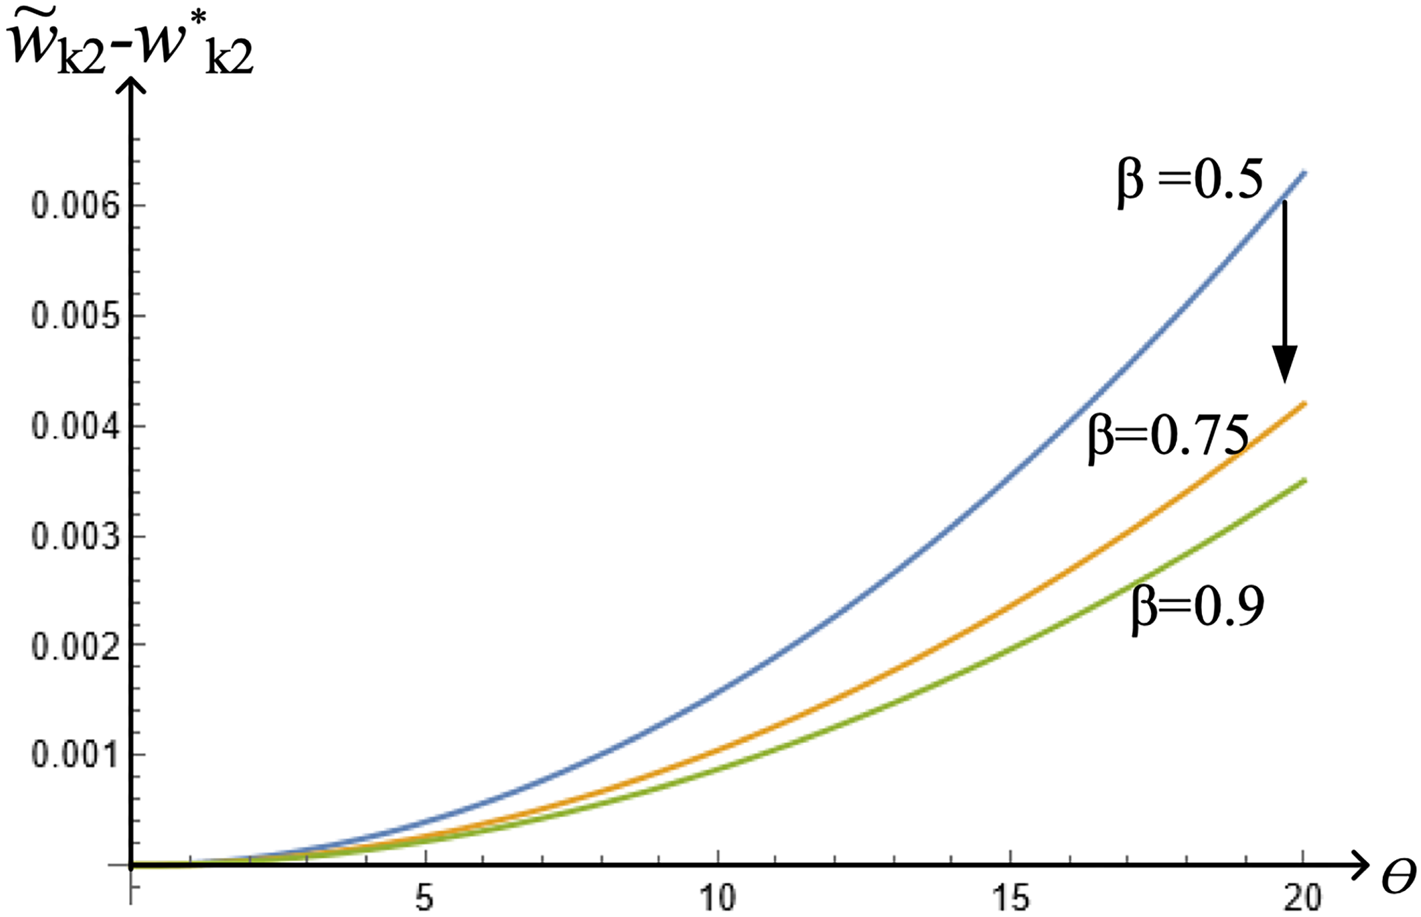
Figure 5 depicts the difference between second-period appropriations with and without abatement when firms assign more weight to future profits. As $\delta$ increases, firms abate less in period 1, which improves the quality of the CPR in the following period. This enables the firms to appropriate more in period 2 compared to the case of no abatement and, as a result, the difference expands. On the contrary, when the abatement cost $\beta$
 increases (see figure 6), abatement effort becomes more expensive, which reduces appropriations in period 2. However, the difference is still positive, indicating that abating firms still appropriate more in the second period compared to those that do not. Note that in both cases (figures 5 and 6) a high quality of the stock emphasizes the difference.
Changes in the discount rate, $\delta$ .

Changes in the abatement cost, $\beta$ .

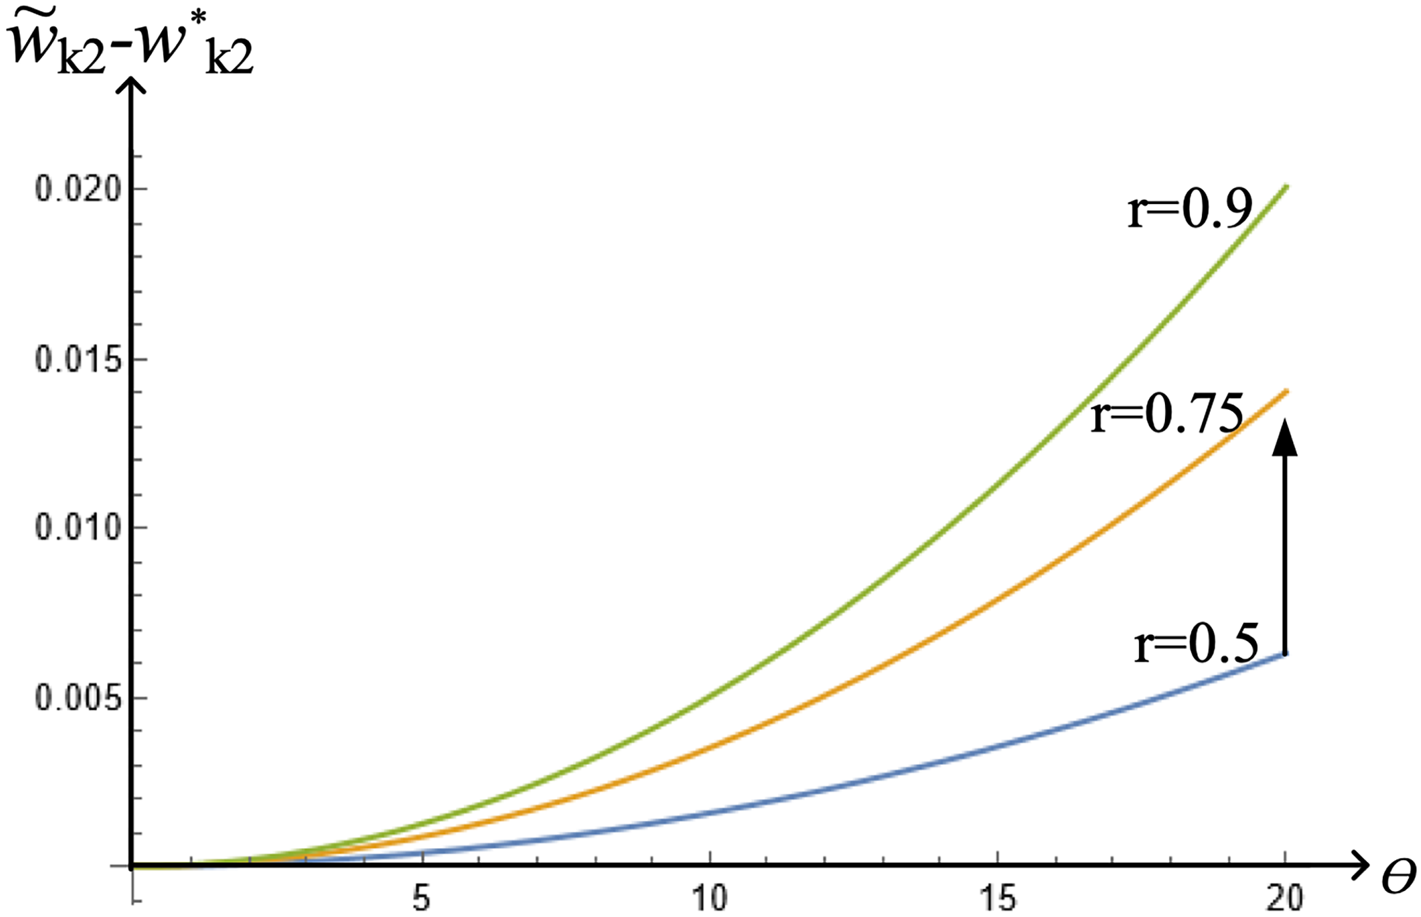
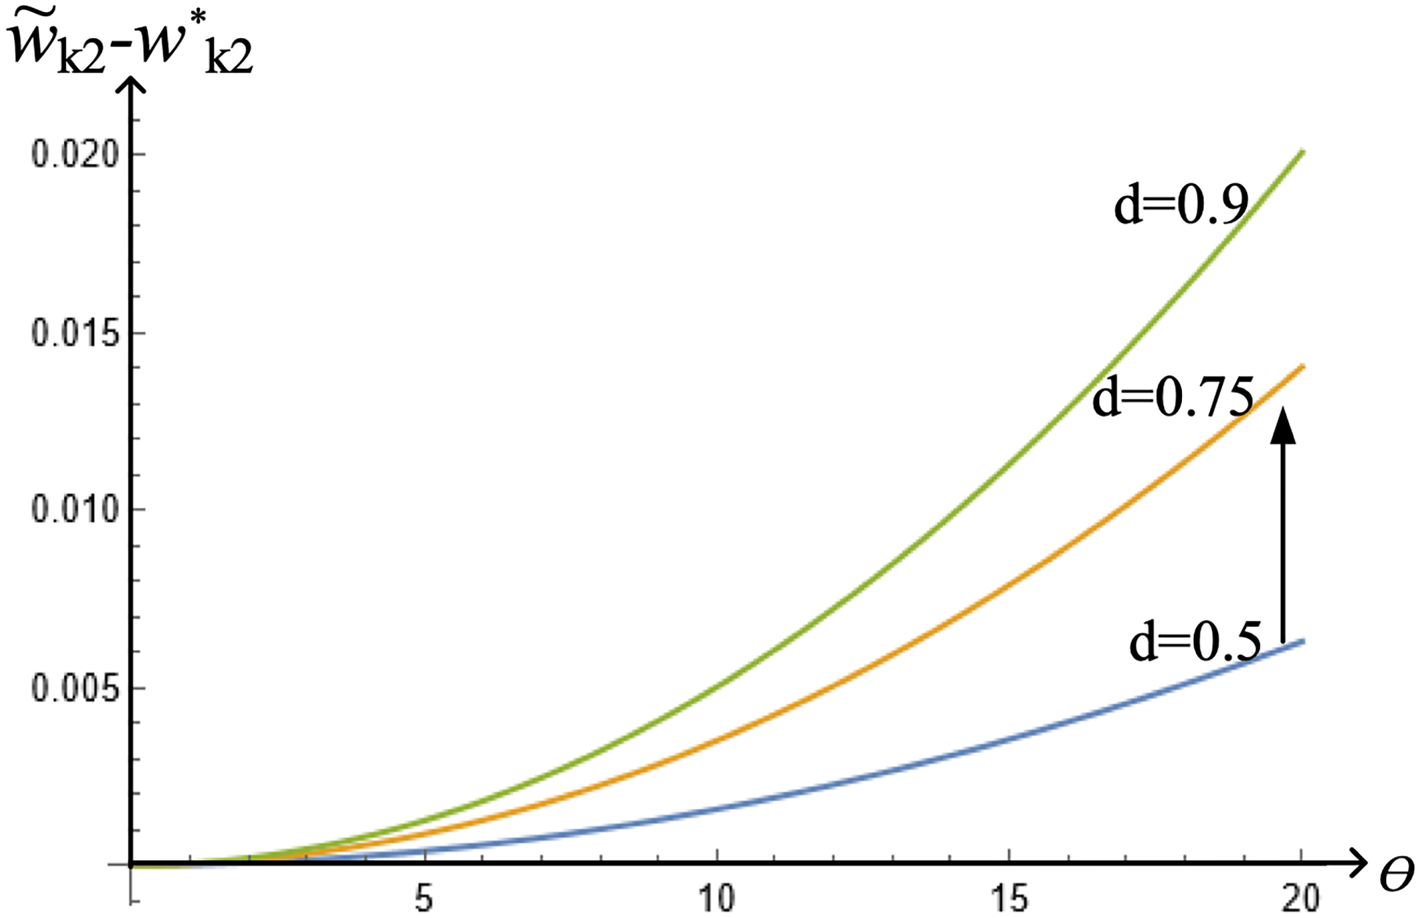
Figures 7 and 8 depict the second-period appropriation difference with and without abatement considering changes in the regeneration rate and damage change, respectively.
Changes in the regeneration rate, $r$ .

Changes in the deterioration rate, $d$ .

As the regeneration rate increases (see figure 7), the second-period appropriation difference also increases. More rainfall lowers second-period appropriation costs and, as a consequence, enables abating firms to appropriate more. An increase in deterioration (see figure 8) induces firms to abate more in period 1, ultimately inducing a higher appropriation in the next period and thus expanding the difference between appropriations with and without abatement.
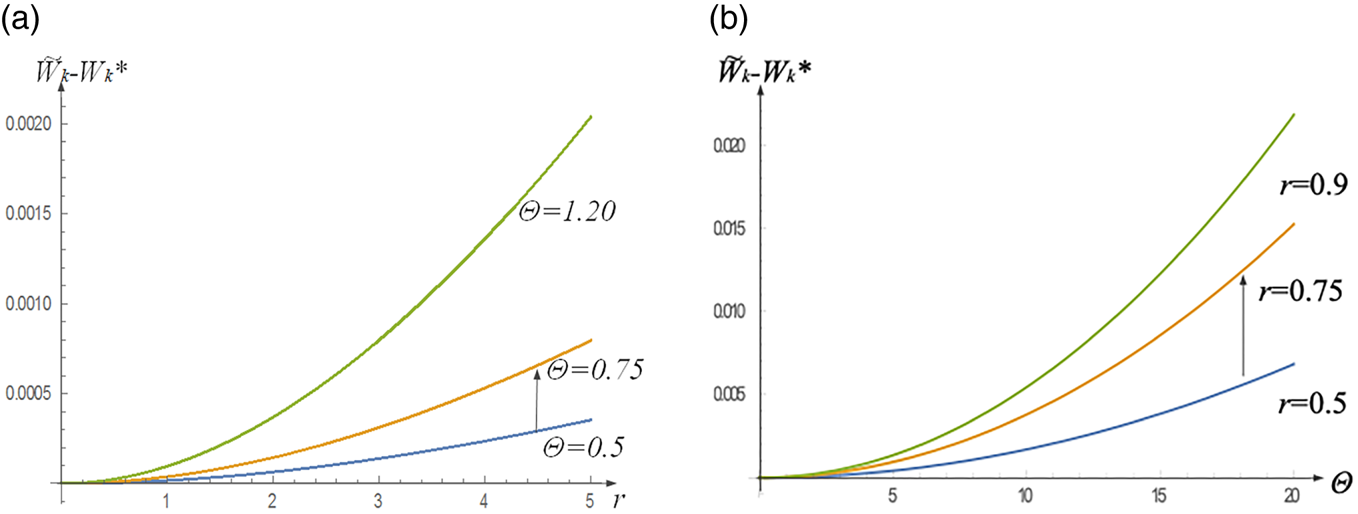
Finally, figures 9a,b present the difference between total appropriations with abatement, $\tilde {W_k}=\tilde {w_{k1}} + \tilde {w_{k2}}$ , and without abatement, $W_k^*=w_{k1}^*+w_{k2}^*$
 , considering the same parameter values used in the previous figures. Figure 9a shows how the difference in total appropriations, $\tilde {W_k}-W_k^*$
 , changes when the quality of the CPR increases. We observe that the aggregate difference expands when $\theta$
 increases from 0.5 to 0.75 or 1.20. It indicates that as the quality of the resource improves, aggregate appropriations are higher with than without abatement (upward shift of the curve). Hence, cleaning the CPR allows abating firms to appropriate more in aggregate when the quality increases. Figure 9b also depicts the difference in aggregate appropriations with and without abatement but considering changes in the regeneration rate. Similar to in figure 9a, an increase in the regeneration rate from 0.5 to 0.75 or 0.9 expands the aggregate difference, shifting the curve upwards. This result is mainly explained by a substantial increase in second-period appropriation when a firm abates (see figure 7, $\tilde {w_{k2}}> w_{k2}^*$
 ), completely offsetting first-period appropriation differences where $w_{k1}^*> \tilde {w_{k1}}$
 (see figure 4).
Total appropriations, (a) Changes in the quality of stock, $\theta$ , (b) Changes in the regeneration rate, $r$
 .

3.3. Socially optimal appropriations
We next examine socially optimal appropriations considering aggregate profits and focusing on the case of abatement. We operate by backward induction and, hence, first examine second-period profits. The second-period maximization problem is

In the first period, the social planner also maximizes first-period aggregate profits and discounted second-period profits,

Operating by backward induction, we obtain second-period appropriations as a function of first-period extractions. We next present Lemma 4 which summarizes our results.
Lemma 4 Second-period appropriations for each firm $k$ , where $k=\{i,\,j\}$
 and $k \neq l$
 , are

and

Firm $k$ 's second-period appropriations are increasing in $\theta$
 . Hence, an improvement in the quality of the stock enables firms to appropriate more in period 2. In addition, second-period appropriations are decreasing in deterioration and first-period appropriations if $z_{k1}$
 is sufficiently low. However, the negative effect of deterioration is ameliorated by a higher abatement effort in the first period. We next present the socially optimal equilibrium appropriations.
Proposition 3 Socially optimal appropriations and input levels for each firm $k,$ where $k=\{i,\,j\},$
 in the first and second period are


which are positive if $r < {16c}/{\delta d}$ .
Similar to the case with abatement, first-period socially optimal appropriations are increasing in the quality of the the total stock. In addition, as the regeneration rate increases, first-period appropriations decrease if the abatement cost is low. We observe a similar result in the case of discount rate and deterioration. Intuitively, low abatement costs induce higher abatement efforts in the first period. As a consequence, a low deterioration accompanied by low abatement costs increase socially optimal appropriations.
Regarding abatement effort $z_{i1}$ , it decreases when the cost of abatement becomes higher. In addition, an increase in the quality of the total stock, $\theta$
 , induces a lower abatement effort. Both results hold for all admissible values of $r$
 and can be found at the end of the proof of Proposition 3 in the online appendix.
3.3.1. Equilibrium comparisons with socially optimal appropriations
We next compare first-period equilibrium appropriations when firms do no abate (competitive scenario without abatement, benchmark) with socially optimal appropriations.
Lemma 5 First-period socially optimal appropriations, $w_{k1}^{SO}$ , are lower than without abatement, $w_{k1}^*$
 , if

is strictly positive if $r \in [\hat {r},\, {16 c}/{\delta d}]$ . For compactness, $\hat {r}$
 is presented in the online appendix.
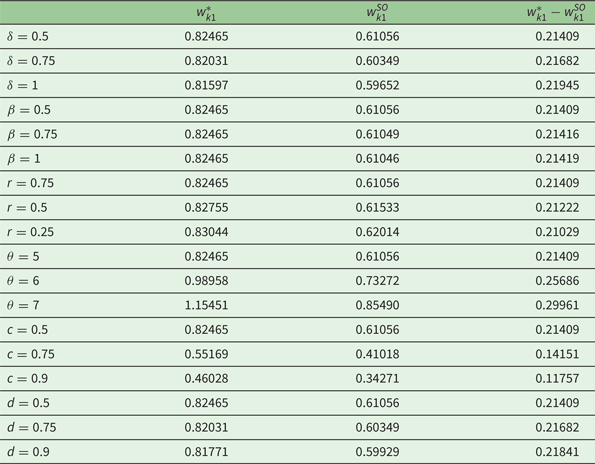
The difference between appropriations without abatement and socially optimal appropriations is positive if the regeneration rate is intermediate. Hence, relatively abundant rain induces firms to overuse the CPR. Table 1 examines how this difference is sensitive to changes in different parameter values.Footnote 10
Comparison of first-period appropriations without abatement and socially optimal appropriations

.
The difference between first-period appropriations without abatement and socially optimal appropriations increases as the discount rate, abatement cost and regeneration rate increase, leading to an overutilization of the resource. The regeneration rate improves the quality of the resource which induces firms to appropriate more in period 1, moving farther away from socially optimal appropriation levels.
In addition, the difference also increases as the quality of the stock increases (see table 1). A similar result is observed in the case of deterioration, leading to overutilization of the resource. However, the difference decreases when the cost of other inputs, $c$ , increases, inducing appropriation levels closer to the socially optimal.
We next compare first-period appropriations of firms that abate (competitive scenario with abatement) with socially optimal appropriations.
Lemma 6 First-period socially optimal appropriations, $w_{k1}^{SO}$ , are lower than appropriations with abatement, $\tilde {w}_{k1}$
 , if

is strictly positive if $r \geq \tilde {r}$ . For compactness $\tilde {r}$
 is presented in the online appendix.
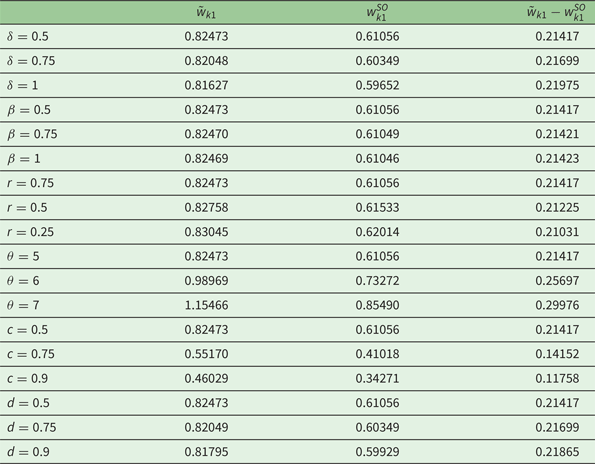
The difference between appropriations with abatement and socially optimal appropriations is positive if the regeneration rate is sufficiently high. Similar to Lemma 5, the condition on $r$ becomes less demanding as abatement cost, $\beta$
 , decreases. Thus, as abatement cost decreases, we are more likely to observe that appropriations with abatement are above the socially optimal. We next examine how Lemma 6 is affected by changes in different parameter values.Footnote 11
The difference between competitive first-period and socially optimal appropriations increases as future profits become more relevant, and as abatement cost increases, leading to an overutilization of the resource (see table 2). This result implies that lower abatement costs induce firms to exert higher cleaning efforts, moving them closer to socially optimal appropriation levels. Lastly, the difference expands as the regeneration rate increases, inducing an overuse of the resource. The regeneration rate improves the quality of the CPR facilitating firms’ exploitation of the resource.
Comparison of first-period appropriations with abatement and socially optimal appropriations

.
The difference also expands when the quality of the total stock, $\theta$ , increases (see table 2). An increase in the total stock quality induces firms to extract more than the socially optimal level. In contrast, if the cost of other inputs, $c$
 , increases, then the difference shrinks. However, the opposite is observed when the deterioration of the CPR increases. The differences between second-period appropriations (without and with abatement) and socially optimal appropriations can be found in tables A1 and A2 in the online appendix. We also identify the total difference across periods, i.e., $W_k^* - W_k^{SO}$
 where $W_k^* = w_{k1}^* + w_{k2}^*$
 and $W_k^{SO} = w_{k1}^{SO} + w_{k2}^{SO}$
 and $\tilde {W_k} - W_k^{SO}$
 where $\tilde {W_K} = \tilde {w_{k1}} + \tilde {w_{k2}}$
 . We observe that aggregate appropriations (without and with abatement) are always above socially optimal appropriations. This result is emphasized by an increase in the quality of the CPR, and a decrease in the abatement cost, regeneration rate and deterioration rate.
Lemma 7 compares the competitive abatement effort with the socially optimal abatement level.
Lemma 7 The socially optimal abatement effort, $z_{k1}^{SO}$ , is higher than appropriations with abatement, $\tilde {z}_{k1}$
 , if

is strictly positive, which occurs if $\theta \geq {64 (179 \beta c^3 d \delta r-1584 \beta c^4)}/{5 d^2 \delta ^2 r^2} \equiv \hat {\theta }$ .
Our results indicate that the social planner induces a higher abatement than that chosen by firms when the quality of the stock is sufficiently high, $\theta \geq \hat {\theta }$ . In this setting, high quality induces firms to appropriate more in period 1 which in turn decreases its abatement efforts, since more resources are dedicated to appropriation. Note that when $d=0$
 , the difference is nil; in this case quality does not affect first-period appropriations, making abatement unnecessary. The opposite result arises when the quality of the stock is low, $\theta < \hat {\theta }$
 . In this context firms choose an abatement effort above the socially optimal since first-period appropriations affect second-period extractions. Unlike the case of high quality, firms appropriate less when quality is low in period 1, thus exerting higher abatement efforts than those selected by the social planner.
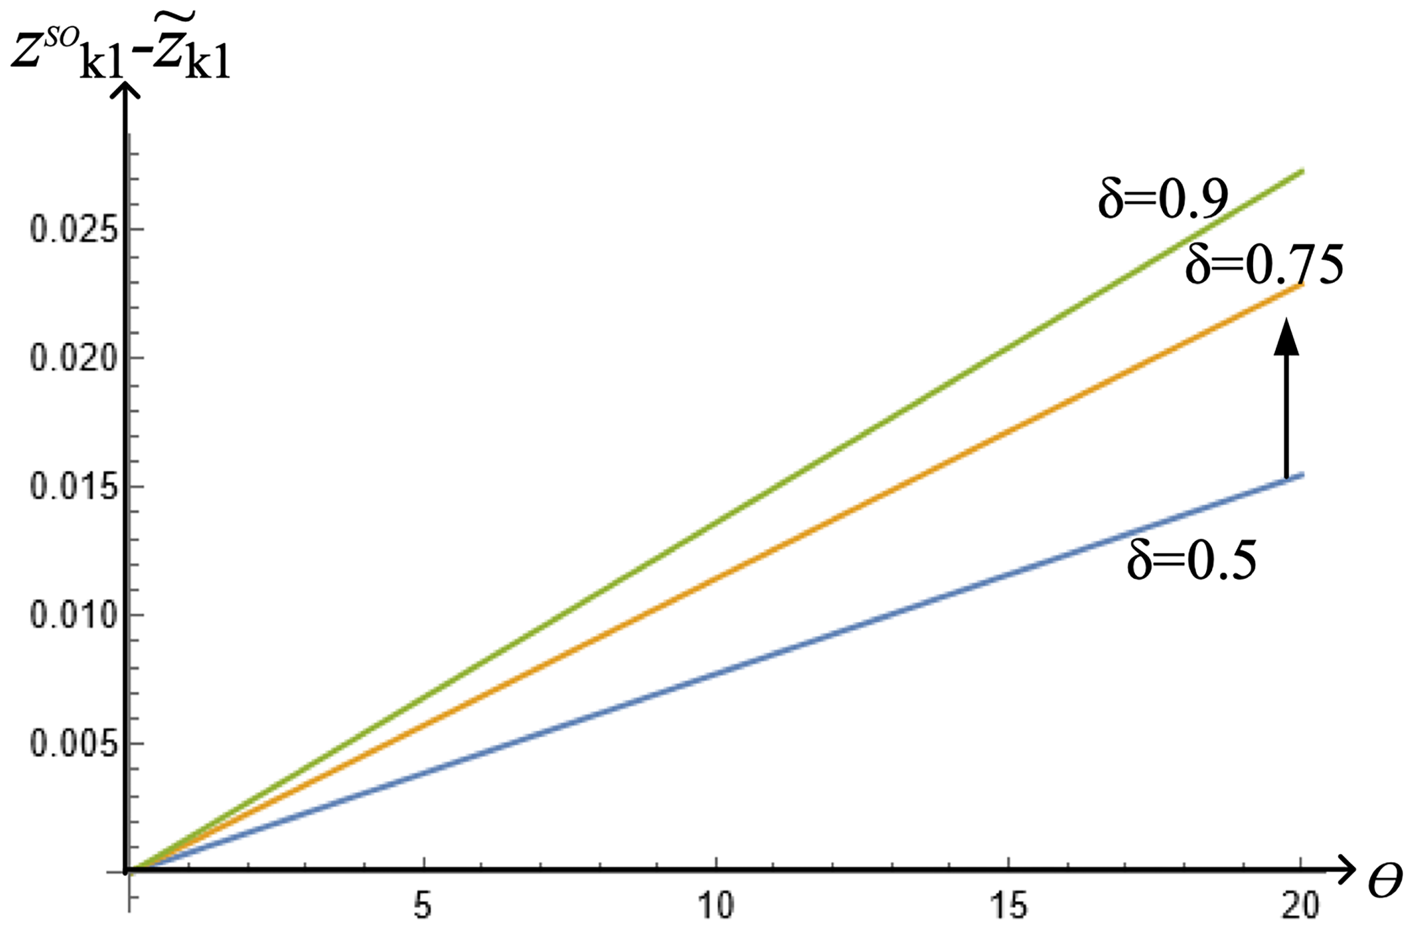
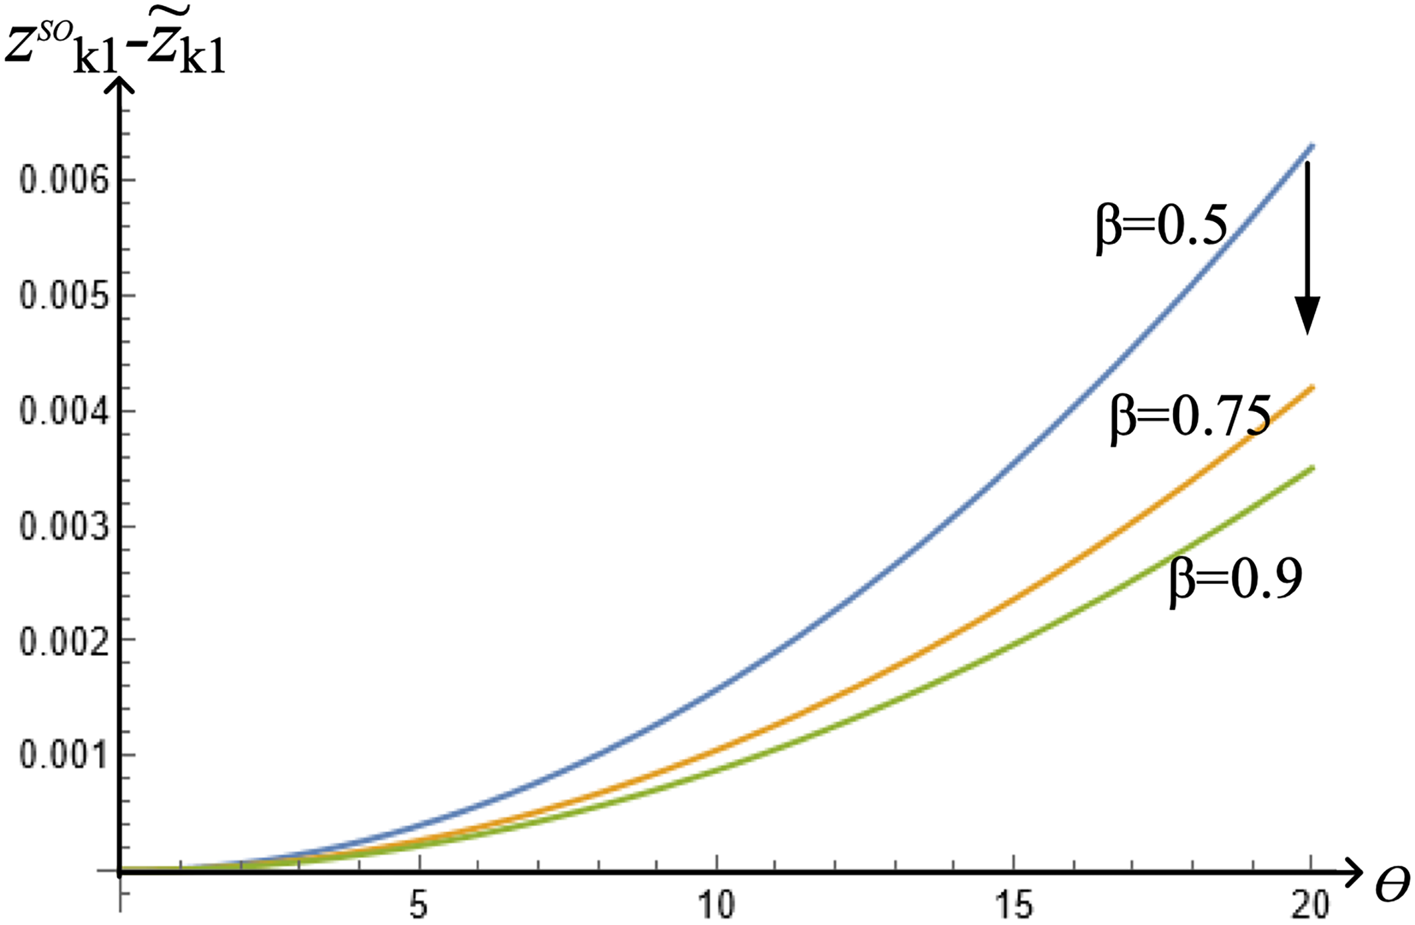
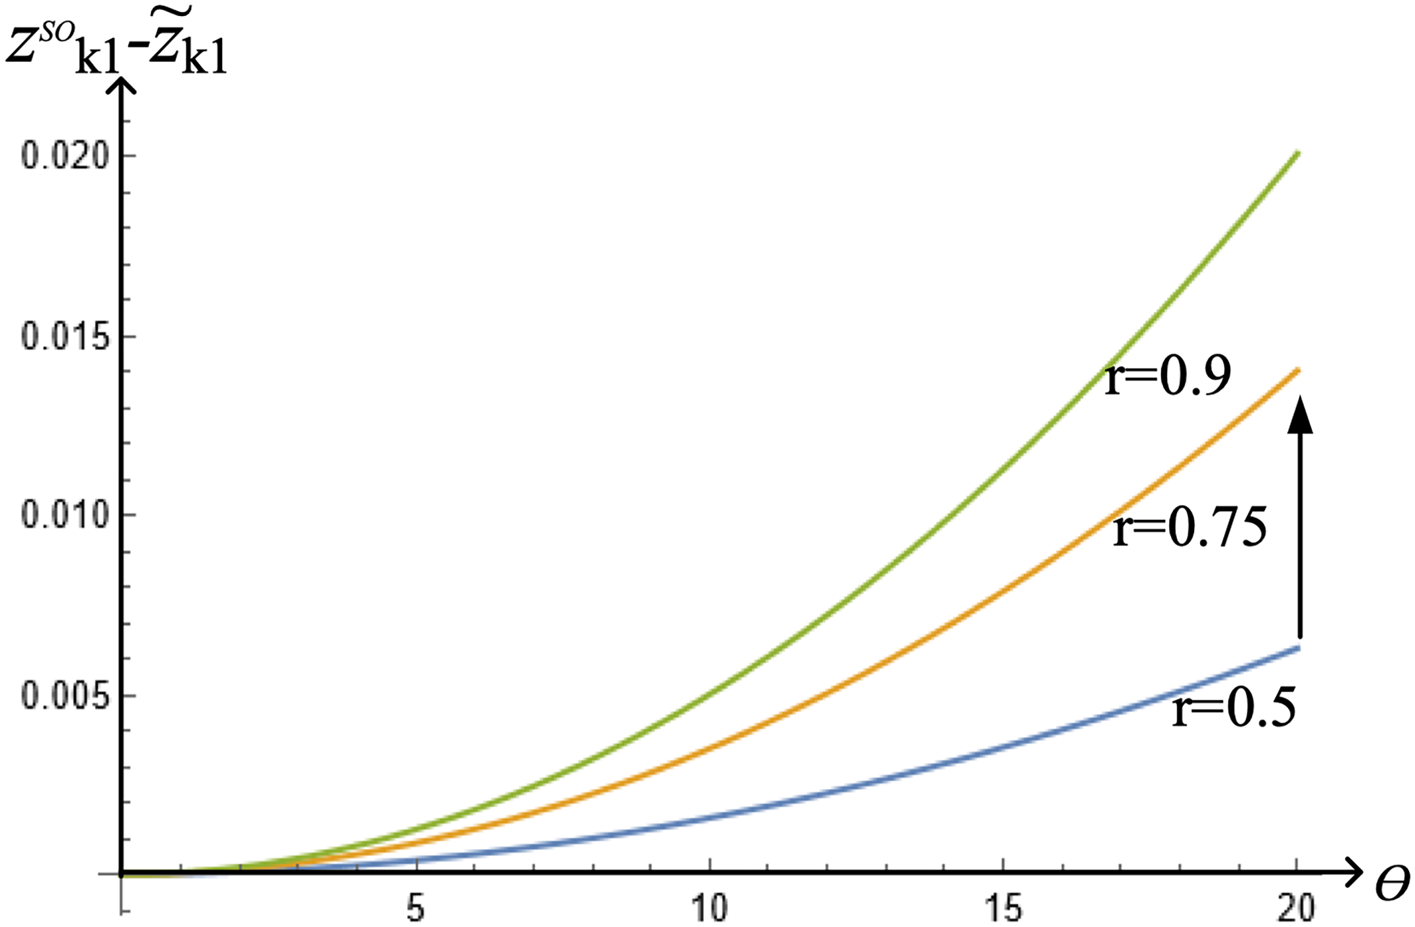
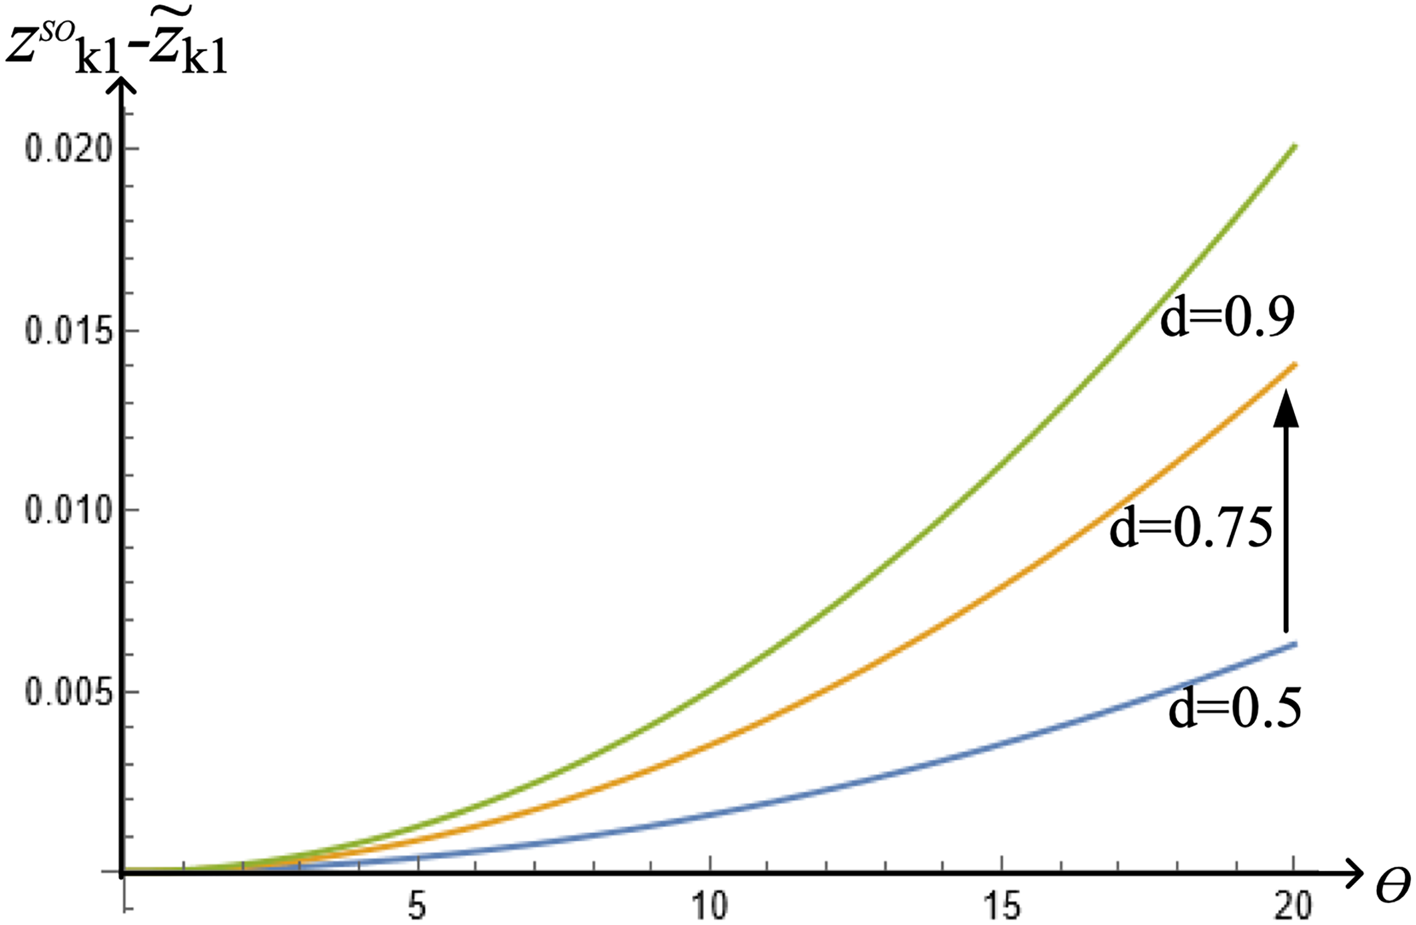
Similar to before, we depict the difference between abatement efforts. We consider a benchmark scenarioFootnote 12 and examine how the difference, $z_{k1}^{SO} - \tilde {z}_{k1}$ , expands or shrinks when the discount rate ($\delta$
 ), the abatement cost ($\beta$
 ), the regeneration rate ($r$
 ) and the deterioration rate ($d$
 ) change.
The difference between the socially optimal and competitive effort levels increases when the discount rate increases (see figure 10). As the quality of the stock increases, the social planner chooses a higher abatement effort. expanding this difference. That is, lower abatement efforts are chosen by firms (compared to the socially optimal) when the quality of the stock is high. This is mainly due to a lower negative effect from extractions in period 1. In contrast, if the abatement cost, $\beta$ , increases, the difference in Lemma 7 shrinks (see figure 11).
Changes in the discount rate, $\delta$ .

Changes in the abatement cost, $\beta$ .

We also observe that when the regeneration rate increases, the difference between abatement efforts expands (see figure 12). As mentioned before, the regeneration rate increases the total stock and thus the quality of the CPR, inducing firms to exert lower abatement efforts than the socially optimal. Lastly, the difference expands as deterioration increases (see figure 13). The social planner internalizes the intertemporal externality, choosing a higher abatement effort when the deterioration of the CPR is more severe. Our comparisons indicate that no abatement makes CPRs more susceptible to the tragedy of the commons when the regeneration rate is moderated. However, allowing for abatement attenuates the overuse of the resource, and hence makes the tragedy of the commons less like to occur, especially when the regeneration rate is moderated. From a policy perspective, our findings indicate that promoting abatement of CPRs by subsidizing clean technology should help reduce the overutilization of the resource.
Changes in the regeneration rate, $r$ .

Changes in the deterioration rate, $d$ .

We next present a ranking of appropriation levels without and with abatement, and the socially optimal level. Lemma 8 illustrates our findings.
Lemma 8 First-period appropriations can be ranked as follows:
i. ${w_{k1}}^* > \tilde {w}_{k1} > w_{k1}^{SO}$
 if $r \in [min (\hat {r},\, \tilde {r}),\, r^*]$
ii. $\tilde {w_{k1}} > {w_{k1}}^* > w_{k1}^{SO}$
if $r> \hat {r}$ and when $\hat {r} = \tilde {r}$ then $w_{k1}^* = \tilde {w}_{k1}$iii. $w_{k1}^{SO} > \tilde {w}_{k1} > {w_{k1}}^*$
if $r \in [r^*,\, \tilde {r}]$ and $\tilde {r}< \hat {r}$


There are three cases depending on the range of the regeneration rate. In case (i), non-abating firms overuse the resource compared to the socially optimal and abating firms. If the resource regenerates in the range of $[\hat {r},\, r^*]$ or $[\tilde {r},\, r^*]$
 , then the socially optimal appropriations are the lowest, followed by firms with abatement and those that do not abate leading to the overutilization of the resource. This result is supported by intermediate regeneration rates, i.e., normal rain season. However, in case (ii), abating firms overuse the resource (despite their additional cost) when the regeneration rate is sufficiently high, i.e., abundant rain. The condition of $\hat {r} = \tilde {r}$
 arises when $w_{k1}^* = \tilde {w}_{k1}$
 , indicating that abatement efforts do not affect appropriations in period 1. The abundance of the CPR reduces the abatement cost, inducing them to overuse the resource. A higher regeneration rate improves the quality of the resource and disincentivizes firms to abate in period 1. As a consequence, firms tend to appropriate more compared to the socially optimal or the case of no abatement, leading to overuse of the resource. Finally, in case (iii), the social planner chooses an amount above that chosen by abating firms. In this case firms are under-using the CPR; this context arises when the regeneration rate is sufficiently low, i.e., drought. The social planner prioritizes society's well-being, and the long-term sustainability and equitable distribution of the CPR. The low regeneration rate during drought makes it essential for the social planner to intervene and ensure a more efficient and sustainable use of the CPR that benefits the society as a whole.
4. Conclusion
We study how abatement efforts that improve the quality of a resource affect appropriation levels and, thus, the overuse of a CPR. We examine a CPR game considering two cases where firms (i) do not abate, and (ii) abate. Our findings indicate that firms overuse the CPR, with and without abatement, if the quality of the resource increases. However, first-period appropriations are decreasing in the regeneration rate. In this case, high discount rates and abundant rain promote a higher appropriation in the second period. We also compare first-period appropriation levels without and with abatement. We find that a low regeneration rate induces non-abating firms to use the resource more intensively in the first period than abating firms. This result is mainly explained by more expensive abatement costs due to a less abundant resource. The difference between first-period appropriations increases as deterioration rises, whereas the difference decreases when the CPR regenerates more rapidly. Hence, from a policy perspective, our findings indicate that abatement should be especially promoted when CPRs face poor regeneration or become more polluted.
We also identify socially optimal appropriation levels and compare them with the case in which firms abate and do not abate. We find that socially optimal appropriation levels are lower than the scenario with and without abatement, leading to a dynamic inefficiency. The dynamic inefficiency arises because a firm does not internalize the cost externality that the other firm imposes on it. The social planner corrects for this cost externality by choosing lower appropriations. The difference between socially optimal and competitive first-period appropriations with and without abatement increases if the abatement cost, quality of the stock, discount rate, and regeneration rate increase, leading to overutilization of the resource. In the case of abatement effort, the social planner sets a higher level than a competitive setting. We observe that the difference increases in the regeneration rate, discount rate, and deterioration. But it decreases if the abatement cost increases, since it becomes more expensive to clean the resource.
Lastly, we develop a comparison between first-period appropriations without abatement, with abatement and socially optimum levels. The socially optimum appropriation levels are the lowest, followed by abating firms and then firms that do not abate when the regeneration rate is intermediate. As the rate of regeneration increases, this ranking is sustained, inducing abating firms to use the resource above socially optimal levels. Higher regeneration rates discourage abatement, causing firms to appropriate more than the socially optimal, also leading to the overuse of the CPR. However if the regeneration decreases, we observe an opposite ranking. In this context, the social planner chooses higher appropriations than an abating firm since she accounts for the society's well-being, long-term sustainability, and equitable resource distribution. For instance, the USDA reported in 2017 that farmers in California and the Pacific Northwest strategically reduced their water usage when they faced major droughts in 2013–2016 (Wallander et al., Reference Wallander, Marshall and Aillery2017). In addition, Vogue Business magazine reported in November 2017 that drought induced the textile firms to use less resource, producing supply chain disruptions (Webb, Reference Webb2022). From a policy perspective, our results highlight the importance of promoting the abatement of CPRs that become polluted or deteriorated by their usage, as in the case of rivers used by textile firms, and in particular when their regeneration rate decreases.
While our findings provide insights into the behavior of firms and the role of social planners in resource management, several areas warrant further research. Our model considers a context of complete information; however, examining asymmetric information about firms’ decisions or uncertainty about the regeneration rate could enhance our understanding of the overexploitation of CPRs. Furthermore, heterogeneous characteristics, such as different abatement costs or deterioration rates, could offer a more nuanced perspective on CPR utilization and its management. Finally, the model could be extended by including a scrap value function that considers final stock or quality levels (see Krawczyk, Reference Krawczyk2005; Ikefuji et al., Reference Ikefuji, Laeven, Magnus and Muris2010). By looking at these knowledge gaps, future studies could build upon our existing model and contribute to the literature on CPR management.
Supplementary materials
The supplementary material for this article can be found at 10.1017/S1355770X2400038X.
Acknowledgements
We would like to thank Joe Cook, Shanthi Manian and Félix Munoz-García for their insightful comments and suggestions. We also are very thankful for the advice, suggestions, and comments from the editor, Susana Ferreira, and two anonymous reviewers. Finally, we would like to thank participants at the 2022 WEAI Conference and the SES Student Seminars at Washington State University for their constructive feedback.
Competing interest
The authors declare none.