


1 Introduction
The fusion community has plenty to thank mathematicians for, but the very foundations of magnetic confinement fusion lie on a theorem in algebraic topology known as the hairy ball theorem: the only topology allowing a vector field (such as magnetic field) to lie tangent to the surface at all points is a torus. Therefore, in both tokamaks and stellarators the plasma is confined on concentric, (topologically) toroidal flux surfaces, each in principle defined by a single field line. Consequently, (in equilibrium) no pressure or potential difference can exist on a given flux surface, but gradients can exist between flux surfaces. This makes magnetic fusion devices essentially one-dimensional – at least in the first approximation. Basic magnetohydrodynamic (MHD) theory that tokamak equilibria are based on indeed consists of ordinary differential equations with the flux surface coordinate as its variable.
Introduction of the divertor geometry brought with it a new region where, in principle, this assumption no longer holds: the field lines outside the magnetic separatrix intersect the divertor plates, allowing gradients also along the field lines. Therefore, modern fluid codes operating at the plasma edge have to be (at least) two-dimensional.
The toroidal magnetic field strength at the outboard midplane separatrix as a function of the toroidal angle. The blue curve correspond to the unmitigated TF-ripple while the red curve includes the effects due to ferritic inserts and TBMs. The ripple mitigation is found very effective except at the beam ports, where the shape of the inserts had to be compromised, and the TBMs are evident as finger-like, double-ended structures at three locations.

All of the above holds for the plasma bulk particles. However, high performance tokamaks and stellarators feature a particle species the analysis of which requires higher dimensionality across the plasma: energetic ions, introduced either by external heating, such as neutral beam injection (NBI) and ion cyclotron resonance heating (ICRH), or fusion reactions, exhibit significant radial excursions from their nominal flux surface due to magnetic drifts. Therefore the fast ion physics has to be (at least) two-dimensional, covering the poloidal cross-section of a tokamak.
Until recently, most tokamaks could be considered axisymmetric to a high degree. The dominant factor breaking the axisymmetry has been the toroidal field (TF) ripple, but with reasonably small machines and high number of TF coils its magnitude has been small. The situation with ITER is already different. A device twice the size of joint European torus (JET) in linear dimension will have only half of the TF coils (18) compared to JET (32). The resulting TF ripple would be too high and it will be partially mitigated by ferritic inserts (FI), to be installed in the double wall structure right in front of each coil, thus reducing the magnetic field strength there. However, the poloidal extent of the inserts is limited, which makes the field structure more complicated. Another factor breaking the axisymmetry in ITER is introduced by the so-called TBMs (test blanket modules) that will test tritium breeding. These massive modules are also made of ferritic material and, thus, will perturb the magnetic configuration. ITER will have six TBMs, installed in pairs in three different ports. The most dramatic symmetry-breaking effect in ITER is expected from the edge localized modes (ELM) control coils (ECC), to be installed in three toroidal rows around the torus. All these external contributors to the total field are discussed and their effect simulated in Kurki-Suonio et al. (Reference Kurki-Suonio, Äkäslompolo, Särkimäki, Varje, Asunta, Cavinato, Gagliardi, Hirvijoki, Parail and Saibene2016a ). Figure 1 illustrates how each affects the toroidal field strength at the outer midplane separatrix.
However, with the exception of the very periphery of the plasma, ITER will still be practically an axisymmetric device. This is not the case for the new (or, depending on the viewpoint: old) technology catching up with the tokamaks: the stellarators are inherently non-axisymmetric. This comes at high computational cost. In fact, already the optimized three-dimensional (3-D) design of the Wendelstein 7-X (W7-X) stellarator became possible only with the advent of the supercomputers.
The traditional fusion plasma physics has mainly been concerned with what happens in the confined plasma. However, with energy-producing fusion reactors in sight, more attention is now given also to what comes out of the plasma. It is the plasma-facing material components that will, to a high extent, decide if fusion power plants will be economical. When calculating the particle and power distributions to the reactor walls, one has to take into account that not only is the magnetic field non-axisymmetric but so is the first wall, particularly in present-day tokamaks and ITER. In fact, simulations of trace-impurity injection experiments in ASDEX Upgrade revealed that, for the deposition profile, the 3-D features of the first wall were more important than the magnetic non-axisymmetry (Miettunen et al. Reference Miettunen, Kurki-Suonio, Makkonen, Groth, Hakola, Hirvijoki, Krieger, Likonen and Äkäslompolo2012).
Non-axisymmetry will naturally have some effect on all plasma constituents, but energetic ions are the most critical ones: the collision frequency drops quickly with increasing energy and, therefore, the fast ions faithfully follow any field perturbation. In this contribution we address the challenges faced in attempts to reliably follow energetic (
 $E$
 $=$
tens of keV to MeV) ions in a truly three-dimensional, non-axisymmetric environment. The examples are mostly ones obtained with the ASCOT code, but reference to other 3-D fast ion codes, such as OFMC (Tani et al.
Reference Tani, Azumi, Kishimoto and Tamura1981) (very similar to ASCOT) and LOCUST (Akers et al.
Reference Akers, Verwichte, Martin, Pinches and Lake2012) and VENUS-LEVIS (Pfefferlé et al.
Reference Pfefferlé, Cooper, Graves and Misev2014) (both with somewhat different conventions) is made when appropriate. In particular, it should be noted that a modern version of OFMC (Shinohara et al.
Reference Shinohara, Kawashima, Tsuzuki, Urata, Sato, Ogawa, Kamiya, Sasao, Kimura and Kasai2003) was the pioneer in simulating non-trivial 3-D features due to ferromagnetic components.
2 Three-dimensional physics and implications for particle following
Fusion plasmas exhibit four classes of energetic particles:
(i) The 3.5 MeV fusion alphas are born with a practically isotropic velocity distribution (beam–target fusion compromises this slightly), thus featuring ions on both trapped and passing orbits.
(ii) Beam ions are injected at a fixed angle, producing trapped ions at the edge and passing ones closer to the centre – depending on the injection angle.
(iii) ICRH produces ions up to MeV range by pumping perpendicular energy to them. Thus all these fast ions are on trapped orbits.
(iv) Runaway electrons on strongly passing orbits can be generated in the context of a disruption.
To be exact, fusion devices feature also a fifth, very important class of energetic particles: the 14.1 MeV fusion neutrons. However, in this work our interest is only in the particles confined by the magnetic field, and mainly ions.
According to Emmy Noether’s famous theorem, for any continuous symmetry there exists a conserved quantity. In the case of particles moving in an axisymmetric tokamak magnetic field, this quantity is the canonical toroidal momentum,
 $P_{\unicode[STIX]{x1D719}}=mv_{\Vert }+q\unicode[STIX]{x1D6F9}$
, where
 $\unicode[STIX]{x1D6F9}$
is the toroidal flux. Conservation of
 $P_{\unicode[STIX]{x1D719}}$
implies that the orbit of a (collisionless) charged particle closes upon itself in the poloidal plane, i.e. even though due to magnetic drifts the particle moves radially between flux surfaces, at given poloidal angle it always ends up at the same surface. Therefore, ideally, even the energetic particles with their wide drift orbits are perfectly confined in an axisymmetric magnetic field. Consequently, they could be simulated with reduced models. The fastest models simply assign each test particle a given orbit topology and allow collisions to move the particle from one topology to another. The simulations are then carried out in, for instance, (
 $\unicode[STIX]{x1D6F9},E,\unicode[STIX]{x1D707}$
) space, where
 $\unicode[STIX]{x1D6F9}$
gives the radial position and
 $E$
and
 $\unicode[STIX]{x1D707}$
define the orbit topology. Here,
 $\unicode[STIX]{x1D707}$
is the magnetic moment.
An illustration of the orbit of a deeply trapped ion in non-axisymmetric magnetic field. Since the particle is precessing toroidally, the bounce points can take place at different values of major radius, leading to a ‘wandering’ banana.

When the toroidal symmetry is broken by any of the features described in the Introduction, we lose the benefits of Noether’s theorem: the drift orbits are no longer guaranteed to close upon themselves in the poloidal plane, resulting in net radial motion as illustrated in figure 2. Physically, this is readily seen for trapped particles: while for axisymmetric field the reflection point of a trapped particle stands at a given value of major radius,
 $R_{\text{mirror}}$
= const., in a non-axisymmetric configuration the magnetic field value needed for reflecting the particle lies at values of major radius that vary with the toroidal angle,
 $R_{\text{mirror}}=R_{\text{mirror}}(\unicode[STIX]{x1D719})$
, leading to the orbit behaviour of figure 2. Thus, the absolute confinement of charged particles is lost and, in truly non-axisymmetric devices, it is necessary to follow the orbits of test particles.
The severity at which the non-axisymmetry affects the particle confinement is not universal but strongly depends on the orbit topology: the passing particles, with their small radial excursions, relatively speaking, are less influenced than the trapped orbits. Furthermore, the trapped orbits can be affected differently depending on their pitch. For instance, for a pure TF ripple, particles with very small pitch can even be trapped between two adjacent TF coils and get rapidly lost by the (almost) vertical grad-B drift. Particles capable of moving full toroidal revolution but having their reflection points on the low-field side (LFS) experience a stronger ripple than those getting reflected on the high-field side (HFS). Thus their random walk process is faster but, on the other hand, their orbit widths are smaller than those reflected on HFS. Introducing ripple mitigation that would suppress the TF ripple on the LFS only might thus alter the ripple-diffusion pattern in the phase space. With increasing complexity in the magnetic field configuration it is thus very important to diligently follow the test particles.
Following the full gyro-orbits of energetic particles can be computationally very expensive. For instance, when following 3.5 MeV fusion alphas in ITER, the gyro-frequency is of the order of
 $10^{8}$
Hz. This implies a time step of approximately 0.1–1 ns in order to fully resolve the gyro-motion, while the slowing-down time is approximately half a second. However, resolving the full Larmor motion is not necessary when the gradients in the magnetic background are shallow enough not to bring significant changes in the field strength during one gyro-orbit. In such a situation, it is sufficient to follow only the guiding centres (GC) of the gyro-orbits. The condition for the validity of the GC approach is commonly expressed as
 $\unicode[STIX]{x1D70C}_{L}/L_{B}\ll 1$
, where
 $\unicode[STIX]{x1D70C}_{L}$
is the Larmor radius and
 $L_{B}$
the gradient length of the magnetic field. When following the guiding centres, simulating even the fusion alphas is computationally not an issue with modern super computers. In a device of ITER size, following guiding centres of fusion alphas for the full slowing-down time takes approximately
 $100~\text{s}$
per particle. As for the number of markers needed to get statistically reliable results, if one is interested only in zero-dimensional numbers (e.g. total power lost), already of the order of
 $N=10^{5}$
markers is enough. However, were one interested in the peak power load on the first wall, given in
 $\text{MW}~\text{m}^{-2}$
, convergence of the results requires at least
 $N=10^{6}$
(Kurki-Suonio et al.
Reference Kurki-Suonio, Äkäslompolo, Särkimäki, Varje, Asunta, Cavinato, Gagliardi, Hirvijoki, Parail and Saibene2016a
).
In cases with sufficient axisymmetry so that the orbits in the poloidal plane remain almost unchanged, it is possible to speed up the simulation of fast particles by accelerating the collisional time scale. In this approach, the guiding centres of particles are followed, but a single orbit is taken to stand for a multitude (10–100) of orbits when evaluating the effect of Coulomb collisions. This is a valid approximation when the collision time is 10–100 times longer than the bounce time.
When simulating strongly perturbed magnetic fields the validity of the guiding-centre approach has to be carefully considered: with non-axisymmetric magnetic fields it is not sufficient to check if the Larmor radius is sufficiently smaller than the standard gradient length of the magnetic field, but now one has to also make sure that the change in the magnetic field strength in the parallel direction is not too large during one Larmor orbit,
 $\unicode[STIX]{x0394}B/B\ll 1$
, where
 $\unicode[STIX]{x0394}B$
is the change in the magnetic field strength along the field line during one gyration period. If the parallel gradients are sufficiently strong, one has to revert to following the full gyro orbits (GO), which increases the computation time by a factor of 10–100. However, this problem can be partially circumvented in situations where the 3-D effect is radially limited, like the TF ripple. In such cases a hybrid method could be used: the guiding centres can be followed in the essentially axisymmetric field of the core plasma, but gyro-orbit would be adopted upon entering the non-axisymmetric part of the plasma. This method is naturally of limited use for energetic particles with very wide banana widths that would cover both the axisymmetric and the non-axisymmetric regions, but it has been successfully applied to calculate more precisely the power load distribution on the wall when the 3-D effects have not prohibited using GC approach: the GC markers are followed until approximately one Larmor radius from the wall. At that point also the gyro-orbit of the marker is followed, allowing detection of the exact deposition location on the wall. If the gyro-orbit makes no encounter with a plasma-facing component, the GO following is dropped when the marker has receded far enough from the wall and only GC following is continued.
The validity of the GC approach is not absolutely clear in all situations. Therefore we have done a few tests where the same ASCOT simulations were carried out first with GC following and then by GO following. In the original tests we found that GO following gave 25 %–50 % lower wall power loads than GC. This observation sparked an investigation of the actual guiding-centre transformation (A. Brizard, private communication 2017). A consistent GC description requires both the equations of motion and the collision operator to be transformed from the particle frame to the GC frame. In fast ion modelling, it is customary to use the standard particle collision operator even when applying GC following, but ASCOT now has a genuine GC collision operator (Brizard Reference Brizard2004; Hirvijoki et al. Reference Hirvijoki, Brizard, Snicker and Kurki-Suonio2013). This transformation is carried out to the zeroth order in the formal expansion parameter, while the transformations for the equations of motion, assumed more critical for energetic ions, are first order. Also the initial transformation from the particle position to the GC location was transformed to the first order. However, the magnetic moment and parallel momentum have still been taken at their zeroth-order (particle) value. We now have fixed this, including the first-order terms even in the magnetic moment and parallel momentum, so that the initial transformation now reads (see Cary & Brizard (Reference Cary and Brizard2009) and, more recently, Lanthaler et al. (Reference Lanthaler, Pfefferlé, Graves and Cooper2017))
 $$\begin{eqnarray}\boldsymbol{X}=\boldsymbol{x}-\unicode[STIX]{x1D746},\quad p_{\Vert }^{GC}=p_{\Vert }+p_{\Vert }^{1},\quad \text{and,}\quad \unicode[STIX]{x1D707}^{GC}=\unicode[STIX]{x1D707}+\unicode[STIX]{x1D707}^{1},\end{eqnarray}$$
where
 $$\begin{eqnarray}\displaystyle & \displaystyle p_{\Vert }^{1}=-p_{\Vert }\unicode[STIX]{x1D746}\boldsymbol{\cdot }\unicode[STIX]{x1D705}+\frac{m\unicode[STIX]{x1D707}}{q}(\unicode[STIX]{x1D70F}_{B}+\unicode[STIX]{x1D656}_{\mathbf{1}}\boldsymbol{ : }\unicode[STIX]{x1D735}\boldsymbol{b}) & \displaystyle\end{eqnarray}$$
 $$\begin{eqnarray}\displaystyle & \displaystyle \unicode[STIX]{x1D707}^{1}=\unicode[STIX]{x1D746}\boldsymbol{\cdot }\left(\unicode[STIX]{x1D707}\unicode[STIX]{x1D735}\ln B+\frac{p_{\Vert }^{2}}{mB}\unicode[STIX]{x1D705}\right)-\frac{\unicode[STIX]{x1D707}p_{\Vert }}{qB}(\unicode[STIX]{x1D70F}_{B}+\unicode[STIX]{x1D656}_{\mathbf{1}}\boldsymbol{ : }\unicode[STIX]{x1D735}\boldsymbol{b}). & \displaystyle\end{eqnarray}$$
Here,
 $\boldsymbol{X}$
and
 $\boldsymbol{x}$
are the guiding-centre and particle positions, respectively,
 $\unicode[STIX]{x1D746}$
stands for the gyro-vector,
 $p_{\Vert }$
is the parallel momentum and
 $\unicode[STIX]{x1D707}$
the magnetic moment. The magnetic curvature is
 $\unicode[STIX]{x1D705}=\boldsymbol{b}\boldsymbol{\cdot }\unicode[STIX]{x1D735}\boldsymbol{b}$
, the field line twist is
 $\unicode[STIX]{x1D70F}=\boldsymbol{b}\boldsymbol{\cdot }\unicode[STIX]{x1D735}\times \boldsymbol{b}$
, both given by the magnetic unit vector
 $\boldsymbol{b}$
. The dyadic tensor
 $\unicode[STIX]{x1D656}_{1}$
facilitates the compact form of the above equations and is nicely outlined in, e.g. Lanthaler et al. (Reference Lanthaler, Pfefferlé, Graves and Cooper2017).
At first this seemed to correct the inconsistency observed in the locations of the banana turning points as shown in figure 3(a): with the consistent application of the first-order transformation appeared to bring the GC turning point to coincide with the GO one. Unfortunately, repeating the test for a multitude of orbits it was discovered that this was not a generic fix: figure 3(b) shows several GC orbits corresponding to the same particle but assuming a different original gyro-angle. In addition, in red the figure shows an orbit where the gyro-orbit is followed but the GC transformation is carried out at each time step. The result is not a simple line but, rather, a helical orbit like the gyro-orbit but with significantly smaller radius. This study revealed the original gyro-angle does matter, as shown in figure 4 that reveals how, for the same gyro-orbit, one gets different GC paths depending on the gyro-angle. Therefore there always can be a slight difference between the GC and GO turning points.
A test ion trajectory followed in three different ways: full gyro-orbit (blue), with zeroth-order guiding-centre transformation (red) and with first-order guiding-centre transformation (red). In (b), the guiding centers of the same particle but with different initial gyro phases are also shown.

This inconsistency is not very likely to jeopardize the validity of the GC results. For instance, for fusion alpha particles the original gyro-phase is random to begin with. The fast ion species most sensitive to this inaccuracy is the counter-injected beam ions that could be lost during their first orbit – same naturally holds for fusion alphas born on counter-propagating orbits but, unlike beam ions, their birth probability in the cold edge is very low. Nonetheless, efficient alternatives to GC approach are worth investigating. In fact, the fairly recent GPU-based code LOCUST (Akers et al.
Reference Akers, Verwichte, Martin, Pinches and Lake2012) relies entirely on following full gyro-orbits. The argument is based on the fact that the length of a time step is not all that matters. For fusion alphas the time step in GC following is of the order of
 $\unicode[STIX]{x0394}t\sim 0.1~\unicode[STIX]{x03BC}\text{s}$
, but the conventional fourth-order Runge–Kutta scheme with 5th-order error correction requires 6 look-ups for the magnetic field. On the contrary, using the Boris method in integrating the gyro-orbit the time step is limited to
 $\unicode[STIX]{x0394}t<1~\text{ns}$
, but only 1 look-up for the magnetic field is needed. Careful comparison between the different integrators in different situations is thus called for.
3 High-fidelity representation of 3-D magnetic field
The accurate representation of the magnetic field is essential for fast ion orbit-following studies, and it is an twofold issue: how the field is evaluated within the orbit-following code and how the magnetic field data are assembled. We shall first discuss the evaluation issue, followed by how a complicated 3-D field can be assembled and what potential pitfalls are involved.
A gyro-orbit with corresponding guiding centres started at four different gyro-phases leading to slightly different values of the magnetic moment. Also the trajectory obtained by carrying out the GC-transformation at each step of the gyro-orbit following is shown.

ASCOT represents the magnetic field with cylindrical coordinates, (
 $R$
,
 $z$
,
 $\unicode[STIX]{x1D719}$
), and the total field is a superposition of an axisymmetric component and arbitrary 3-D magnetic field. The axisymmetric component, giving the 2-D plasma equilibrium and evaluated from the poloidal flux, is represented by bi-cubic splines, whereas the 3-D component, consisting of all magnetic field components
 $B_{R}$
,
 $B_{z}$
and
 $B_{\unicode[STIX]{x1D719}}$
, is represented by tricubic splines. However, while the axisymmetric component is divergence free, this is not guaranteed to be the case for the 3-D component. Significant divergence corresponds to a magnetic monopole and, thus, would cause particle orbits to drift unphysically. Therefore minimizing the divergence is important. The requirement of vanishing divergence could be trivially fulfilled if the input data would consist of the vector potential instead of the field itself, and this approach should be adopted in the future, if possible.
An alternative, and divergence free, way of evaluating the magnetic field would be to use Fourier representation, i.e. decompose the magnetic field into toroidal modes. The Fourier representation is not used in ASCOT, but it is used in codes such as LOCUST and VENUS-LEVIS. The drawback of this method is that the magnetic field evaluations would get computationally increasingly expensive as the number of modes included increases. This is not an issue for the toroidal ripple or ELM control coils which both produce perturbations with only a few significant modes. However, a much wider range of the spectrum is required to include non-periodic features introduced by, for instance TBMs or even FIs which, to avoid interference with the NBI ducts, are not identical in each of the 18 ITER sectors. If the complete magnetic field can be represented with only few modes, the Fourier approach is probably faster than the spline interpolation: memory access is usually the bottleneck in modern computers and storing spline coefficients requires much more memory than the Fourier approach.
Setting up the magnetic field is non-trivial in three dimensions since the data have to have a sufficient resolution to capture the magnetic perturbations also in the toroidal direction. Resolution is rarely an issue with the axisymmetric component, which is usually provided by the equilibrium codes such as VMEC. Neither is it an issue when the magnetic field perturbation is caused by the external coils as these perturbations can be accurately and efficiently calculated by, e.g. using tools based on the Biot–Savart law, such as BioSaw (Äkäslompolo, Koskela & Kurki-Suonio Reference Äkäslompolo, Koskela and Kurki-Suonio2015b ). The difficulties with resolution arise when including perturbations caused by components made of ferritic material that get magnetized in the reactor, like FIs and TBMs in ITER. To calculate their effect, a finite element method is applicable. Unfortunately, this is not a trivial process for a device of ITER size where the smallest details on magnetized components are on a millimetre scale. One way to alleviate the problem is to simplify the internal structure of the ferromagnetic component, but if the whole point of the study is evaluate the effect of the component as realistically as possible, this should not be taken too far. A simplification process aiming at retaining relevant features while eliminating some of the smallest structures is detailed in Äkäslompolo et al. (Reference Äkäslompolo, Asunta, Bergmans, Gagliardi, Galabert, Hirvijoki, Kurki-Suonio, Sipilä, Snicker and Särkimäki2015a ). Even with such preprocessing of the input data, when applying today’s finite element method (FEM) solvers such as the commercial COMSOL package used for ASCOT backgrounds, the total field cannot be reproduced at sufficient accuracy in a single run but one has to rely on a multi-step process outlined in Äkäslompolo et al. (Reference Äkäslompolo, Asunta, Bergmans, Gagliardi, Galabert, Hirvijoki, Kurki-Suonio, Sipilä, Snicker and Särkimäki2015a ).
However, simply calculating the perturbation field due to coils or magnetized material is not necessarily enough since the plasma adjusts to external perturbations. The effect of this plasma response can only be calculated with dedicated MHD codes such as JOREK and MARS-F which both have their strengths and weaknesses. The plasma response is known to ‘heal’ magnetic islands inside the plasma, but at the very periphery it has been found to sustain a narrow, stochastic region that can have the opposite effect on fast ion confinement. For ASCOT studies, two different MHD codes have been used. JOREK (Orain et al. Reference Orain, Bécoulet, Dif-Pradalier, Huijsmans, Pamela, Nardon, Passeron, Latu, Grandgirard and Fil2013) is a nonlinear code, making the computations CPU-intensive, that has full tokamak geometry, including the X-point, but uses reduced MHD model and as such omits the possible toroidal component of the plasma response. MARS-F (Liu et al. Reference Liu, Bondeson, Fransson, Lennartson and Breitholtz2000), on the other hand, does not use the reduced MHD, but it lacks the X-point geometry of JOREK. Furthermore, it is a linear code, which makes the computations fast but raises the concern on the validity of results when the perturbations are large. We have done a preliminary comparison between the response given by JOREK and MARS-F, showing that while there are differences in the details, the features leading to changes in fast ion deposition appeared similarly in both cases (Särkimäki et al. Reference Särkimäki, Bécoulet, Liu and Kurki-Suonio2018).
Figure 5 illustrates the role of the plasma response for the ITER 15MA baseline scenario when the ELM control coils are operated at somewhat exaggerated current value. While the island in the core plasma almost disappear, at the edge there remains a substantial region where no field lines are able to carry out even a single poloidal turn. Thus energetic ions entering/born in this region run a high probability of being promptly lost.
Toroidal Poincaré puncture plots of the magnetic field lines in the ITER 15 MA baseline scenario when the effect of FIs, TBMs and ECCs are included. (a) In vacuum approximation, (b) including the plasma response.

4 Fast particle interactions
While the emphasis in this contribution is on the accurate following of the trajectories of almost-collisionless particles, the interest typically is in phenomena that require addressing time scales that involve interactions with other particles, most notably the background plasma. The first problem to arise here comes from the 2-D nature of the plasma equilibrium when evaluating the effect of Coulomb collisions: in the case of strong toroidal deformations the kinetic profiles do not follow the actual radial deviations of the flux surfaces. However, considering the experimental uncertainties in the kinetic profiles this is not likely to be a serious issue.
Fusion reactions in a tokamak reactor can take place via three different channels, if you will: in thermonuclear fusion the fusion rate is calculated directly from the plasma kinetic profiles and, thus, only involves the issue discussed above for the Coulomb collisions. However, in today’s tokamaks the fusion reactions are dominated by beam–plasma collisions in the case of beam-heated plasmas, or by reactions between plasma and ICRH-generated ions. The source profiles of the fast ions involved in the latter reaction channels are not toroidally symmetric and, thus, require full 3-D spatial profiles to accomplish. This is usually accomplished as a 2-step process. In the case of ASCOT, first a slowing-down simulation is carried out for ions generated by BBNBI (Asunta et al. Reference Asunta, Govenius, Budny, Gorelenkova, Tardini, Kurki-Suonio, Salmi and Sipilä2015) (beams) or ASCOT-RFOF (Johnson et al. Reference Johnson, Salmi, Steinbrecher, Eriksson, Hellsten, Höök, Schneider and Contributors2011), and the resulting fast ion distributions are fed to the AFSI (Sirén et al. Reference Sirén, Varje, Äkäslompolo, Asunta, Giroud, Kurki-Suonio and Weisen2018) fusion source code to calculate the fusion production. Also two 3-D fast ion distributions can be made interact with each other, but this channel is typically small.
The third type of interactions, relevant for fast ions at least at the plasma periphery, are the charge-exchange (CX) reactions with the neutrals. These are the most difficult to accurately model. Not only is the distribution of the neutrals, those being immune to the magnetic structures, inherently three-dimensional, but this distribution is very poorly known. Even the most sophisticated fluid codes, such as SOLPS (Schneider et al. Reference Schneider, Bonnin, Borrass, Coster, Kastelewicz, Reiter, Rozhansky and Braams2006), that model neutrals in three dimensions provide only 2-D distributions.
5 High-fidelity representation of the first wall 3-D features
Fast ion losses are not important only because they would make plasma heating less effective but also because they could cause local damage at the plasma-facing components. Therefore care has to be taken also when reconstructing the first wall and divertor regions so that they contain all relevant components at sufficient resolution. Naturally, this comes at the cost of memory, but it is not so obvious that a wall with high resolution would significantly degrade the performance of the simulation code. However, this becomes an issue when simulating species with variable weight factors, such as alpha particles, where a single marker generated in the highly reactive core can represent orders of magnitude larger population of real-life alpha particles than a marker launched at the plasma periphery. Upon reaching a plasma-facing component we refer to these ions as ‘monster ions’, since while they contribute a very high peak power load on the wall, their statistical significance is small due to the low escape probability from the centre. The situation is worsened as the resolution of the wall is increased, since the power carried by the marker is divided by ever-smaller surface area. Therefore, when increasing the wall resolution, also the number of markers should be correspondingly increased, making the simulations very CPU-intensive.
In an axisymmetric simulation, the boundary is typically represented as a segmented 2-D contour of either the last closed flux surface itself, leading to anomalously high loss rate, or the approximate shape of the limiters and the first wall. The requirements for memory and calculations to evaluate collisions with these segments are trivial, as the representation typically consists of at most some hundreds of elements, requiring a few kilobytes of data. However, in the 3-D case, the boundary typically consists of some structure based on detailed 3-D computer assisted design (CAD) drawings. Depending on the level of detail, a triangle mesh representation can consist of up to tens of millions of triangle elements, requiring gigabytes of memory. There are efficient algorithms, often originating from the 3-D graphics field, for searching for intersections between trajectories and triangles, including tree representations such as octrees or bounding volume hierarchy (BVH) trees, as used by ASCOT. However, the CPU requirements for evaluating the collisions are still greater compared to the 2-D case.
The 3-D nature of the first wall has proven to play a key role in the distribution of the wall power load, as will become clear in the next section that gives examples on fast ion simulations in non-axisymmetric environments.
6 Examples of 3-D simulations with ASCOT
To illustrate how different 3-D features of a fusion device affect the results we show results from three different ASCOT simulations. We start with simulations for DEMO, which is anticipated to have a lot simpler construction than ITER, which we will present right after. The section is finished with the ultimate 3-D device, the stellarator, with simulations of the W7-X beams. In each case, the markers corresponding to beam ions are generated using the BBNBI code (Asunta et al. Reference Asunta, Govenius, Budny, Gorelenkova, Tardini, Kurki-Suonio, Salmi and Sipilä2015) while the fusion alpha markers are generated with the AFSI code (Sirén et al. Reference Sirén, Varje, Äkäslompolo, Asunta, Giroud, Kurki-Suonio and Weisen2018). The hybrid method, described above, is used in all cases.
6.1 Fast ion power loads in DEMO
Fast ions play a key role in any fusion reactor. Hence, it is no surprise that tools like ASCOT are utilized in the design phase. A good example is the design of the European DEMO, where ASCOT has been used to study various fast ion phenomena and the results are utilized to optimize the design. The current European design for DEMO will have up to 50 MW NBI heating in the flat-top phase, while during ramp-up it may need much more auxiliary power (Vincenzi et al.
Reference Vincenzi2017). At the same time, it is expected to use different construction material (EUROFER-97) than ITER (CuCrZr). While more radiation resilient, EUROFER-97 has lower thermal conductivity and, consequently, is more vulnerable with excessive power loads. Therefore, while the first wall power limit in ITER is
 $4.7~\text{MW}~\text{m}^{-2}$
, in DEMO it is only
 $1~\text{MW}~\text{m}^{-2}$
(Wenninger et al.
Reference Wenninger, Albanese, Ambrosino, Arbeiter, Aubert, Bachmann, Barbato, Barrett, Beckers and Biel2017). Against such low tolerance for power losses, the small number of TF coils (18) appears worrisome. It must be considered that this
 $1~\text{MW}~\text{m}^{-2}$
includes all contributions, not just that of fast ions. In a reactor, the fast ion contribution can be comparable or even smaller than losses caused by radiation as shown in Wenninger et al. (Reference Wenninger, Albanese, Ambrosino, Arbeiter, Aubert, Bachmann, Barbato, Barrett, Beckers and Biel2017). Fast ion power loads do not, however, pose a serious issue since this DEMO version is designed to have a sizable outer gap, 23 cm, see figure 6, so that even with the limited number of TF coils the (unmitigated) ripple strength at the separatrix reaches only 0.8 %, as compared to the (unmitigated) ITER ripple of 1.1 %. Possible utilization of ferritic inserts, such as in ITER, are being considered. At this stage of the study, the first wall of DEMO is assumed not quite axisymmetric but symmetric with 18 sectors. Even in the final design, it is assumed not to have nearly as many features as ITER.
Figure 7 shows the mesh used in calculating the DEMO magnetic field with the COMSOL code package.
Poloidal cross-section of a DEMO design indicating the closest approach of the plasma to the wall at the high-field side and the sizable outer gap at the low-field side.

COMSOL mesh for magnetic field calculations with coils (blue), ferritic inserts (red) and plasma volume (green).

ASCOT was used to simulate both the fusion alphas and the beam ions. For the beams the latest DEMO NBI reference design (Sonato et al.
Reference Sonato, Agostinetti, Bolzonella, Cismondi, Fantz, Fassina, Franke, Furno, Hopf and Jenkins2017) was used, where the power is 16.8 MW per injector, and the acceleration voltage is 800 keV. The injectors consist of 20 modules with 60 beamlets each. In simulations with unmitigated ripple, the power loss due to alphas was approximately 450 kW and due to beams 50 kW. Introducing the ferritic inserts at their design mass reduced the beam losses to practically zero and even the alpha power down to 30 kW. It thus might not be necessary to implement as massive inserts as foreseen now, or it might be possible to even further reduce the number of TF coils. In Varje et al. (Reference Varje, Agostinetti, Kurki-Suonio, Snicker, Sonato, Särkimäki and Vincenzi2017) the effect of ferritic inserts with reduced mass has been investigated. Figure 8 shows the wall load distribution for the fusion alphas. The peak powers are observed at the first wall, not at the divertor, but they do not reach
 $1~\text{MW}~\text{m}^{-2}$
.
Illustration of the alpha power deposition profile on the first wall and divertor of the present DEMO design.

It is interesting to note that the calculated DEMO fast ion power loads are actually smaller than in ITER baseline scenario. In addition to the large plasma–wall gap, other things contributing to the smallness of the load are the high plasma current, 19.6 MA compared to the 15 MA in ITER, and less steep pedestal. However, it should be kept in mind that these simulations were carried out for MHD-quiescent plasmas. Furthermore, a study to have ECC to mitigate ELMs in DEMO is being carried out and, as we shall see, introduction of the perturbation generated by ECCs can alter the confinement, in particular of the beam ions.
6.2 Fast ion power loads in ITER
ASCOT has been used to carry out a comprehensive analysis of the effect of ferritic inserts and TBMs on the confinement fusion alphas and beam ions in ITER (Kurki-Suonio et al. Reference Kurki-Suonio, Äkäslompolo, Särkimäki, Varje, Asunta, Cavinato, Gagliardi, Hirvijoki, Parail and Saibene2016a ). The study covered four scenarios, the inductive 15 MA baseline scenario, the 12.5 MA hybrid scenario, the partially non-inductive advanced 9 MA scenario and the half-field 7.5 MA scenario. A more detailed analysis of the results can be found in Kurki-Suonio et al. (Reference Kurki-Suonio, Äkäslompolo, Särkimäki, Varje, Asunta, Cavinato, Gagliardi, Hirvijoki, Parail and Saibene2016a ), but here we focus on how 3-D features affect the power load and distribution. The losses for each scenario are summarized in table 1, separating the power arriving at the divertor (desired location) from the power arriving at the first wall. Furthermore, results are given separately for simulations where the magnetic background was calculated in the vacuum approximation and where also the response of the plasma was included. While the losses to the first wall reveal the expected result, i.e. that further breaking the axisymmetry by the introduction of the TBMs increases the power loads, a more careful study of the results helps understanding how many different things can affect the power distribution in a tokamak reactor.
Power loads to first wall and divertor in the different ITER scenarios: 15 MA baseline scenario with
 $P_{\text{fus}}=85~\text{MW}$
, 12.5 MA hybrid scenario with
 $P_{\text{fus}}=50~\text{MW}$
, 9 MA advanced scenario with
 $P_{\text{fus}}=80~\text{MW}$
and the 7.5 MA half-field scenario. The two numbers given for each case indicate ‘no plasma response/with plasma response’.

First, looking at the alpha loads, it is observed that the losses do not scale with the plasma current (which would give advanced scenario the highest alpha load) or fusion power (giving baseline the highest value), but the highest power loss is observed for the hybrid scenario. It turned out that triangularity of the hybrid plasma was somewhat stronger than for the other two fusion scenarios, reducing the plasma–wall gap at the outer midplane by approximately one Larmor radius of the fusion alphas. It is also important to realize that, in ITER, the plasma–wall gap is not a single number: the separation between the plasma and the closest first wall element varies by up to 15 cm along the toroidal direction (see figure 2 in Kurki-Suonio et al. (Reference Kurki-Suonio, Särkimäki, Äkäslompolo, Varje, Liu, Sipilä, Asunta, Hirvijoki, Snicker and Terävä2016b )).
The relative importance of the first wall structure and (basic) magnetic field structure is illustrated by figure 9 which shows the fast ions arriving at the LFS first wall both in the baseline and half-field scenarios (a), together with the toroidal field variation at the outboard midplane separatrix (b). The (mitigated) TF ripple is found to have its minima and maxima interchanged in the half-field scenario compared to the baseline case. This is because the FIs remain fully saturated even at the half of the ITER nominal TF field and, thus, overcompensate the ripple. However, the locations at which the ions intersect the wall are not altered, but the ‘2-humped’ limiter structure remains intact even in the half-field case, indicating that the structure of the first wall is here more important.
(a) The (reverse) ripple at outboard midplane for the half-field scenario, and (b) structure of losses for both 15 MA baseline and the half-field scenario with its reversed ripple. The wall structure is seen to dominate over the ripple structure of the magnetic field.

According to table 1, neither (mitigated) ripple nor TBMs compromise the fast ion confinement in any of the ITER major operating scenarios. The situation is seen to change dramatically upon introducing the ELM control coils (ECC) in the baseline scenario: the power arriving at the divertor plates is increased by orders of magnitude even when the healing of the magnetic surfaces by plasma response is taken into account (Varje et al. Reference Varje, Asunta, Cavinato, Gagliardi, Hirvijoki, Koskela, Kurki-Suonio, Liu, Parail and Saibene2016). The mechanism by which ECCs degrade the fast ion confinement is found to be different from TBMs: at the plasma periphery there appears a stochastic region that, unlike islands formed further in, is not healed by the plasma response. The stochastic field lines promptly lead energetic ions born at the edge to the divertor. The mechanisms involved are studied in more detail in Särkimäki et al. (Reference Särkimäki, Bécoulet, Liu and Kurki-Suonio2018).
It is thus important to realize that even in ITER which, in principle, represents an axisymmetric device, fast ion power loads cannot be estimated by simply considering their orbit widths, given by the nominal plasma current and particle energy, together with a nominal plasma–wall gap, but that it is necessary to include the 3-D features of both the magnetic field and the first wall.
6.3 Beam ion power loads in Wendelstein 7-X
In stellarators, axisymmetry is broken by default as illustrated in figure 10: even the poloidal cross-section of the plasma varies dramatically as a function of toroidal angle. Wendelstein 7-X is the world’s largest and most advanced stellarator. The modular coil geometry of W7-X is a result of optimization process that was only made possible by the emergence of supercomputers. The optimization was carried out with respect to good neoclassical confinement, small Grad–Shafranov shift, small bootstrap current and, maybe most importantly, good confinement of fast ions at high beta. Although non-axisymmetric, it still features another kind of symmetry: it is stellarator symmetric (Dewar & Hudson Reference Dewar and Hudson1998) with 5 toroidal periods. Wendelstein 7-X has altogether 70 coils (20 planar, 50 shaped), with 7 independent power sources, giving seven degrees of freedom. This gives flexibility in devising different magnetic configurations. One of the main goals of W7-X is to demonstrate good confinement of fast ions, which in W7-X are produced by ion heating, such as neutral beam injection. Confining beam ions would also show that fusion alphas could be well confined in a Helias-like reactor: the relative size of beam ion gyro-radius with respect to the W7-X dimensions corresponds to the same ratio of alpha gyro-radius in a foreseen reactor.
Flux surface contours of W7-X at three toroidal angles:
 $\unicode[STIX]{x1D719}=0^{\circ }$
,
 $\unicode[STIX]{x1D719}=18^{\circ }$
and
 $\unicode[STIX]{x1D719}=36^{\circ }$
(Kontula Reference Kontula2017).

Beam operation will start with two NBI injectors with two sources, each injecting hydrogen at 55 keV to hydrogen plasma. The power per source in this case is up to 1.7 MW. The beams are being commissioned, with first experiments foreseen for the summer of 2018. The beams in W7-X indeed pose a hard challenge for confinement: due to engineering constraints the beams are practically radial, and many ions are born on trapped orbits, vulnerable to losses due to the multitude of ripples in a stellarator. Beam ion losses have already been studied with the ANTS code and a simple wall (Drevlak et al.
Reference Drevlak, Geiger, Helander and Turkin2014). This work has been extended with ASCOT, using a detailed 3-D wall (
 $4\times 10^{6}$
triangles), for the W7-X reference magnetic configurations (Äkäslompolo et al.
Reference Äkäslompolo, Drevlak, Turkin, Bozhenkov, Jesche, Kontula, Kurki-Suonio and Wolf2018).
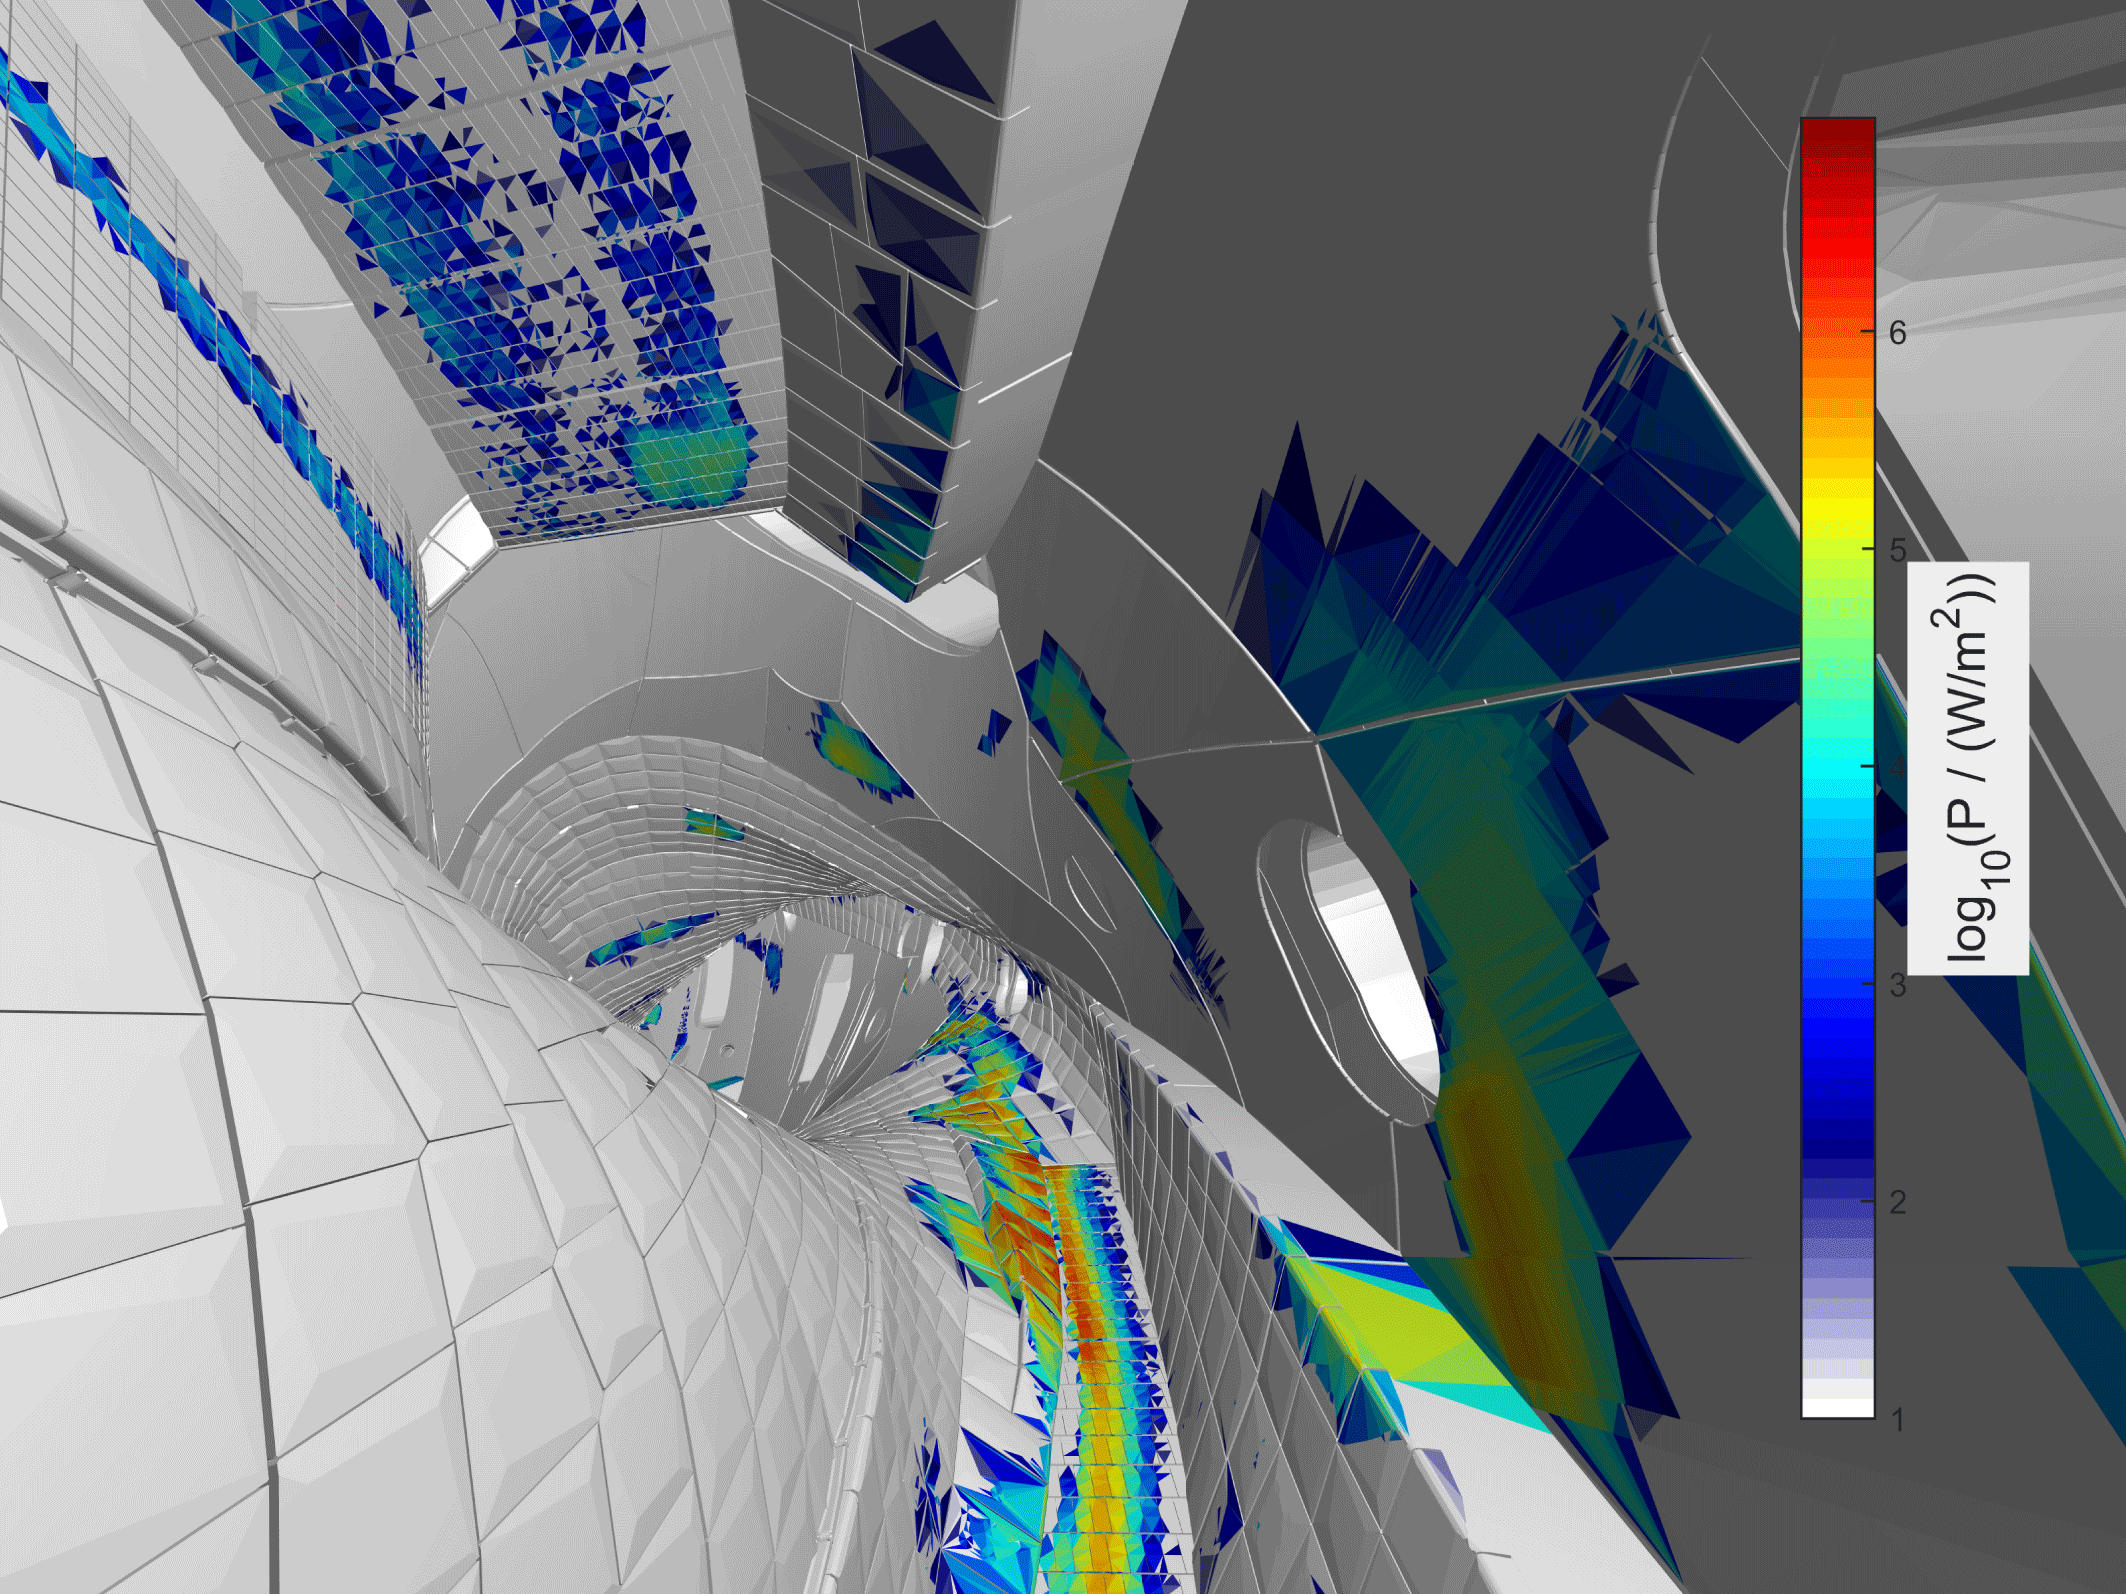
The simulations indicate wall power losses even to some sensitive wall components (made of steel), including panels and poloidal closure, pumping slits, vacuum vessel and ports. Even in the optimized scenarios, beam losses are substantial, several per cent, compared to tokamaks where they are almost negligible. The configuration with high mirror ratio appears superior for fast ion confinement, with lowest lost power fraction. Furthermore, most power goes to the high heat capacity components, divertor parts and heat shields, but non-negligible amount still lands on some vulnerable parts (figure 11). Since none of the reference scenarios appear ideal for fast ion confinement, hunt for the perfect (beam) scenario is ongoing, facilitated by the flexible coil system.
The NBI wall loads in W7-X in a specific magnetic configuration. The data are for the high statistics run described in Äkäslompolo et al. (Reference Äkäslompolo, Drevlak, Turkin, Bozhenkov, Jesche, Kontula, Kurki-Suonio and Wolf2018).
7 Conclusions on computational requirements due to 3-D structures and future prospects
The increased dimensionality can affect the computer time requirements in two ways. Firstly, the physics dictate limitations to the simulation, increasing CPU time requirements. The 3-D fields must be sampled at sufficiently high resolution to capture the physical effects, requiring shorter time steps. Likewise, collisions with the detailed 3-D wall need to be evaluated at sufficiently high resolution, complicated by the drastically larger number of elements in the representation.
Secondly, the higher resolution and consequently larger data size can degrade performance on modern supercomputers. The limited amount of memory available on a computer node can limit the number of simultaneous processes, requiring undersubscription and limiting the utilization of the full performance of the CPU. This can be alleviated by shared memory in frameworks such as OpenMP or MPI 3. The increased memory footprint also causes issues with cache utilization, which is key for getting optimal performance from modern CPUs.
With the introduction of GPU and many core architectures to scientific computing, the above memory issues become even more pronounced due to higher number of cores but lower amounts of memory per core. When utilizing these architectures it becomes increasingly necessary to adapt software to make full use of the hardware. In particular, GPU and many cores allow for efficient use of array operations. However, the limitations of these architectures in terms of available memory together with the need for finer resolved computations, call for the use of parallelization techniques, such as domain decomposition, in order to spread the load among the nodes and cores. The problem is then one of optimizing the memory load versus the communication time between units. In addition, making efficient use of the available computing power necessitates to apply load balancing techniques in order to avoid underused memory and idle cores.
Finally, the development of numerical methods consistent with the mathematical framework of Lagrangian mechanics can allow for more efficient and faithful simulations. The so-called variational integrators, which are built by discretizing the variational principle and then deriving a set of discrete equation from it, self-consistently preserve the invariants of motion with a bounded error. Indeed, as per Noether’s theorem of classical mechanics, this method yields discrete conservation equations tied to the equations of motions in a self-consistent manner. As a consequence, such integrators have very good conservation properties over long simulation times, and also allow the use of longer time steps compared to ad hoc integrators (Kraus Reference Kraus2013).
Acknowledgements
Much of this work has been carried out within the framework of the EUROfusion Consortium and has received funding from the Euratom research and training programme 2014–2018 under grant agreement no. 633053. The views and opinions expressed herein do not necessarily reflect those of the European Commission. This work was partially funded by the Academy of Finland project no. 298126. The supercomputing resources of CSC – IT centre for science as well as the computational resources provided by Aalto Science-IT project were utilized to obtain results presented here.



