


Introduction
The ice shelves of the Antarctic Peninsula are close to the climatic limit for the existence of ice shelves (Reference MercerMercer, 1978). Significant atmospheric warming, observed on both sides of the peninsula during recent decades (Reference Vaughan and DoakeVaughan and Doake, 1996; Reference Skvarca, Rack, Rott and Ibarzabal y DonangeloSkvarca and others, 1998), has been accompanied by a gradual retreat of ice shelves (Reference SkvarcaSkvarca, 1994). On the eastern side, this retreat culminated in the collapse of the sections of the Larsen Ice Shelf north of Seal Nunataks (Fig. 1) in January 1995 (Reference Rott, Skvarca and NaglerRott and others, 1996,Reference Rott, Rack, Nagler and Skvarca1998). Satellite observations indicate that, after a retreat beyond a critical limit, ice shelves may disintegrate rapidly.
RADARSAT SAR image from 18 November 1998, showing the northern tip of the Antarctic Peninsula and the northern Larsen Ice Shelf. Bold lines: ice-shelf boundary on 26 August 1993 (white) and 28 October 1995 (black). Dashed grey lines: ERS SAR frames of satellite tracks 424, 152 and 381.

The now northernmost section of the Larsen Ice Shelf, between Jason Peninsula and Seal Nunataks, also referred to as Larsen B, is in a stage of rapid retreat. On 30 January 1995, the floating area decreased in a single calving event from 11816 km2 to 9496 km2. The northern part then retreated further by a few kilometers, whereas the southern part advanced. Major retreat of the northern part was observed again in April and November 1998 (Fig. 1), and over the whole ice front in February 1999, reducing the area to about 7950 km2. Field measurements suggest that the mass balance of the northern part is no longer in equilibrium (Reference Rott, Rack, Nagler and SkvarcaRott and others, 1998). Observations in the field show an increase of rifting since 1994 (Reference Skvarca, Rack and RottSkvarca and others, 1999), a scenario similar to that observed north of Seal Nunataks before the collapse.
Using a finite-element model (FEM; Reference MacAyeal and ThomasMacAyeal and Thomas, 1982; Reference Doake, Corr, Rott, Skvarca and YoungDoake and others, 1998), efforts have been made to establish stability criteria for the Larsen Ice Shelf north of Jason Peninsula (Larsen A and Larsen B; Fig. 1). Model parameters have been chosen that approximately fit the observed surface velocities measured during several field campaigns. Complex processes of fracturing and rifting, as observed in the field, are not included in the model. According to model calculations for Larsen B, the ice-front configuration in 1995 exhibited a stable strain-rate pattern but was likely to enter an irreversible retreat if the ice front were to retreat further by a few kilometers.
To test the model output, we derived the motion field using radar interferometric data from the European remote-sensing satellite (ERS) tandem mission in 1995. Synthetic-aperture radar (SAR) interferometry enables mapping of surface displacement with high spatial resolution over large areas, helping to overcome the problem of sparse field data. As interferometry measures the displacement only in the direction of the radar beam Reference Joughin, Kwok and FahnestockJoughin and others, 1998; Reference Rignot and MacAyealRignot and MacAyeal, 1998), we use field data and tide forecasts to assist in the interpretation of the interferometrically derived velocity field, assuming a flat surface of a freely floating ice shelf.
Interferometric Measurements of Surface Displacement
Interferometric SAR measures the phase difference between two repeat-pass SAR images which are acquired from slightly different satellite positions (Reference Joughin, Winebrenner, Fahnestock, Kwok and KrabillJoughin and others, 1996). Phase differences are induced by surface topography and surface displacement in the radar look direction. The sensitivity to topography depends on the distance between satellite positions (the baseline). The altitude of ambiguity is the elevation difference which corresponds to a phase shift of 2π (one fringe). The baseline and the corresponding altitude of ambiguity are listed in Table 1 for all three satellite tracks. For ERS SAR (G-band; A = 5.66 cm), a phase shift of 2π in the scene center (incidence angle θ = 23°) corresponds to a horizontal displacement of 7.24 cm or a vertical displacement of 3.07 cm.
Characteristics of ERS-1/2 interferograms used in this study (frames 4941, 4959 and 4977)
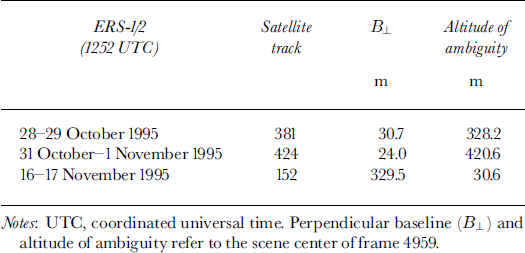
For this study we used ERS-1/2 data with a temporal baseline of 1 day acquired during the ERS tandem mission in austral spring 1995. Interferograms from the descending pass have been chosen, because the satellite track is nearly normal to the ice-flow direction for large parts of the ice shelf, and the ice shelf between Seal Nunataks and Jason Peninsula is covered by three successive satellite frames (Fig. 1; Table 1).
As an example, the interferogram of track 152 is shown in Figure 2. North of Jason Peninsula the ice shelf is divided into two zones according to the flow behavior: the stagnant part around Seal Nunataks is separated from the fast-moving part in the south by a narrow band with high velocity gradients. The main inflow to the southern part is from Hektoria and Evans Glaciers, the glaciers of Exasperation Inlet (including Crane Glacier) and the glaciers of SCAR Inlet (including Leppard Glacier). At stake S9, the difference between radar look direction and flow direction is about 11°.
ERS interferogram of 16–17 November 1995 (satellite track 152, frames 4941,4959 and 4977), betweenjason Peninsula and Seal Nunataks (Larsen B). Points mark stake positions of the S and T profiles. IR, ice rise; Bu, Bull Nunatak; RI, Robertson Island; CD, Cape Disappointment. Radar look direction (range) and satellite flight direction (azimuth) are indicated by arrows.

The boundary between the section at Seal Nunataks and the main part is marked by a close sequence of 9–10 fringes. The fringe pattern between the ice rise (IR) and Bull Nunatak (Bu) is discontinuous, indicating a zone of heavy rifting. Near the ice front, fringe discontinuities indicate rifts, which cut completely through the ice, causing horizontal and/or vertical shifts. These rifts played a dominant role in the calving event in November 1998, which occurred several days before the RADARSAT image in Figure 1 was taken.
To obtain surface velocities from the interferogram, the 2π phase ambiguity was solved by using a least-squares unwrapping algorithm with iterative error correction (Reference SiegelSiegel, 1999) and precise orbit information. To correct for the orbit errors, tie points on the western sides of Seal Nunataks just above the grounding zone were used, where the horizontal and vertical motion can be assumed to be zero. The orbit corrections are small; for example for track 381 the correction corresponds to a phase shift of 2π across the whole image.
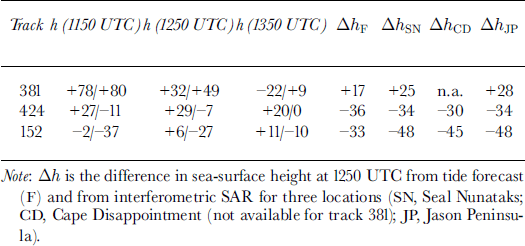
In order to derive the horizontal displacement from the interferogram, it was necessary to subtract the tidal motion. The vertical displacement Ah was derived from the phase shifts in those parts of the tidal flexure zones for which the horizontal motion is negligible.
Zones of tidal flexure are clearly visible at the margins of the freely floating parts of the ice shelf. Table 2 shows the difference in sea-surface height, derived for each tandem pair for Seal Nunataks, Gape Disappointment and Jason Peninsula, in comparison to the forecast values available for Larsen Nunatak. The height difference for track 152 may be slightly affected by topography, due to the large baseline and the high surface slope in the grounding zones. Topography does not play a role for the other two pairs, because of short baselines. The interferometric Ah for tracks 152 and 424 showed only very small differences between the northern and southern boundaries of the ice shelf, so constant vertical displacement could be assumed over the whole ice shelf. According to the tidal forecast, the water level was changing most rapidly on 28–29 October 1995 and was fairly stable on 31 October-1 November 1995, when the forecast compares well with interferometry This suggests that spatial differences of vertical displacements due to outflow of water should affect mainly the interferogram of track 381.
Height of sea surface, h (cm), above mean sea level, predicted by tidal forecasts for Larsen Nunatak during ERS SAR data acquisition (day 1/day 2)
If two interferograms are combined by means of differential techniques, tidal effects are enhanced or weakened, depending on the sign of surface height difference. For example, the differential interferogram of track 381 vs track 424 shows enhanced tidal effects in the ― 3 km wide zone of the grounding line, whereas the fringes cancel out almost completely beyond that distance. This confirms the assumption that the ice shelf beyond this distance is freely floating and the interferogram is affected by comparable small differential tides only.
Interferometry vs Field Measurement
Ice velocity was measured in situ by means of differential global positioning system in November 1994, October 1996 and October 1997 at several points shown in Figure 2. The transverse S profile extends over 80 km between Gray and Lisignoli Nunataks. The longitudinal 50 kmT profile was set up in 1996 upstream of stake S9 along the central flowline of Crane Glacier in an area with small velocity gradients.
The S profile is covered by tracks 152 and 381. Taking stake S9 as zero reference for the interferometric velocity satellite-derived velocities differ from –2.4 to +8.4 cm d–1 from field observations for track 152, and from –6.2 to + 11.6 cm dȡ1 for track 381. To be independent of absolute velocity values, we also compared the strain rates. The coordinate system is defined by the radar geometry shown in Figure 2 (x, ground range; y, azimuth direction).
The shear strain rate
 is calculated between stakes by

where ω is the velocity component in the x direction at the stake. Interferometrically derived velocities were averaged over an area of about 1 × 1 km2 around each stake before applying Equation (1). Figure 3a and b show the interferometric velocity and
 respectively, for the tandem pair of satellite track 152 in comparison to field measurements between October 1994 and 1997. Table 2 implies the same change of sea-surface height at Seal Nunataks and Jason Peninsula (-48 cm). Taking SI as reference point for velocity, the horizontal velocity derived from interferometry should exactly fit to the field-measured value at S17. The difference in horizontal motion of+5.6 cm d–1 at S17 would correspond to 2.2 cm vertical displacement between SI and S17 if the difference results from an error in the estimation of the tidal displacement. Under this assumption the interferometric velocity profile was modified, applying a linear phase ramp which leads to the adjusted curves shown in Figure 3. This adjustment seems justified for comparing the interferometric strain rates with the model output, reducing short-term tidal effects which are not covered by the model.
(a) Horizontal velocity and (b) shear strain rates at the S profile from field measurements (1994–97) and 1 day interferometry (satellite tracks 152 and 381). Squares on dashed line: adjusted satellite measurements for track 152 with SI as zero reference.
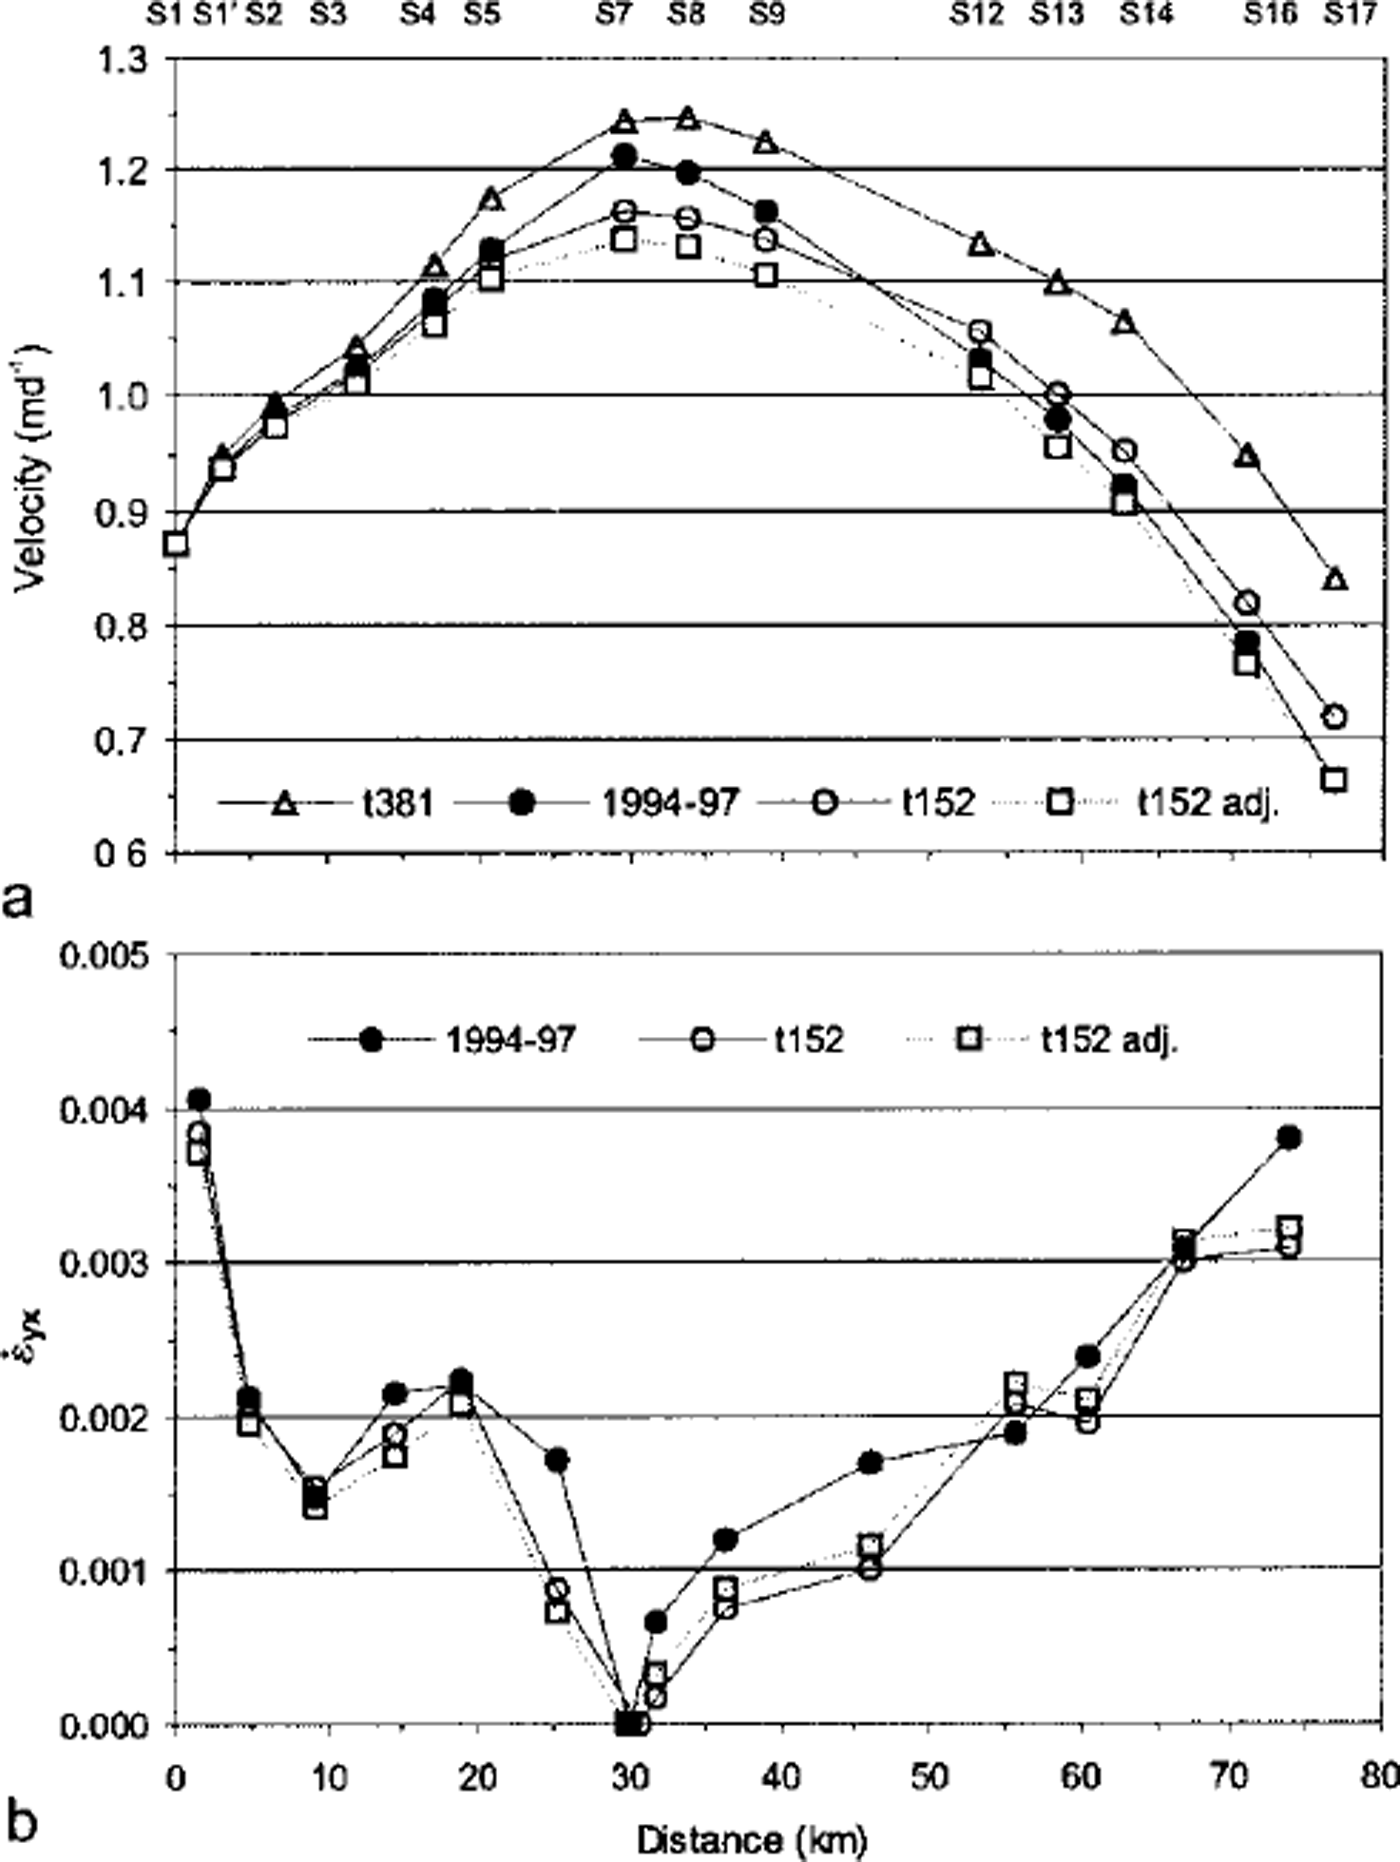
The same analysis for satellite track 381 reveals a difference of 17.8 cm dȡ1 in horizontal velocity, corresponding to 7.6 cm vertical displacement. This larger difference can be explained by larger uncertainties in the estimation of the tidal effects because of stronger differential tides (Table 2).
After the adjustment, field velocities in the central part of the profile (stakes S7, S8 and S9) are 2.8% and 5.8% above those of tracks 381 and 152, respectively. For both satellite tracks, values of
 are on average within 15% of the longterm values. The highest negative deviations occur in the central part. The observed differences in strain rates and velocities may be partly due to acceleration after October 1995, probably caused by rifting, as the observation period of the field measurements extends until October 1997. This is concluded from field measurements, which show an increase in velocity of about 13% in the central part and about 8% at the margins for the periods 1988–94 to 1994–97.
A continuous
 profile was derived from interferograms by
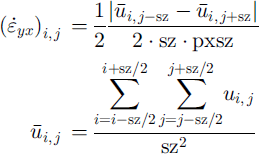
using a box size sz = 13 for a pixel size pxsz = 74.3 m in azimuth direction. One transverse profile is plotted in Figure 6a (shown later), showing the high strain rates at the margins of the ice shelf. The stakes of the S profile are just outside of zones with maximum shear.
Horizontal velocities and the corresponding longitudinal strain rates along theT profile are plotted in Figure 4a and b. Velocities of tracks 152 and 424 are slightly lower than the field measurements; those of track 381 are slightly higher. This is probably due to the opposite sign of the tidal motion for track 381 compared to tracks 152 and 424 (Table 2). Taking Tl as reference, the velocities from tracks 152 and 381 are within –1.4 to +2.3 cm d–1 compared to the field measurements for 1996–97. The best fit to field-observed values is obtained by averaging tracks 152 and 381, because of the opposite tidal motion. At the S profile, averaging yields only partly to an improvement from SI to S9. The reason may be the change in differential tides from north to south for track 381.
(a) Horizontal velocities and (b) longitudinal strain rates along the T profile from field measurements (1996–97) and 1 day interferometry. Stake T1 is taken as zero reference/or the interferometric velocities.

Interferometry vs Numerical Model
Ice velocities were calculated using a FEM with an ice-shelf configuration from October 1995. The motion field was then transformed to a synthetic interferogram taking the velocity components in ground range. As the interferogram of track 152 compares best with field measurements and the possible corrections are small, we used an uncorrected version for the comparison with the synthetic interferogram.
The first model used is described by Reference Doake, Corr, Rott, Skvarca and YoungDoake and others (1998). Closer agreement to interferometry was obtained by a second model using interferometrically derived input velocities. After that, different temperature distributions were used to obtain better agreement with interferometry in the shear zones. Field measurements were used only to guide the boundary conditions.
Figure 5a and b show the interferogram of track 152, frame 4959, and the corresponding synthetic interferogram derived from velocities of the FEM. The most striking differences at rifts and strong shear zones become visible in the differential interferogram in Figure 5c. The ice rise (IR) in the northern part is not yet included in the model. However, it plays an important role in the ice dynamics at the boundary to the stagnant part around Seal Nunataks. Another heavy rifted zone is the area northwest of Gape Disappointment (CD), which is not resolved by the model. Good agreement is found over the large central and southwestern interior parts.
(a) Real interferogram (16–17 November 1995) and (b) synthetic interferogram for ERS track 152, frame 4959, from model velocities. The differential interferogram (a)–(b) is shown in (c). IR, ice rise; CD, Cape. Disappointment; JP, Jason Peninsula.

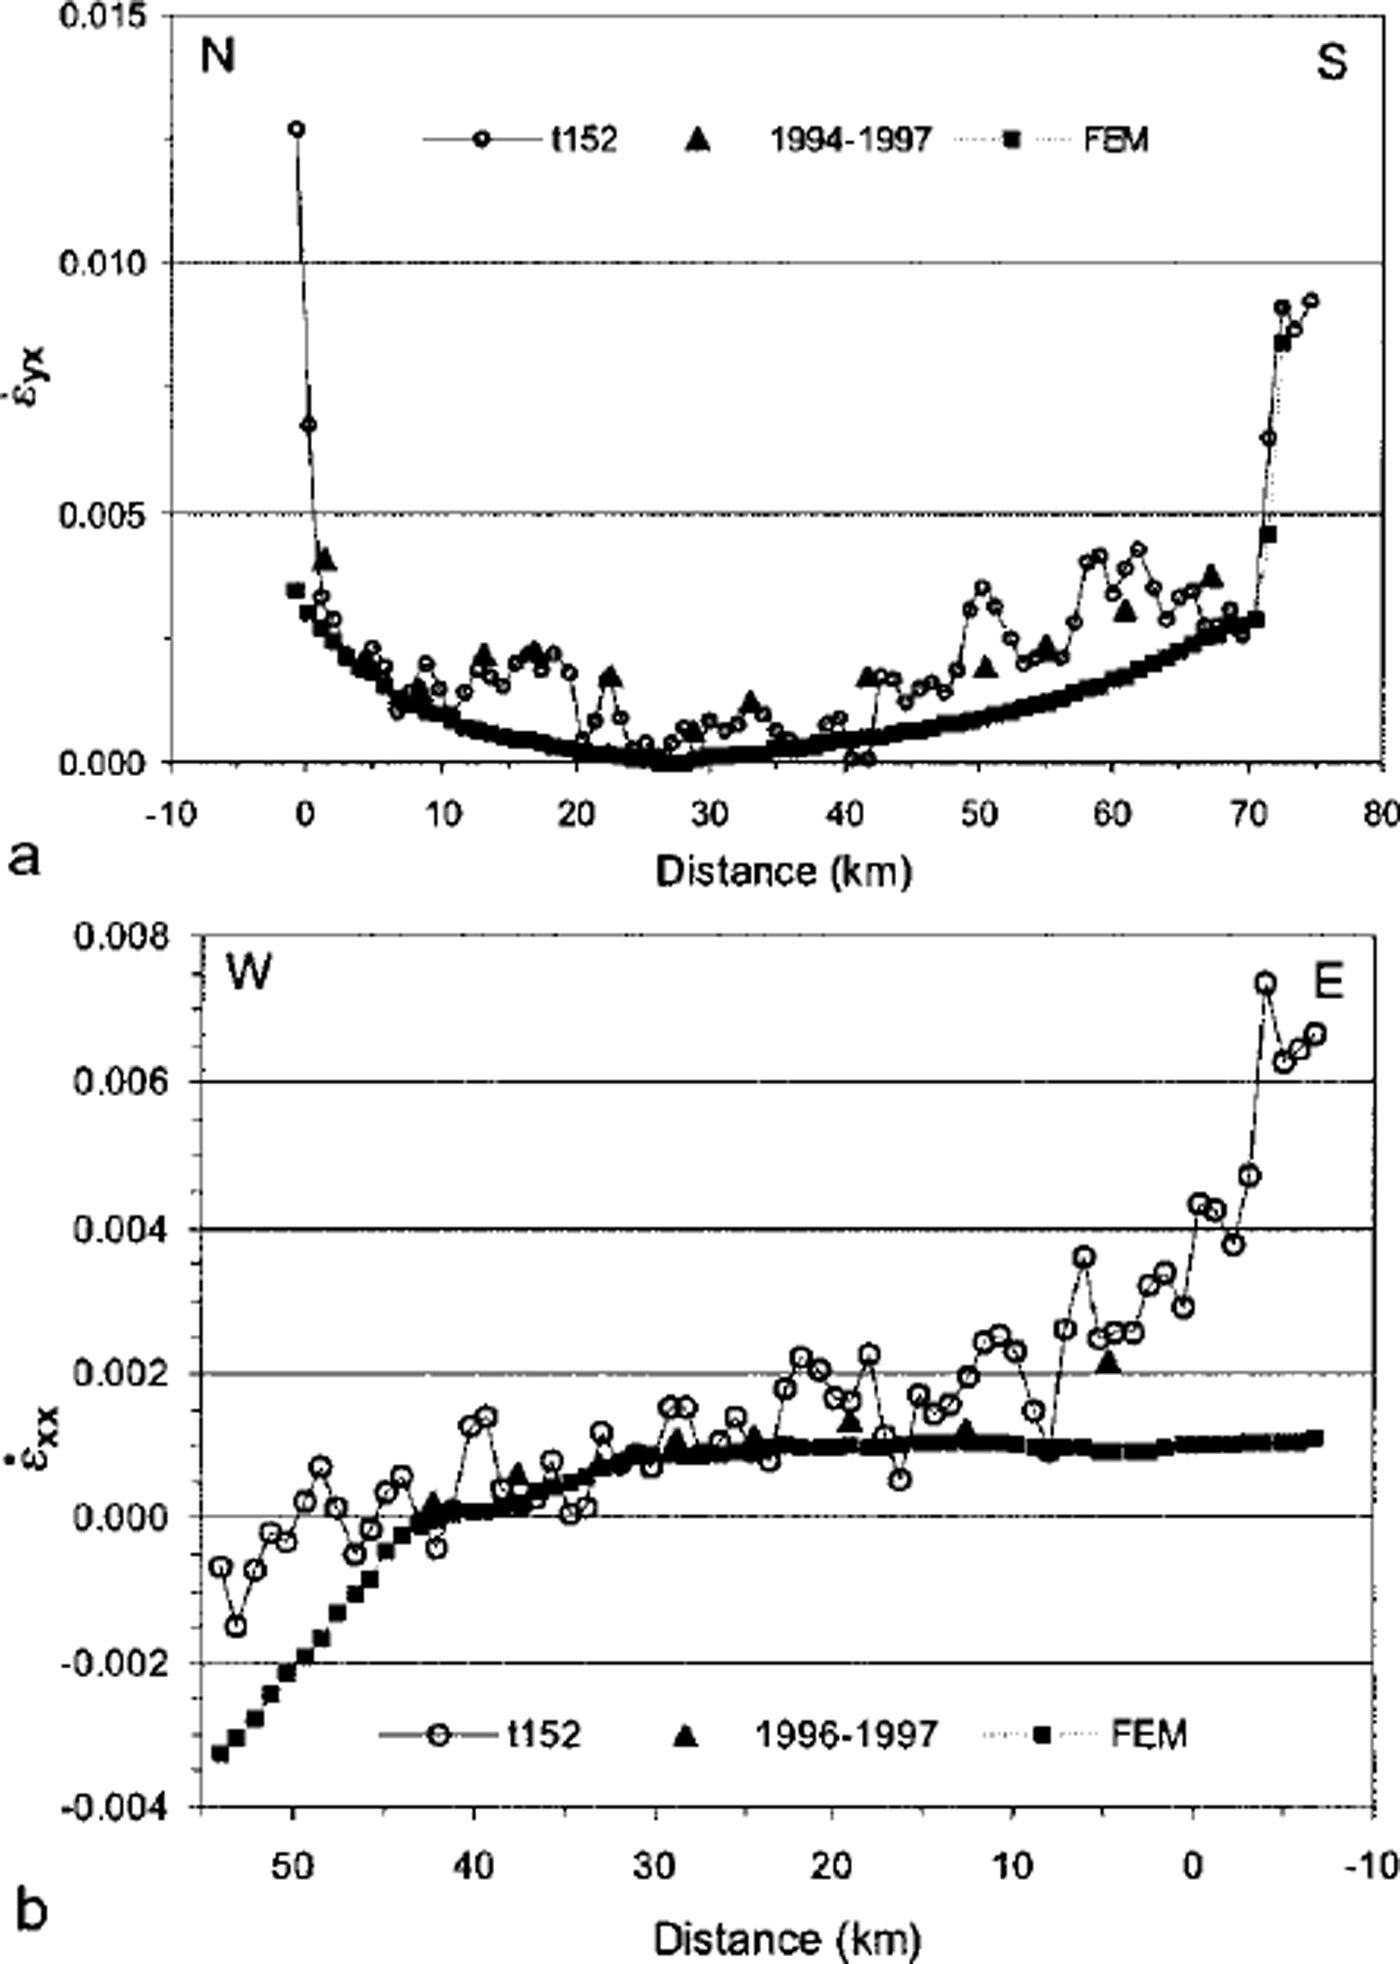
A comparison of field measurements, interferometry and model output along two lines (passing through the start and end points of the S andT profiles, respectively) is shown in Figure 6. The modeled shear strain rates (Fig. 6a) are below the observed values. The sharp transition to the strong shear zones is well developed in the south but is weak in the north, probably because the ice rise is missing in the model. The longitudinal strain rates (Fig. 6b) are in good agreement with the measured values in the central part of theT profile but are much lower near the ice front. The increase of the observed strain rates near the ice edge is probably caused by the rifting process.
Comparison between the strain rates of field measurements, interferometry (satellite track 152) and FEM calculation^ (a) the transverse Sprofile and (b) the longitudinal T profile. Distances are measured from stake SI for (a) and from stake S9for (b).
Conclusion
ERS radar interferograms provide the motion field of the northern Larsen Ice Shelf with great detail. As the interferogram represents only the displacement in line-of-sight of the radar, it is necessary to subtract the tidal displacement in order to obtain the horizontal motion. The vertical displacement of the ice shelf was inferred from the phase shifts at nunataks with good accuracy. This is concluded from the good agreement between the horizontal velocities from field measurements and interferometry.
Velocities of a FEM, calculated for the ice-shelf configuration in October 1995, were transformed to a synthetic interferogram and compared with measured velocities. In the main part of the ice shelf the strain rates are in good agreement with the field measurements and interferometric data. Significant differences are detected in shear zones at the boundaries, which are not yet resolved by the model. Differential interferograms show that these large differences cannot be explained by tidal flexure.
The spatially detailed interferometric data provide a good basis for improving the input to ice-dynamic models and validating the model output. In particular, interferometry is the best method to resolve details of the flow behavior at the transition zones of grounded and floating ice. Such details will be considered in future model runs for Larsen B, in order to advance understanding of the dynamic behavior of retreating ice shelves.
Acknowledgements
This work is a contribution to the Austrian Science Fund (FWF) project No. 12923 GEO and the Larsen Ice ShelfProject of Institute Antartico Argentino, Direccion Nacional del Antartico. The ERS SAR data were kindly made available by the European Space Agency for the experiment AO3.A108 (VECTRA). We express our thanks to E. Dono-frio of Servicio de Hidrografia Naval, Armada Argentina, for providing the tidal forecast.



