1. Introduction
The class imbalance problem (or so-called imbalanced data learning problem) is one of the main challenges in the machine learning community. This problem occurs when one class has a large number of instances (called the majority class) while the other has only a few (called the minority class) (Maloof Reference Maloof2003; Guo and Viktor Reference Guo and Viktor2004; He and Garcia Reference He and Garcia2009). In this case, most machine learning algorithms tend toward the majority class and ignore the minor one (Kübler, Liu and Sayyed Reference Kübler, Liu and Sayyed2018). This problem arises from the fact that machine learning algorithms need a balanced training data to learn an ideal model. This is because they attempt to minimize the overall error rate on the training data and assume that all misclassification errors have equal costs. Therefore, such algorithms will have difficulty in recognizing the minority class documents (Japkowicz and Stephen Reference Japkowicz and Stephen2002; Chawla, Japkowicz, and Kotcz Reference Chawla, Japkowicz and Kotcz2004).
Many approaches have been proposed to deal with the class imbalance problem in text classification: for example, instance weighting (Sun et al. Reference Sun, Lim, Benatallah and Hassan2006; Sun, Lim, and Liu Reference Sun, Lim and Liu2009), cost-sensitive learning (Liu and Zhou Reference Liu and Zhou2006), resampling techniques including oversampling and undersampling (Chawla, Bowyer, Hall and Kegelmeyer Reference Chawla, Bowyer, Hall and Kegelmeyer2002; Chen, Lin, Xiong, Luo and Ma Reference Chen, Lin, Xiong, Luo and Ma2011; Iglesias, Seara Vieira and Borrajo Reference Iglesias, Seara Vieira and Borrajo2013), and term weighting (Liu, Loh, Kamal and Tor Reference Liu, Loh, Kamal and Tor2007; Naderalvojoud, Sezer and Ucan Reference Naderalvojoud, Sezer and Ucan2015; Haddoud, Mokhtari, Lecroq and Abdeddaïm Reference Haddoud, Mokhtari, Lecroq and Abdeddaïm2016). This paper tackles this problem by using a term weighting strategy, in which documents are represented by relying on the terms’ local frequency and class-based weights. The class-based weights indicate the degree of relatedness of terms with respect to document classes. The objective is to highlight the documents of the minority class and make a distinction between the minority and majority classes. At this point, term evaluation metrics play an important role in document indexing because they change the representation of documents in the vector space according to the class-based weights. However, the imbalanced distribution of documents does not allow metrics to perform a fair class-based evaluation over terms. This problem is addressed in this paper, in which the weaknesses of the four common term evaluation metrics—namely, chi-square (χ 2), information gain (IG), odds ratio (OR), and relevance frequency (RF)—are investigated in imbalanced circumstances. Four novel alternative metrics are then proposed: each metric is an alternative for a particular common metric where data are imbalanced.
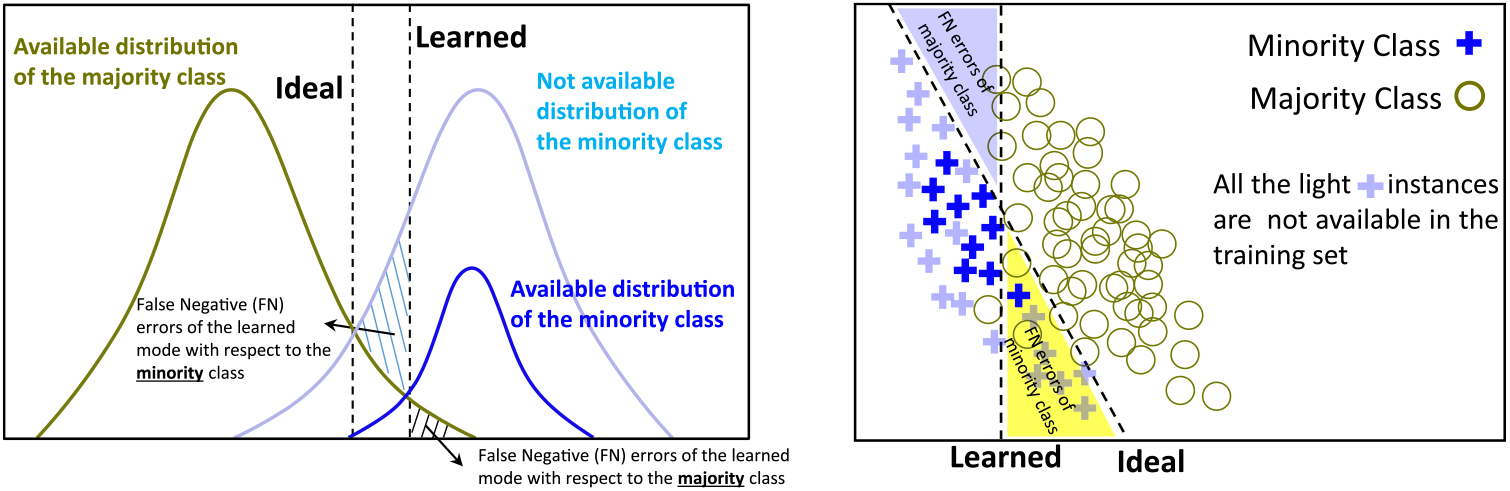
Figure 1 depicts the class imbalance problem mentioned in this paper. The left diagram indicates the distributions of the minor and major classes on the training data using the blue and green curves, respectively. The linear model learned using these two distributions is shown by the right dashed line. However, the distribution of the minor class is too limited, so the learned model is biased toward the majority class. In this diagram, the light blue curve shows the actual distribution of the minority class that is not completely available in the training data. If this actual distribution were known, the ideal model would become the left dashed line shown in this diagram. The changes in the false negative (FN) errors of the learned model can be seen in Figure 1 when moving to the ideal model. While the number of FN errors of the major class increases in the ideal model, the same error decreases substantially in the minor one, so that they reach a balanced situation. Moving from the learned model to the ideal model leads to fewer FN errors for the minority class and it may result in increasing the prediction accuracy. In other words, the tendency to the majority class should be eliminated to increase the prediction accuracy for the minority class. The same situation can be seen in the right diagram, which uses data points in the instance space. In this study, our goal is to highlight the minor class and differentiate it from the major one by representing documents using class-based term evaluation metrics. This approach attempts to decrease the influence of the majority class and shrink the error region between the minor and major classes.
Distribution of the minority class in contrast to the majority one. FN errors of the minority and majority classes are shown for learned model.

The rest of the paper is organized as follows. Section 2 reviews weighting and indexing methods in text classification. The common class-based term evaluation metrics are investigated in Section 3. We describe our proposed metrics in Section 4 and report the experimental results in Section 5. Finally, Section 6 presents our conclusions and future work.
2. Related work
In text classification, term weighting is used for document representation (also known as document indexing). In the vector space model (VSM), a document is represented as a vector that comprises a set of unique terms without regard to grammatical issues or the order of the terms. Here, each element of the vector is known as an input attribute, and its value indicates its contribution to the document:
 $d = \{ {w_1}, \ldots ,{w_k}\} $
, where w i is the weight of the ith term and k is the size of the attribute set (Lan et al. Reference Lan, Sung, Low and Tan2005). In a simple form, a document is represented by term frequency (tf):
 $d = \{ t{f_1}, \ldots ,t{f_k}\} $
. In the tf representation, two documents having similar terms may have different similarities. Therefore, this representation might be more accurate than the binary one, in which only the occurrence of terms is considered (Lan et al. Reference Lan, Tan, Su and Lu2009). However, tf is a local parameter, and a vector with tf weights reflects local features of a document in the data space. In this case, if all classes have a sufficient number of documents, tf -based indexing/weighting can provide a more discriminating representation for documents of different classes. However, in imbalanced data sets, tf may not differentiate the document distribution of the minority class from the majority class in the VSM.
As an alternative solution, the tfidf term weighting approach (Salton and Buckley Reference Salton and Buckley1988; Soucy and Mineau Reference Soucy and Mineau2005) was used to deal with the class imbalance problem in many studies (Robertson Reference Robertson2004; Ren and Sohrab Reference Ren and Sohrab2013; Taşcı and Güngör Reference Taşcı and Güngör2013; Trstenjak et al. Reference Trstenjak, Mikac and Donko2014). In this approach, the inverse document frequency (idf), as a collection frequency component, is multiplied by tf in the document indexing (Salton and Buckley Reference Salton and Buckley1988). The idf value of term t is calculated by Equation (1).
 $$idf(t) = \log \frac{N}{{{n_t}}}$$
where N denotes the number of documents in the whole collection and n t is the number of documents in which term t occurs at least once. The idf takes into consideration those terms that occur rarely in the document collection. It assumes that, if a term frequently occurs across all documents, it cannot be considered an important term in the collection. Even though tfidf does not take into account the class membership in documents, it performs well on imbalanced data sets. In imbalanced data sets, because the minority class contains far fewer documents in the collection, most of the terms belonging to this class would possess high idf values. Therefore, the tfidf method highlights the minority class documents from the collection and consequently improves the performance of classification algorithms.
However, the problem of the idf parameter is that it assigns the same weights to terms that occur in different classes. Hence, some other studies (Lan et al. Reference Lan, Tan, Su and Lu2009; Deng et al. Reference Deng, Luo and Yu2014; Domeniconi et al. Reference Domeniconi, Moro, Pasolini and Sartori2015; Ko Reference Ko2015) focused on the category-based term weighting approach to improve the performance of text classification. In such supervised approaches, feature selection metrics have been used in the term weighting scheme instead of idf. Their results indicated that category-based metrics can be more effective than idf in text classification. However, not all feature selection metrics provide more satisfactory results than idf, especially in imbalanced cases (Debole and Sebastiani Reference Debole and Sebastiani2004; Naderalvojoud et al. Reference Naderalvojoud, Bozkir and Sezer2014).
While many studies have been conducted using document indexing-based approaches, Ren and Sohrab (Reference Ren and Sohrab2013) have proposed a class-indexing-based term weighting to improve the performance of text classification in different circumstances. This approach addresses the inverse class frequency and inverse class space density frequency (ICS δF) in the term weighting scheme and incorporates them into the tfidf method. In another study (Kim and Kim Reference Kim and Kim2016), document probabilistic models such as naive Bayes and multinomial term models have been employed in the term weighting scheme.
As noted above, many other approaches have been proposed to handle the class imbalance problem, but we restrict our attention to those for which term evaluation functions (TEFs) can improve performance. For instance, oversampling is known to be an effective solution in this domain. However, generating synthetic training samples, using simple techniques such as random duplicates, has little influence on the performance of machine learning algorithms. Moreo et al. (Reference Moreo, Esuli and Sebastiani2016) proposed a distributional random oversampling (DRO) technique that outperforms state-of-the-art methods such as SMOTE (Synthetic Minority Oversampling Technique) (Chawla et al. Reference Chawla, Bowyer, Hall and Kegelmeyer2002). The advantage of DRO is that it can generate new examples based on particular parameters that are calculated using a particular TEF. A similar approach is used in Sun et al. (Reference Sun, Lim, Benatallah and Hassan2006) to select a subset of the majority class (in other words undersampling the majority class) to reach the desired level of balance. In this approach, the representativeness of each document in the majority class is calculated based on the discriminative power of terms. These two approaches show the importance of TEFs in resampling techniques, which is also the contribution of this paper. More recently, manifold-based synthetic oversampling approaches have received more attention in the literature (Bellinger, Drummond, and Japkowicz Reference Bellinger, Drummond and Japkowicz2018).
In addition, resampling techniques can be employed in some algorithmic-based methods such as ensemble and active learning. These two approaches transfer the data resampling stage into the training process and benefit from the advantage of resampling in ensemble and active learning algorithms. For example, Bloodgood (Reference Bloodgood2018) investigated different data selection strategies in SVM-Active Learning algorithm to handle the imbalance problem. In such cases, document indexing methods can influence the performance of selection strategies. In another study, multiple SVM classifiers were trained over the whole minority class and multiple subsets of the majority class separately, and combined using an ensemble method (Awasare and Gupta Reference Awasare and Gupta2017). In such methods, different clustering techniques are applied to the majority class. In this case, TEFs can be used as a criterion in determining the characteristics of each cluster.
In this paper, we introduce five TEFs that can be used in different approaches to improve the performance of imbalanced text classification. However, we evaluate the effect of our proposed metrics on document indexing, as this is the basic and inevitable step in all machine learning algorithms. Therefore, we do not need to apply any extra preprocessing steps to observe how well the proposed metrics improve the performance of machine learning algorithms.
3. Class-based term evaluation metrics
In text classification, feature selection is employed to reduce the dimension of the input data by selecting more discriminating features. Feature selection metrics based on probability and information theory compute the relevance (or irrelevance) power of terms with respect to a certain category (Zheng et al. Reference Zheng, Wu and Srihari2004; Yang et al. Reference Yang, Liu, Zhu, Liu and Zhang2012; Yin et al. Reference Yin, Ge, Xiao, Wang and Quan2013; Uysal Reference Uysal2016). Hence, using these metrics instead of idf seems reasonable in document indexing (Domeniconi et al. Reference Domeniconi, Moro, Pasolini and Sartori2015; Ko Reference Ko2015). However, most of them suffer from the class imbalance problem, so they cannot distinguish between the minor and major classes when documents are represented based on these metrics. This section investigates these weaknesses over four common term evaluation metrics where the class distribution is imbalanced.
We use some special terms and expressions in the rest of this paper as follows. For a given term t and category k (1) relevant documents means the documents in which term t occurs at least once; (2) relevant terms are all the words that occur mostly in the documents of category k; (3) irrelevant terms are all the words that very rarely occur in the documents of category k; (4) discriminating terms are all the words that can distinguish documents of category k from the others. This means that both relevant and irrelevant terms can be considered as discriminating terms.
3.1 Chi-square
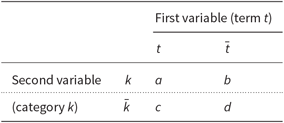
In statistics, the chi-square (χ 2) test is used to determine whether there is a significant association between two categorical variables (McHugh Reference McHugh2012). This approach is used in feature selection to measure the association of a certain term with a particular category. This type of chi-square test is accomplished by a binary contingency table, Table 1, when only two nominal values are available for each variable.
General notation for binary contingency table

In Table 1, a, b, c, and d denote the number of instances/documents corresponding to the variable values and N denotes the number of all instances in the whole collection. This notation will be used in all the other metrics that will be described later. From the binary contingency table, the chi-square metric is calculated by Equation (2) (Ko, Park, and Seo Reference Ko, Park and Seo2004; Zheng et al. Reference Zheng, Wu and Srihari2004; Domeniconi et al. Reference Domeniconi, Moro, Pasolini and Sartori2015):
 $${{\chi ^2}(t,k)} { = \frac{{N{{[P(t,k)P(\bar t,\bar k) - P(t,\bar k)P(\bar t,k)]}^2}}}{{P(t)P(\bar t)P(k)P(\bar k)}}} \\ { = N\frac{{{{(ad - bc)}^2}}}{{(a + c)(b + d)(a + b)(c + d)}}}$$
(2)
The probabilities of Equation (2) are interpreted on a collection of documents. We only explain one of them as an example:
 $P(t,\bar k)$
indicates the occurrence probability of term t in a random document that does not belong to category k. On the other hand, P(t) is the probability of term t and P(k) is the probability of category k.
However, this metric suffers from imbalanced class distribution. In other words, it cannot effectively evaluate terms with respect to the minority class. In such classes, the values of a, b, and c are much smaller than d. Under this condition, small changes in the values of a, b, and c cannot make a significant impact on the chi-square value. This is important because, in practice, large changes may not be observed in the distribution of relevant and less relevant terms of the minority class. In other words, the value of d mitigates the effect of changes in the values of a, b, and c when two relevant and less relevant terms are compared by the chi-square metric. This means that chi-square cannot make a clear distinction between the relevant terms with different levels (e.g., strong, medium, or weak) in the minority class. In Section 4.1, we will demonstrate that the chi-square metric cannot produce appropriate weights for strongly relevant terms of the minority class.
3.2 Information gain
In text classification, IG selects features or terms that provide more information on the membership relation between categories and documents. In this case, IG is computed by Equation (3) (Zheng et al. Reference Zheng, Wu and Srihari2004) for two random variables t i and k j, which denote the ith term in the feature set and the jth category in the document set, respectively.
 $$IG({t_i},{k_j}) = \sum\limits_{k \in \{ {k_j},{{\bar k}_j}\} } \sum\limits_{t \in \{ {t_i},{{\bar t}_i}\} } P(t,k)\log \frac{{P(t,k)}}{{P(t)P(k)}}$$
Although IG can identify the discriminating terms for text classification, it cannot make a fair evaluation of the relevant terms of the minority class. To clarify this issue, we look at IG when it is used to make a decision tree.
In a decision tree, IG measures the quality of each feature or term in splitting documents with respect to a particular category, where the presence or absence of each one is considered (Yang and Pedersen Reference Yang and Pedersen1997; Zheng et al. Reference Zheng, Wu and Srihari2004; Lee and Lee Reference Lee and Lee2006). IG uses two types of entropy—namely parent and children—to determine which terms in the feature set can better distinguish documents of a certain category from the others. Here, entropy measures the impurity level of samples through the given category. Each category splits documents into two groups according to their class membership. Thus, documents that are uniformly distributed between these two groups will possess a high entropy value. For term t, which is the ith feature in the feature set, and category k, IG is calculated by Equation (4).
 $$IG(t,k) = E(D) - \sum\limits_{v \in \{ t,\bar t\} } \frac{{|\{ d \in D|{f_i} = v\} |}}{{|D|}}E(\{ d \in D|{f_i} = v\} )$$
In Equation (4), D is the document set, f i denotes the ith feature, and ν is its value or weight in document d. In this equation, the parent entropy E(D) is calculated as
 $\sum\nolimits_{i \in \{ k,\bar k\} } \sum - P(i)\log P(i)$
. By splitting documents based on the presence and absence of term t, the children entropy is obtained from
 $\sum\nolimits_{v \in \{ t,\bar t\} } P(v)E(D|v)$
. It indicates the impurity of the corresponding document subsets (documents in which term t has occurred or has not occurred) and shows how well documents of each subset are distributed with respect to category k. A large difference between the parent and children entropies leads to a high IG value and it shows that the given term is a good feature to distinguish category k from the others. In a balanced case, where we have the same number of samples for the two groups of data, the parent entropy yields the maximum value of 1. In this case, a less impure class distribution in each of the child subsets can demonstrate that term t is a strong discriminating feature with respect to category k. In other words, when the child subsets are less impure, they will have a low entropy that leads to a high IG value. However, in an imbalanced case, the difference between parent and children entropies cannot be large for relevant terms. In this case, the parent entropy always has a low value for the minority class and each of the child subsets is less impure for relevant terms. Therefore, both the parent and children entropies will have low values, so that the difference between them cannot clearly distinguish between the relevant terms of the minority class.
3.3 Odds ratio
In statistics, if the probability of an event is p, the odds or chance of the occurrence of that event is calculated as p / (1 − p). The OR is taken into account when the odds of occurrence of two different events are compared. In text classification, the OR compares the odds of term t occurring in two groups of documents belonging or not belonging to category k, as in Equation (5) (Liu, Loh and Sun Reference Liu, Loh and Sun2009):
 $$OR(t,k) = \log \frac{{odds(t,k)}}{{odds(t,\bar k)}} = \log \frac{{P(t|k)/[1 - P(t|k)]}}{{P(t|\bar k)/[1 - P(t|\bar k)]}} = \log \frac{{ad}}{{bc}}$$
he main idea is to measure the difference (ratio) between distributions of term t in the documents belonging and not belonging to category k. According to this difference, OR determines whether a term is relevant, irrelevant, or neutral with respect to category k by producing positive, negative, and zero weights, respectively. However, it suffers from imbalanced distribution of classes. In this case, when OR evaluates terms based on the minority class, it will classify most terms as relevant, because the value of d is much larger than the other document frequencies, a, b, and c shown in Equation (5). In other words, OR cannot make a proper distinction between relevant and irrelevant terms.
3.4 Relevance frequency
RF (Lan et al. Reference Lan, Tan, Su and Lu2009) is another strong term evaluation metric. Unlike the previous metrics, RF only considers the distribution of relevant documents and assumes that increasing or decreasing the distribution probabilities of irrelevant documents (
 $P(\bar t,k)$
and
 $P(\bar t,\bar k)$
) cannot have any impact on the discriminating power of terms (Lan et al. Reference Lan, Tan, Su and Lu2009). In other words, adding or deleting documents that do not contain term t does not affect a term’s quality. According to this sense of term evaluation, the RF metric is formulated as in Equation (6):
 $$RF(t,k) = \log \left[ {2 + \frac{{P(t,k)}}{{P(t,\bar k)}}} \right] = \log \left[ {2 + \frac{{a/N}}{{c/N}}} \right] = \log \left[ {2 + \frac{a}{{\max \{ 1,c\} }}} \right]$$
The problem of the RF metric is that it does not know the imbalance ratio, because it ignores the values of b and d. Two terms with two different values of a and c, such that the ratio of a to c is the same for each term, will have the same importance in the minority class. For example, RF calculates the same weights for two terms having document frequencies (a = 1, c = 1) and (a = 20, c = 20).
4. Proposed term evaluation metrics for imbalanced texts
Two main problems are observed in all of the metrics presented above. The first is that the prior metrics cannot make a clear distinction between the relevant terms of the minority class. In other words, they produce similar weights for all relevant terms.
The second problem is that the common metrics measure the discriminating power of terms. As mentioned above, both relevant and irrelevant terms can be considered as discriminating features in text classification. From this perspective, the presence or absence of these features can separate the documents of the minor and major classes. However, documents in the overlapping region between minor and major classes cannot be distinguished well. These documents are similar to both classes and may possess both relevant and irrelevant terms simultaneously. In this region, when a metric identifies a word as relevant with respect to the minor class, that word is likely to be considered irrelevant with respect to the major (non-minor) class. These types of words are more likely to have similar weights if we use metrics that only consider the discriminating power of terms. Therefore, such metrics in document indexing cannot be used to clearly distinguish between the documents in the overlapping region.
We address these two problems in our proposed metrics. Regarding the first problem, we revise the RF metric as Equation (7) and name it as conditional RF (CRF).
 $$CRF(t,k) = \log \left[ {2 + \frac{{P(t|k)}}{{P(t|\bar k)}}} \right] = \log \left[ {2 + \frac{{a/(a + b)}}{{\max \{ 1,c\} /(c + d)}}} \right]$$
In CRF, we have replaced the joint probabilities by the conditional ones. Here, the distributions of relevant documents are taken into account with respect to the minor and nonminor classes. Unlike the RF metric, CRF retains the values of b and d so that it can differentiate two words that have the same relative values of a and c.
Because term evaluation metrics are used in document indexing, we transform negative weights to positive ones. In the VSM, zero values in document vectors indicate the nonoccurrence of a term in the given document. Therefore, when we transform vectors to another space using a term weighting strategy, negative weights would detract from the meaningfulness of the vectors. Hence, we add 2 to the OR, because the base of the logarithm is 2 in Equation (8). In addition, OR is very sensitive to the value of c. In fact, OR assumes that none of the probabilities in Equation (5) are zero, so we consider an epsilon value to handle cases where probabilities are zero. For example,
$P(t|\bar k)$
in Equation (5) equals epsilon in the case of c being zero. Because epsilon is a very small value in the denominator of this fraction, it sharply increases the value of the OR.
To resolve this problem, we ignore the c value in Equation (8) when it is zero and calculate the OR by relying on the value of b. In this case, b becomes a determinative factor in OR for computing the relevance of the given term. We name this the soft OR (SOR) because its value is softer than OR for cases where c is zero.
 $$SOR(t,k) = \log \left[ {2 + \frac{{ad}}{{\max \{ 1,b\} \max \{ 1,c\} }}} \right]$$
For the chi-square and IG metrics, we revise these as Equations (9) and (10), respectively. The χ 1 metric is an asymmetric version of χ 2 in which relevant terms are differentiated from irrelevant ones. Adding 1 in Equation (9) avoids χ 1 producing negative weights. Actually, χ 1 produces nonnegative weights which measure the relevance level of terms.
 $${\chi ^1}(t,k) = 1 + \frac{{P(t,k)P(\bar t,\bar k) - P(t,\bar k)P(\bar t,k)}}{{P(t)P(k)}} = 1 + \frac{{ad - bc}}{{(a + c)(a + b)}}$$
The same strategy is used in IG 1 to measure the degree of relevance of terms instead of their discriminating power. According to Equation (10), IG 1 is calculated from the difference between two components: while the first component measures the degree of relevance, the second one indicates the degree of irrelevance. This difference is considered a determinative factor in calculating the relevance of terms with respect to a particular category.
 $${I{G^1}(t,k)} { = P(t|k)\log \frac{{P(t,k)}}{{P(t)P(k)}} - P(t|\bar k)\log \frac{{P(t,\bar k)}}{{P(t)P(\bar k)}}}\\ {} { = \frac{a}{{a + b}}\log \frac{{aN}}{{(a + c)(a + b)}} - \frac{c}{{c + d}}\log \frac{{cN}}{{(a + c)(c + d)}}}$$
(10)
To make a comparison with our previous work, we also use the Positive Negative Features(PNF) metric (Naderalvojoud et al. (Naderalvojoud et al. Reference Naderalvojoud, Sezer and Ucan2015), proposed for imbalanced texts, as an additional baseline in this paper. PNF is defined in Equation (11).
 $$PNF(t,k) = 1 + \frac{{P(t|k) - P(t|\bar k)}}{{P(t|k) + P(t|\bar k)}}$$
According to Naderalvojoud et al. (Reference Naderalvojoud, Sezer and Ucan2015), PNF has shown good performance in imbalanced text classification. Here, we assess its performance with various machine learning algorithms and compare it with our proposed metrics for the evaluation of terms.
4.1 Empirical evaluation on the proposed metrics
To demonstrate the behavior of all evaluation metrics on the relevant terms of the minority class, we construct an empirical example using the grain category of Reuters-21578 data set. The grain category, with 41 documents, is the most minor category of the eight popular categories of the Reuters data set (Cachopo Reference Cachopo2007).
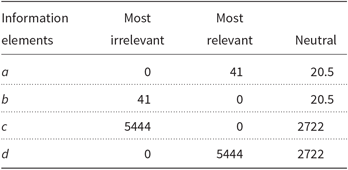
In this example, we choose five relevant terms with respect to the grain category; this means words that mostly occur in the grain category and rarely occur in the others. We evaluate them by the four common metrics investigated in this paper and their revised forms, as well as PNF, to compare their values. Because these metrics compute weights in different ranges, any comparison between them will not be meaningful unless a normalization process is applied. To normalize the metric values, the minimum and maximum values of each metric are calculated based on the most irrelevant, relevant, and neutral cases. We determine these three cases by using information elements shown in Table 2. As IG and χ 2 calculate the minimum weights for neutral words, their minimum values are calculated from the neutral case. Equation (12) is used to normalize the values of all metrics:
 $$n(x) = \frac{{x - \min ({\bf{x}})}}{{\max ({\bf{x}}) - \min ({\bf{x}})}}$$
Most irrelevant, relevant, and neutral cases based on document frequency

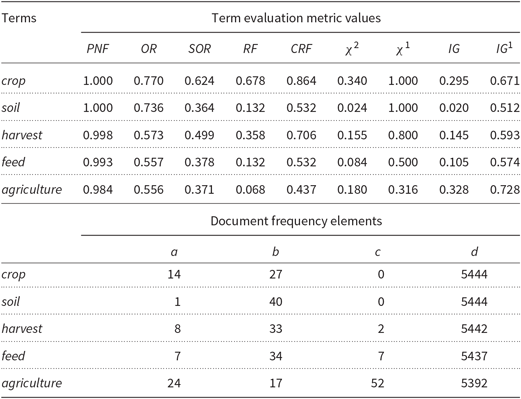
Evaluation results for five relevant terms of grain category in Reuters data set

where x denotes all possible values of the given metric, x is the metric value belonging to x, and n(x) is the normalized value of x.
Table 3 shows the values calculated for the five relevant terms as well as their document frequency elements. This table shows that the proposed metrics reveal the relevant terms better because they have large weights for them. For example, while χ 1 calculates the largest weight of 1 for term “crop,” χ 2 produces a weight of 0.340. Despite the imbalanced distribution of documents between the two classes, the proposed metrics identify the relevant terms better than the common metrics.
5. Experiments
This section demonstrates the effectiveness of the proposed term evaluation metrics in imbalanced text classification where they are used in document indexing. The objective is to show the superiority of each proposed metric in contrast to its common version. To assess the effect of the term evaluation metrics in text classification, we employ two baseline indexing methods, tf and tfidf, which are widely used in text classification. All experiments were conducted on two popular subsets of Reuters-21578 data set—namely R8 and R52— and the WebKB data set. These data sets are often considered as imbalanced benchmarks in text classification (Erenel and Altnçay Reference Erenel and Altnçay2012; Kim and Kim Reference Kim and Kim2016; Ren and Sohrab Reference Ren and Sohrab2013; Sun et al. Reference Sun, Lim and Liu2009).
5.1 Experimental setup
5.1.1 Data sets
The Reuters-21578 is a collection of Reuters newswire articles with 115 categories. However, different subsets of this benchmark are usually used in text classification for different tasks; for example, single-label or multi-label. In this study, we have used two popular subsets: namely, R8 and R52, with 8 and 52 categories, respectively (Kim and Kim Reference Kim and Kim2016). The R8 data set consists of two major categories—namely, earn and acq—with almost 52% and 30% class distributions, respectively, and six minor categories with almost 3% class distributions. In the R52 data set, the number of minor classes increases to 50, with an average of 42 documents in each class (less than 1% class distribution). In this benchmark, the imbalance ratio is more critical than in R8 because there are 18 categories with less than 10 documents.
We have used the WebKB data set as the third benchmark. This has four categories: namely, student, faculty, course, and project. This benchmark comprises web pages collected from computer science departments of various universities. The data set contains two minor categories, called project and course, with almost 10% and 20% class distributions, respectively, and two major categories, with 30% and 40% class distributions.
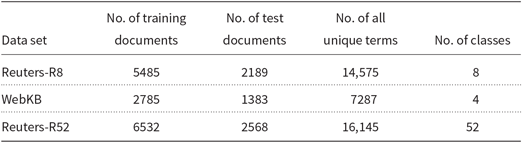
For training and test sets, we have used the split proposed in Cachopo (Reference Cachopo2007). The split data for our three data sets can be downloaded from https://www.cs.umb.edu/smimarog/textmining/datasets/. Table 4 summarizes the statistics of these data sets.
Statistics of data sets

5.1.2 Performance metrics
To judge the performance of classification for each category, the F-measure is used in all experiments. The F-measure is a harmonic mean of Precision and Recall and provides a fair judgment of the classification performance when data are imbalanced. The Precision (P), Recall (R), and F-measure (F) values are computed for a certain category as in Equations (13) (14), and (15), respectively (Sebastiani Reference Sebastiani2002):
 $$P = \frac{{TP}}{{TP + FP}}$$
 $$R = \frac{{TP}}{{TP + FN}}$$
 $$F = \frac{{2PR}}{{P + R}}$$
where TP, FP, and FN are true positives, false positives, and false negatives, respectively. To evaluate the overall performance, the macro-averaged F-measure is used (Sebastiani Reference Sebastiani2002). As the macro-average is calculated based on the average of the individual F-measure values, the number of test documents in each category does not have any effect on its outcome. Therefore, it can assess the overall performance better when imbalanced data are present.
5.1.3 Document representation and indexing
To represent documents, we select the most discriminating features or terms from each category. By selecting the top 1000 words per class using χ 2, we almost reduce the input dimensionality by half. All documents are represented by the selected features and indexed based on term frequency and class-based weights through Equations (16) and (17) (Debole and Sebastiani Reference Debole and Sebastiani2004):
 $$tf.TEF({t_i},{d_j}) = tf({t_i},{d_j}) \times TEF({t_i},{c_j})$$
 $${W_{i,j}} = \frac{{tf.TEF({t_i},{d_j})}}{{\sqrt {\sum\nolimits_{k = 1}^{|T|} {tf.TEF{{({t_i},{d_j})}^2}} } }}$$
The paired common and proposed class-based metrics—(χ 2 and χ 1) (IG and IG 1) (OR and SOR), and (RF and CRF)—are used in the experiments, such that each one is considered as a TEF in Equation (16). We also use two baseline methods, tf and tfidf, instead of using Equation (16). These two methods are not class-based, so we consider the PNF as an additional baseline. In Equation (16), tf(t i, d j) denotes the number of times that term t i occurs in document d j, TEF(t i, c j) is the value of term t i with respect to the category of document d j (denoted by c j), and |T| denotes the size of the vocabulary set.
5.1.4 Classification algorithms
To assess the effectiveness of the proposed metrics over the learning process, we employ four different machine learning algorithms which have achieved great success in text classification. The centroid-based algorithm proposed in Naderalvojoud et al. (Reference Naderalvojoud, Sezer and Ucan2015) is the first classifier that we use in the experiments. This algorithm generates the centroid vectors from documents of each category and reflects the effect of indexing methods on the classification model. As the support vector machine (SVM) is considered the most robust classifier among all well-known classification algorithms (Sun et al. Reference Sun, Lim and Liu2009), we employ libSVM implemented in WEKA (Chang and Lin Reference Chang and Lin2011) by the linear kernel function as the second classification algorithm. In machine learning, the Naive Bayes classifier is a probabilistic method that applies Bayes’ theorem by considering the independence assumptions of the features. Because the discretized version of Naive Bayes (DNB) (Dougherty et al. Reference Dougherty, Kohavi and Sahami1995) performs better than the simple version, it is used as our third classification algorithm. Discretization is a variable selection method to transform continuous values to discrete ones. This technique significantly improves the classification performance of machine learning algorithms, including Naive Bayes, which are sensitive to the dimensionality of data (Lustgarten et al. Reference Lustgarten, Gopalakrishnan, Grover and Visweswaran2008). As our fourth algorithm, we employ the C4.5 decision tree algorithm (Chawla et al. Reference Chawla, Bowyer, Hall and Kegelmeyer2002). For both DNB and C4.5, we have used the WEKA implementation.
5.2 Experimental results and discussion
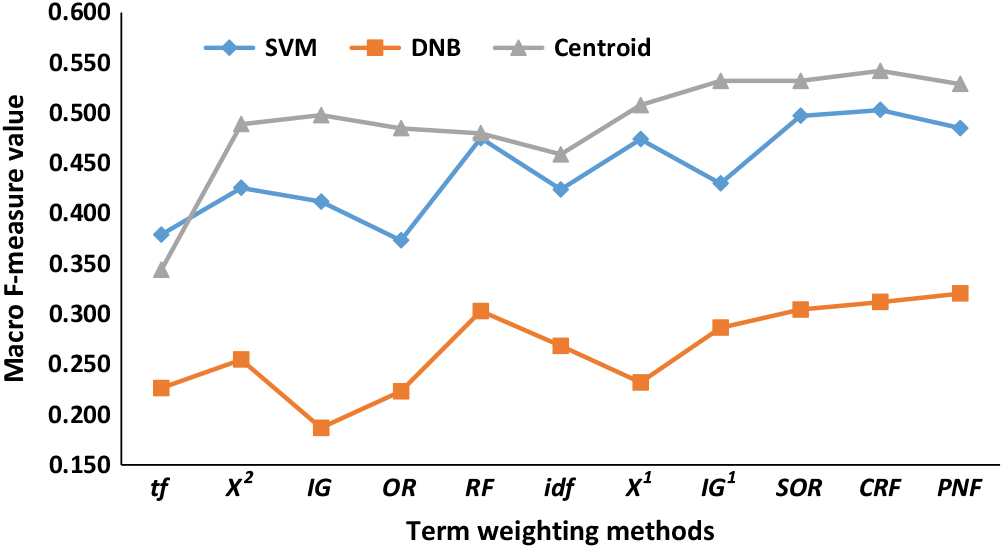
Figure 2 shows the macro F-measure values obtained from different classifiers on the R52 data set. As noted above, R52 consists of minor categories having less than 10 documents each. These minor categories make an impact on the macro F-measure value because most of the classifiers cannot learn a good model for them and therefore show poor perfoFrmance. Therefore, R52 can be considered a good benchmark to reveal the effect of the proposed term evaluation metrics on text classification. From the results shown in Figure 2, all of the proposed metrics outperform the common metrics as well as the tf and tfidf methods using SVM and Centroid classifiers. SVM and Centroid classifiers achieve the best results using the SOR, CRF, and PNF metrics. Similar observations apply to the DNB classifier. However, the DNB performs more weakly than SVM and Centroid on the R52 data set.
The overall macro F-measure values obtained from the R52 data set.

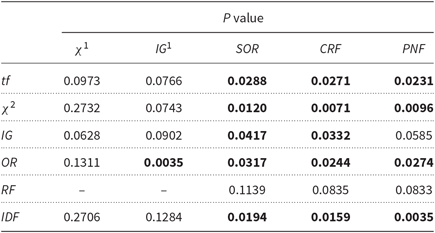
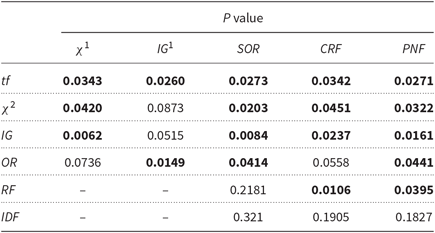
To demonstrate the significance of the improvements on the three classifiers, a paired t test is employed on the macro F-measure values of the classifiers. In our experiment, the macro F-measure value of each classifier is compared to the corresponding one in the second set, which is obtained from a different indexing method. Thus, it indicates whether the average performance of the three classifiers is significantly improved by the proposed indexing methods. Table 5 shows the obtained P values at a significance level of 0.05 for cases in which improvements have occurred. In this table, a dash appears in the cells that do not show any improvement. The first row in this table indicates the significance of improvements between tf and each of the proposed evaluation metrics. As the P values are less than 0.05 in three SOR, CRF, and PNF, statistically significant improvements are achieved by these metrics. In each of the other rows, one common metric is compared with each of our proposed metrics; the P values less than 0.05 are shown in bold. In most cases, SOR, CRF, and PNF significantly outperform all of the common metrics excluding RF, for which improvements are not statistically significant. It can be concluded that the proposed metrics have a major influence on the performance of SVM, Centroid, and DNB classifiers over the imbalanced data.
Paired t-test results on the macro F-measure values of three classifiers in the R52 data set

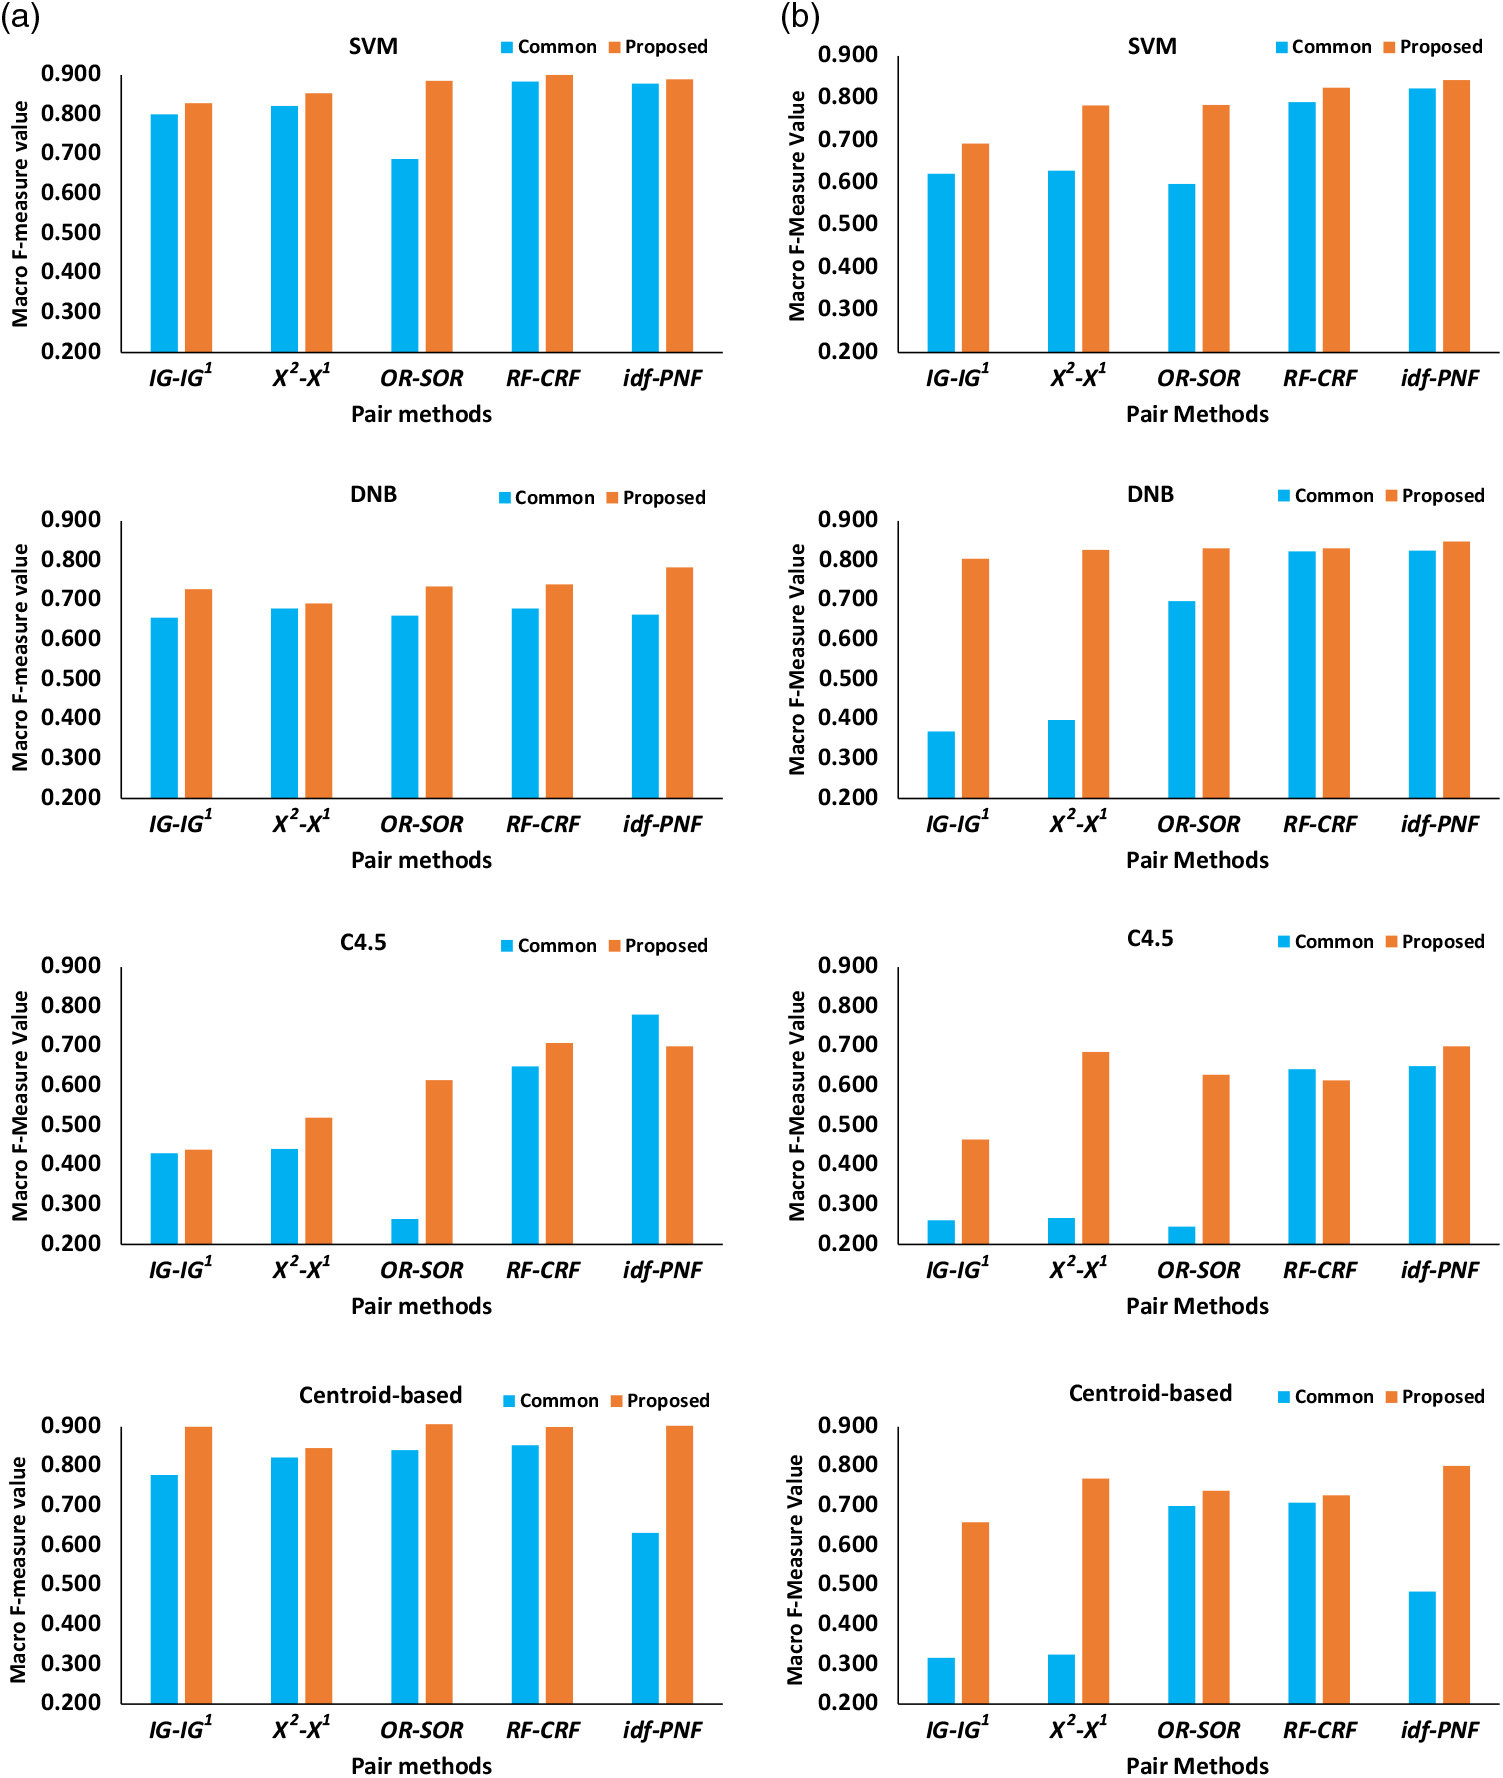
We evaluate the performance of the proposed metrics on two other benchmarks in which the minor categories have a more reasonable number of documents than R52. We perform a pairwise comparison between the common and proposed metrics in Figure 3. While the left four diagrams in Figure 3(a) show the macro F-measure values of the four classifiers on the R8 data set, the right diagrams in Figure 3(b) show the same results on the WebKB data set.
Performance of the proposed metrics in comparison with their standard forms over R8 (a) and WebKB (b) data sets.

Figure 3 shows that the proposed IG 1 and χ 1 outperform their common versions remarkably using all classifiers on the both benchmarks. We can also see that SOR performs much better than OR using SVM, DNB, and C4.5 classifiers. The effect of CRF is more tangible on R8, but nevertheless it performs well on WebKB using the SVM and Centroid classifiers. The results between the proposed metrics and the tfidf method are comparable. While the proposed metrics perform better than idf in the DNB and Centroid classifiers, they do not preserve this superiority in the C4.5. In the SVM classifier, CRF outperforms idf on both benchmarks. In addition, in SVM, the results achieved by the other metrics are very close to idf.
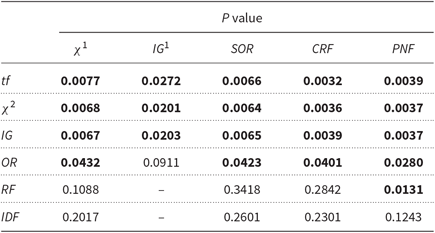
To show the significance of improvements achieved by all classifiers, we again apply the paired t test to the macro F-measure values of the classifiers. Table 6 shows the obtained P values and compares the common and proposed metrics on the R8 data set. According to Table 6, all proposed metrics significantly improve the performance of the four classifiers, in comparison with the tf method. Furthermore, the three metrics, SOR, CRF, and PNF, outperform all of the common ones, and most of these improvements are statistically significant.
Paired t-test results on the macro F-measure values of four classifiers in the R8 data set

The significance of the improvements for the WebKB benchmark is presented in Table 7. According to the P values, the proposed metrics have a significant impact on the performance of the four classification algorithms where data are imbalanced. P values less than 0.05 are bold and indicate that the improvements are statistically significant. The main observation is that, while the common metrics (IG and χ 2) perform weakly, their revised forms (IG 1 and χ 1) significantly improve the performance of classification in the WebKB data set. This is clearly seen for χ 1, which outperforms all of the common metrics. The improvements achieved by χ 1 can be seen in Table 7.
Paired t-test results on the macro F-measure values of four classifiers in the WebKB data set

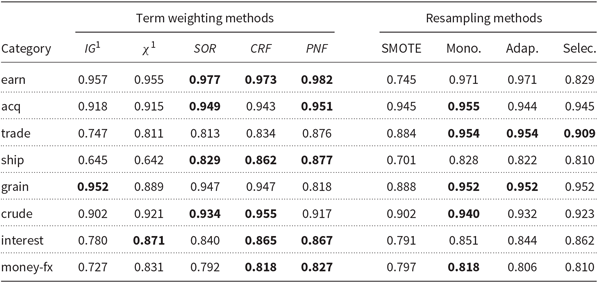
Overall, the results achieved on the two benchmarks demonstrate that the proposed metrics perform better than the common ones in the four machine learning algorithms. To observe the effectiveness of the proposed term weighting approach in contrast to other state-of-the-art methods, we report the results of three resampling approaches: namely, Monolithic, Adaptive, and Selective proposed in Nguyen and Ho (Reference Nguyen and Ho2010), as well as SMOTE (Chawla et al. Reference Chawla, Bowyer, Hall and Kegelmeyer2002). Unlike SMOTE, which generates synthetic examples randomly in the line segments, the other three methods perform manifold-based oversampling using two in-class and out-class strategies. Because these methods have been evaluated on the same experimental setup as ours (i.e., the same data set, train/test split, evaluation metric, and classifier), we compare our term weighting approach with them. Table 8 shows the F-measure values of the SVM classifier over the Reuters data set in combination with term weighting approaches and resampling techniques. For each category, Table 8 shows the top three successful methods in bold. As can be seen, the proposed term weighting approach outperforms the resampling methods in most categories. While the Monolithic approach is the best in the “acq” and “trade” categories, the term weighting approach produces the highest F-measure values for the other categories. The results demonstrate the effectiveness of the proposed term evaluation metrics in document indexing when the class distribution is imbalanced.
Term weighting approach versus resampling approach

6. Conclusion and future work
In this paper, we proposed four term evaluation metrics based on the common feature selection metrics: namely, χ 2, IG, OR, and RF. We demonstrated that the common metrics require a document set with a homogeneous class distribution. In cases where class distribution is imbalanced, they are unable to distinguish between the strong, medium, and weak relevant terms in the minor classes. In other words, they calculate similar weights for all relevant terms in the minority class.
In addition, we showed that metrics that evaluate the relevant terms separately from the irrelevant ones are more suitable for document indexing. The results achieved from χ 1 and IG 1 demonstrate that the evaluation metrics should measure the relevance power of terms, instead of their discriminating power, when they are used in document indexing.
Our experiments over three benchmarks indicated that the proposed metrics achieve more consistent results than the common metrics using machine learning algorithms. We also observed that both SVM and Centroid classifiers outperform the C4.5 and DNB in imbalanced text classification.
In a future work, we aim to use the term evaluation metrics in deep neural network models for weighting documents. In most deep models, documents are represented as a sequence of words. To enrich this type of representation, we will apply an instance weighting strategy to this sequence representation using our term evaluation metrics.
Author ORCID
Behzad Naderalvojoud, 0000-0003-4429-5341