1 Introduction
The transition from defined benefit (DB) to defined contribution (DC) workplace retirement savings plans in Anglo-American countries has expanded markedly over the past two decades, and has accelerated since the onset of the global financial crisis. Whether the product of long-term changes in industry structure and workforce composition (as in the US; see Munnell, Reference Munnell, Clark, Munnell and Orszag2006), the establishment of regulatory frameworks aimed at promoting workplace savings plans (as in Australia; see Mackenzie, Reference Mackenzie2010), or the implosion of employer commitment to DB retirement savings plans (as in the UK; see Clark and Monk, Reference Clark and Monk2007), the DC model increasingly holds sway with implications for many other countries (as in Germany; see Burger and Clark, Reference Burger and Clark2011). One important difference between DB and DC retirement savings plans is the fact that the risks associated with the ultimate value of workers’ retirement savings ‘pot’ are borne by the employer in DB plans and the employee in DC plans (although in the case of DB plans employer bankruptcy may lead to ‘risk-sharing’ by administrative fiat or by default). In some jurisdictions, however, retirement savings plan participants are offered a choice between participating in DB and/or DC plans. Evidence from the U.S. suggests these offerings by state plans to be the consequence of legal constraints which do not permit a reduction in employee benefits (Munnell et al., Reference Munnell, Aubry, Hurwitz and Quinby2011). While the pervading trend is away from DB structures, there remain unresolved questions as to the behaviour of participants when offered a choice between plans. Typically, this is a one-off choice in that once the type of plan is chosen, employees cannot switch back of their own volition.Footnote 1 Given widespread concern amongst academics and policymakers about the likely discounted value of, and lack of certainty associated with, DC plans the idea that workers might voluntarily switch from DB to DC plans is viewed with alarm. For example, in the UK the current pension minister has sought to reduce the rate of voluntary DB to DC switching by threatening to intervene with employers who offer employees inducements to switch out of DB entitlements.
The idea that employees may be vulnerable to inducements to switch suggests either they are believed myopic and/or they do not understand or appreciate the differences between DB and DC retirement savings plans. The first explanation resonates with related findings from behavioural psychology and finance to the effect that many people heavily discount the future (see Baron, Reference Baron2008). The second explanation resonates with empirical findings to the effect that many people do not understand the difference between DB and DC plans (Clark et al., Reference Clark, Strauss and Knox-Hayes2012), especially where sponsors obscure or shroud the possible negative consequences associated with choosing a DC plan over the DB plan (see generally Gabaix and Laibson, Reference Gabaix and Laibson2006). Even so, there is considerable diversity amongst retirement savings plan participants as to their behaviour and expectations; switching from DB to DC is not, ipso facto, evidence of participant incompetence or for that matter plan sponsor disinterest in their long-term welfare.
Here we look at the example of a workplace retirement savings plan that introduced the option for members to voluntarily switch from a DB to a DC plan as a feature of plan design. A large database of participant behaviour provided by UniSuper, one of Australia's largest multi-employer industry funds, is utilised. UniSuper covers a wide variety of university employees, from the lowest paid to professors and the principal administrators of participating institutions. Employees with a minimum two-year employment contract automatically join the DB plan and contribute 7% of gross salary to UniSuper, with a matching 17% contribution from their employers. In 1998, DB plan participants were given the option to switch to a DC plan in an environment, which could be characterised as benign with respect to employer motives and actions. Since then all eligible new members have faced this choice. This provides the opportunity to analyse the characteristics of those who switch and those who do not in an environment where a great deal of information was, and is, provided to facilitate informed choice.Footnote 2 Sample participants face employment security and mobility circumstances which would be similar to members in those plans, particularly public sector, likely to be considering such offerings. This paper therefore provides insight into member choices, particularly for sponsors and plans assessing the likely behavioural responses of such offerings.Footnote 3
It is shown those who switch from DB to DC can be identified both with respect to their socio-demographic characteristics and with respect to their life-cycle status. It is also shown, notwithstanding benign institutional motives and behaviour in an information-rich environment, there are participants who switch to the DC plan in a way that matches the DB plan left behind. This suggests that some participants lacked an adequate understanding of the differences between DB and DC plans. It is also possible that being in the DC environment fulfils other objectives less related to retirement planning and income and more related to lifetime prospects (Ameriks et al., Reference Ameriks, Caplin, Laufer and van Nieuwerburgh2011). We note, however, that this type of behaviour is consistent with findings in the psychology literature to the effect that people often mimic known options rather than search for what might be deemed ‘optimal’ arrangements (see Hurley, Reference Hurley2008). We also show that being ‘located’ in a certain time, measured in terms of macroeconomic circumstances, may precipitate switching from DB to DC holding other variables constant. The paper then draws implications for understanding the nature and scope of participants’ behaviour as well as the design of these types of institutions in relation to the scope of allowed or encouraged behaviour.
2 Risk preferences and behaviour
DB pension plans typically promise participants a certain level of income upon retirement and, depending on the plan and the jurisdiction, the prospect of automatic cost-of-living adjustments through to death. Some, as is the case with UniSuper, provide the promise of a lump sum upon retirement. In most cases, DB plans make provision for discounted benefits to flow on to surviving spouses and dependents. By contrast, DC plans do not promise a certain level of retirement income. Normally this is dependent on the flow of contributions, returns on investment and the costs of administration. In effect the risks associated with providing DB pension benefits are borne by plan sponsors, whereas in the DC environment these risks are borne by participants. However, DB plans are not risk-free (Clark, Reference Clark, Caerlewy-Smith and Marshall2009): in many jurisdictions, participants share the risks of sponsor default and default risk may be significant in certain sectors (countries) exposed to global competition and financial turmoil.
It is reasonable to suppose the risks of default in the Australian university sector are quite unlikely and certainly much smaller than in certain sectors of Australian industry. The switching decision is best understood in terms of individual volition. The assumption that individuals have first the cognitive ability to make the necessary optimal retirement savings decision, and second, the necessary will to execute the desired plan, have been questioned (Benartzi and Thaler, Reference Benartzi and Thaler2007) with evidence, for example, of decision-making based on heuristics and naïve diversification strategies. Brown and Weisbenner (Reference Brown and Weisbenner2007) provide evidence, using a sample of public sector employees in the US, that suggests that the more ‘capable’ (high income, well-educated), younger individuals select a DC plan when offered pure DB, DC and hybrid options even though the terms would suggest it is not the best financial decision. They suggest information processing constraints, overconfidence, framing effects, and a high value attached to the choice per se as possible explanations. Clark et al. (Reference Clark, Ghent and McDermed2006) using a sample of academics from a US state university system who are given the DB/DC choice report observed choices that ‘conform to predictions based on economic models’ (Clark et al., Reference Clark, Ghent and McDermed2006, p.561). UK evidence (Cocco and Lopes, Reference Cocco and Lopes2011) also suggests self-selection by individuals into pension plans which accords with individual circumstances. We focus upon the socio-demographic patterns of DB to DC switching, the extent to which switchers may have been aware or knowledgeable about the risks associated with this behaviour, and the extent to which macroeconomic circumstances and trends may have prompted switching from DB to DC. While individual behaviour is the crux of the paper, identified socio-demographic patterns may have implications for public policy (see Carlsson et al., Reference Carlsson, Erlandzon and Gustavsson2008; Cocco and Lopes, Reference Cocco and Lopes2011).
A crucial finding of the behavioural revolution associated with Kahneman and Tversky (Reference Kahneman and Tversky1979) is that people are loss averse, preferring to minimise the prospect of loss relative to the possible gains associated with taking risk. A related finding is that people heavily discount the future, preferring immediate or close-to-hand benefits over long-term benefits. In general, the evidence suggests that women are more risk averse than men, and that men have steeper discount functions than women. These findings, however, are the product of an experimental regime that typically does not take into account social status or household relationships. There is evidence that households may have joint risk-management strategies such that one partner may prefer a safe and secure savings plan, whereas his or her partner may pursue a more risky saving strategy underwritten by the certainty associated with their partner's commitments. The significance of household strategies tends to vary by age; and income: the older the higher-earning partner (typically male) the more likely the other partner (typically female) assumes greater risk (Clark et al., Reference Clark, Strauss and Knox-Hayes2012).
There are, of course, some people who have a strong preference for risk just as some people plan for the future. It has been difficult to discern systematic sociodemographic predictors of a strong preference for risk. In cognitive science, there are findings to the effect that exceptional risk tolerance is closely correlated with testosterone (Sapienza et al., Reference Sapienza, Zingales and Maestripieri2009). Elsewhere it has been observed that there are people willing to gamble on the future and that some people may be willing to gamble up to the point where the size of the bet makes a substantial difference to their individual and household welfare (Clark et al., Reference Clark, Caerlewy-Smith and Marshall2009). It has also been observed that older, higher income DC plan participants tend to have a broad range of retirement saving instruments such that they are willing to assume higher risks in their workplace pension arrangements mediated by taking less risk in their other savings instruments (Clark et al., Reference Clark, Strauss and Knox-Hayes2012). This type of behaviour is consistent with modern portfolio theory and a diversified retirement savings strategy (Sharpe, Reference Sharpe2007).
Do people appreciate the difference between the two types of pensions? In an analysis of risk preferences and behaviour of a UK sample of pension plan participants, Clark and Strauss (Reference Clark and Strauss2008) show that a significant minority of respondents were not able to distinguish between DB and DC plans on the basis of their associated risks. That is, participants either lacked the information needed to discriminate between the risk profiles of different pension arrangements and/or they were unwilling to invest the time in determining the relative risk of exposure of one type of pension against another. In this instance, UniSuper has invested considerable time and effort in providing relevant information in a variety of forms to plan participants to aid choice.
In any event, it would appear that many people find it difficult to conceptualise the nature and scope of risk, whether financial (in general) or retirement savings-related (in particular). Significantly, recent tests of DC pension plan participants' understanding of risk levels suggest that the simplest characterisation of risk is far more meaningful than more complex and highly calibrated measures of risk. In fact, the choice between DB and DC plans involves at least two related risk-based decisions: first, whether to migrate from DB to DC, and second, the type of portfolio to choose within the DC environment. If the choice is perceived this way and people are confident in assuming the risks with switching from DB to DC, they may manage the assumption of risk by choosing a conservative DC investment portfolio.
The third part of our paper deals with whether the macroeconomic context of the choice affects the decision-making process. This issue is complex, notwithstanding a burgeoning literature on the effect of events on individual behaviour in financial markets (Engelberg and Parsons, Reference Engelberg and Parsons2011). In part, this literature focuses upon recognised events such as sudden, unanticipated market turbulence occasioned by shocks to the financial system (Tetlock, Reference Tetlock2007). In part, these types of studies are concerned with the communication of events through the print and electronic media where characterisation of their significance is as important as their measured incidence and effect (Wisniewski and Lambe, Reference Wisniewski and Lambe2010). There is no doubt that events can prompt responses, although the effect of such events may be short-lived, especially if those events are quickly integrated into market trends and behaviour. We might expect market turbulence just prior to the opening of a window for participants to switch from DB to DC to dampen the rate of switching, whereas the opening of a window for switching in a period of market stability and growth may have little or no effect on participant behaviour.
One part of our analysis is time-specific (the opening of a window for DB to DC switching in 1998). Another part of our analysis extends month to month over an extended period of time where individuals are placed in the flow of events and market performance. Here, it may be more difficult to determine a significant cause-and-effect relationship. However, it is possible that the path of a market economy and, in particular, the upward trajectory of financial markets may effectively frame the assessment of risk such that the risks associated with switching from DB to DC are lost in shared market euphoria (Calvet et al., Reference Calvet, Campbell and Sodini2009). This effect may well be conditioned by the age and experience of participants; young entrants to the sector in conditions of market euphoria may have no basis to judge the risks associated with enrolment in DC plans.
3 Fund history and the DB/DC choice
3.1 History and initial choice
In 1998 UniSuper members were given 12 months from 30 June 1998 to choose whether to leave the DB plan and join a new DC plan. Throughout the paper, this group of members is referred to as ‘Existing members’. Members who transferred to the DC plan received their lump-sum benefit entitlement plus a share of the notional ‘surplus’ of the DB plan. The DB/DC choice was an irrevocable decision. Information distributed to members included an independent actuarial assessment that both plans were ‘fair and equitable … and it is impossible to say that one plan is better than the other until the benefit actually becomes payable’ (SSAU, 1998b). Those who selected the DC plan were also required to choose an investment strategy. Four pre-mixed investment options were made available: Secure (no equity); Stable (42% equity); Trustee's Selection (72% equity); and Shares (100% equity). Trustee's Selection was the investment strategy of the DB plan and became the default investment strategy of the DC plan. All members who have joined since 30th June 1998 (New members) are also enrolled in the DB plan and have 12 months to make the choice.
The overall choice architecture (Thaler and Sunstein, Reference Thaler and Sunstein2008) is important to consider when examining revealed preferences, particularly the role of the default option which here is the DB plan. Many empirical papers (for a summary see Beshears et al., Reference Beshears, Choi, Laibson, Madrian, Kay and Sinha2008) have documented ‘default behaviour’ where the nomination of the plan default appears to influence choice behaviour consistent with procrastination, anchoring, and status quo bias (Madrian and Shea, Reference Madrian and Shea2001). With the current data it is not possible to distinguish those who remain in the default option through default behaviour or through an active choice. Olleman and Boivie (Reference Olleman and Boivie2011) highlight the role of defaults within the DB/DC context in US public sector plans, noting the strong preference for the traditional DB plan existed also where the DB was not the default.
One important difference in the choice for Existing UniSuper members relative to new (post June 1998) members was if they remained in the DB they had the option at retirement to purchase an indexed pension with a known and guaranteed fixed income replacement rate determined by years of membership and age at retirement. New members, whether DB or DC, can also purchase an indexed pension at retirement. However, the rate is subject to market conditions. This was important for UniSuper, since it reduced the fund's exposure to mortality and longevity risks. It was an additional inducement for Existing DB members to retain DB membership.
3.2 Investment menu and information provided
The investment options available for members have increased over time, as has the scope of investment choice within the DC plan. From four options, which could be changed annually, the menu increased to 12 options by 2008, which could be varied weekly. The investment options were initially pre-mixed, with the strategic asset allocation set by the fund. Individual asset class options were only introduced in July 2008. Members were restricted to one option per choice; that is, splitting choice across options was not available until July 2005.Footnote 4
In information provided to members via print and seminars, UniSuper identified three reasons for offering the DB/DC choice (SSAU, 1998a, b): that work practices had changed and there (now) existed the prospect of interrupted work patterns; that superannuation had become more choice-orientated and that people may want flexibility; and that members had asked for a change. In terms of how a member should make the decision, the fund identified four points to consider. The first had two related but distinct factors: how members felt about making an investment choice and how they felt about investment returns and income security. Second was the length of time to retirement. Third was the expectation of salary increases, and fourth was members’ preferences for receiving the benefit as a pension or as a lump sum. For those in the DB plan, the lump-sum pension conversion factor was fixed, whereas for those opting for the DC plan, it would not be. The current UniSuper member application form identifies further questions that should be considered when choosing between DB and DC including whether members liked the idea that part of the benefit will be determined by a formula; wanted to choose how all their super is invested; had an expectation of how long they expected to remain a member; and how they felt about short-term uncertainties in investment performance (UniSuper, 2013).
4 Data overview, methodology and hypotheses
4.1 Data overview
This paper focuses on the initial DB/DC decision and the related decision about investment strategy for those who selected the DC plan. Two samples are investigated. The first includes approximately 50,000 eligible Existing members as at 30 June 1998 when the DB/DC choice was first introduced.
The second sample includes new members who joined between 1 July 1998 and 31 December 2008 and have always had the DB/DC choice. New members receive information detailing the choice available and the possible consequences of the decision with information tailored to the individual. Whereas the Existing sample of members who switched, was part of the entire membership who all received the information at the same time, the New sample of members receive information on the plan when they join. Therefore, while the amount of information provided was the same for both groups, the ‘experience’ of it was a more shared one for members in the Existing sample. Both groups of members had 12 months to make a selection. If they do not respond, they remain in the DB plan.
4.2 Hypotheses
The data afford an investigation of a range of factors, suggested in the literature, which may explain observed choices. This section identifies these factors through a series of hypotheses.
4.2.1 Age and likely length of membership
The DB plan offers immediate vesting. The member's payout is a product of length of service, average indexed salary over the final 3 years of service, and a lump-sum factor for the member's age at retirement. The lump-sum factor remains constant at 18% until age 40. Given that total contributions are 21% gross, or 17.85% net of contributions tax (15%), this 18% lump-sum factor per year of full-time employment is modest. Beyond age 40 the lump-sum factor increases by 0.2 of 1% per year until age 65 where it plateaus at 23%. This produces a significant difference in the payout given the age at which a member joins the fund. For example, a member who commences at age 35 and has 3 years’ service receives a ‘guaranteed’ return of inflation on the first 2 years’ contributions, via the CPI indexation factored into the calculation of an average 3 year salary, plus 0.84% returns on each year's contributions.Footnote 5 For a member joining on an annual salary of $50,000 the difference in the internal rate of return over the 5 years for a 35- and a 60-year old using 21% contribution is 3.4% and 28.3%, respectively.Footnote 6
The attraction of the DB plan is expected to be lowest for younger members but increases as the age at commencement of membership, approaches 40. Therefore, age is expected to have a negative marginal effect on the likelihood of selecting the DC choice plan. As the age at joining approaches age 40 it is expected that the marginal effect of age reduces. The ‘peak’ age of DC attraction will be determined by member trade-off of accepting the possibly lower expected lump-sum factor until age 40 against the attractiveness of increasing lump-sum factors beyond age 40. The latter will be also influenced by expectations of employment length in the education sector.
Previous empirical work in the U.S. (Agnew et al., Reference Agnew, Balduzzi and Sundén2003), Australia (Gerrans et al., Reference Gerrans, Clark-Murphy and Speelman2010) and the UK (Clark and Strauss, Reference Clark and Strauss2008) suggests the risk tolerance of DC plan participants changes at a relatively young age (evidenced, e.g., by portfolio allocations). In the U.S. and Australian studies, which examined retirement savings investment choices, those who made changes to their asset mixes increased equity allocations through to their mid-30s before declining. This suggests the following hypotheses:
H1: The marginal effect of age on the likelihood of selecting the DC plan will decline with age.
H2: At ages less than 40 years the marginal effect is more likely to be positive becoming neutral to negative from age 40 years reflecting the more attractive lump sum payable.
4.2.2 Contributions and salary growth potential
The dataset has incomplete member salary records and contains salary information only for those who choose the DC plan, not of those remaining in the DB. The correlation between employer contributions and salary for DC members was 0.83 and is therefore a reliable proxy for income. Controlling for other variables, a higher employer contribution level indicates prior higher salary growth or appointment at a relatively higher salary level, whereas lower employer contribution levels indicate more ‘upside’ salary growth potential. Greater upside salary growth potential may be expected to favour the DB plan, particularly if salary growth is expected to occur later in a member's working life. The best ‘return’, from a retirement payout perspective, is gained by members employed at a low job classification/salary level where they remain for all but the last 3 years of their working life at which time they receive a promotion to the highest level.
From a member's point of view, it is possible they are indifferent to the cost of contributions in that their required contribution is a fixed proportion of salary no matter what level they are employed at and irrespective of career path. In dollar terms, the cost to a member is linked to employment/salary level and a member joining at a higher level pays a higher cost, particularly if there is no upside salary growth potential later in their career. Higher income and contributions earlier in a member's career ‘matter most, because savings can earn compound interest over a longer period’ (Mitchell, Reference Mitchell2011, p.4). This may prompt member choice of the DC plan. Additionally, younger high-income earners face a risk of declining income and contributions over their working lives. Although a lower risk possibility, the DB plan provides a poor outcome in such an event, particularly if a lower job position occurs in the last 3 years of employment. In both cases, high contributions suggest a relative preference for the DC plan.
H3: The marginal effect of contribution level on the likelihood of selecting the DC plan increases with the contribution level.
H4: The marginal effect of the contribution is positive for younger members.
4.2.3 Market performance and short-term uncertainties
A crucial factor in the choice between the DB and DC plans is investment risk: pooled in the former and borne by the individual in the latter. The relative level of investment risk is also important as the lump-sum factor payable by the DB plan is actuarially assessed based on the investment portfolio of the plan. A member knowledgeable of the DB plan and comfortable with a higher level of investment risk, or taking a different view as to investment risk, may choose the DC plan and select an appropriate investment strategy. A key component of the available investment options is equity, which comprises at least 50% of the DB portfolio.
Previous work has highlighted the influence of past performance on DC asset allocations in Australia (Gerrans et al., Reference Gerrans, Gardner, Speelman and Clark-Murphy2006) and savings levels in U.S. 401(k) plans (Choi et al., Reference Choi, Laibson, Madrian and Metrick2009). Choi et al. (Reference Choi, Laibson, Madrian and Metrick2009) focus on the relationship between changes to U.S. 401(k) contributions savings levels and the individual's past investment performance. Their ‘results indicate that savings decisions are affected by random accidents of personal financial history that should not matter to a rational agent’ (Choi et al., Reference Choi, Laibson, Madrian and Metrick2009, p.2516). The timing of joining a superannuation fund, whilst not accidental, should similarly not introduce a systematic influence on a fundamental decision such as the DB/DC choice. That is, a decision regarding long-term savings should not be unduly influenced by recent market performance, given the lack of evidence that such effects have long-term predictive power. For Existing members, we have market circumstances as at 1998. For New members, the data afford analysis over varied market conditions. The second half of 2001 through the end of 2002 and from early 2007 through the first half of 2009 were periods of increased equity market volatility; by contrast, the middle of 2003 to the end of 2004 was a period of much lower market volatility. This relationship is explored by reference to the performance of the overall Australian stock market over the 24-month period ending the month prior to the choice date.Footnote 7 A second measure is a categorical variable indicating whether the month prior to the choice date was a negative return month. Our hypothesis is:
H5: The likelihood of selecting the DC (DB) plan is positively related to the level of market performance and negatively related to recent market declines.
The relative risk level chosen by those selecting the DC plan may be similarly affected by recent market performance. The choice to leave the DB plan, choose the DC plan and then choose a lower investment risk is an interesting possibility. A belief that fixed interest and cash may outperform other asset classes may justify such a choice (among a number of other factors; see below). The extent to which the relative risk choice of DC investment strategy is more or less sensitive to recent market performance is investigated with the following hypothesis:
H6: Recent market performance impacts differentially the likelihood of choosing lower and higher investment risk strategies.
4.2.4 Gender
As noted earlier, gender has often been identified as relevant to determining the level of risk in financial decisions. Women have generally been identified as more risk averse in financial decision-making contexts through risk attitude questionnaires (Faff et al., Reference Faff, Hallahan and McKenzie2011), experiments (Charness and Gneezy, Reference Charness and Gneezy2012), stock investments (Barber and Odean, Reference Barber and Odean2001) and retirement savings (Neelakantan, Reference Neelakantan2010), attenuated by marital status and education. Gerrans and Clark-Murphy (Reference Gerrans and Clark-Murphy2004), using survey data drawn from the same fund examined in this study, find greater risk aversion among women. Given this, the following hypotheses are investigated:
H7: Male members are more likely to choose the DC plan.
H8: Male members are more (less) likely to select the higher (lower) investment risk level than selecting the DC plan with the same level of investment risk.
4.2.5 Greater investment control
A suggested motivation for selecting the DC plan is to allow greater control over investment strategy. Prima facie, this should be evidenced by members selecting other than the default investment strategy. Otherwise the same investment strategy can be achieved through the DB plan with risk pooled with other members. This may be confounded by those members commencing on higher salary/contributions levels who may still choose the default investment risk on the basis of the ability to earn compounded returns for a longer period of time on their higher contributions. Further, Shum and Faig (Reference Shum and Faig2006) find a positive relationship between income and the likelihood of holding equity, and Goetzmann and Kumar (Reference Goetzmann and Kumar2008) find a positive relationship between income and equity holding sophistication. This suggests that a preference for greater investment control is more difficult to discern solely from the relative proportions selecting each investment strategy. However, if a preference for investment control dominates, the relative proportion choosing non-default investment strategy options should be expected to be larger than the default option choice. Therefore:
H9: Those selecting the DC plan will be more likely to select a non-default investment option.
4.2.6 Controls: staff type, year, balance
A dummy variable was included for member classification as either academic or administrative. Security and length of employment may vary by this classification with possible effects on DB/DC choice. In the New sample, calendar year dummies are included to account for superannuation system and fund changes that have occurred over the sample period. Changes have varied in significance but have not altered the relative attractiveness of DB or DC plan.
For the Existing member sample, the experience of the 1990s was one where ‘the DB was comfortably overfunded, at times exceeding 140% of its vested liabilities’ and member benefits increased (UniSuper, 2010, p.11). For the New member sample periods of greater volatility were experienced in 2002 and 2008.Footnote 8
For the Existing sample, the estimated pension benefit or balance was also available at the time the choice was made. This was not, of course, applicable for the New member sample. It was noted above that, in the UK at least, there are pension plan participants willing to gamble on returns until the point where the size of bet influences net wealth (Clark et al., Reference Clark, Caerlewy-Smith and Marshall2009). In related studies, individual and household wealth has been shown to be positively related to risk tolerance (Clark et al., Reference Clark, Strauss and Knox-Hayes2012). We therefore include account balance in the Existing sample regression. A number of factors remain, which may influence the selection that we are unable to control for. Chief among these is financial skill and system knowledge. Segmenting samples into New and Existing members, however, provides a partial control for system knowledge. We are also unable to control for savings outside of the superannuation fund and the broader portfolio in which it sits.
4.2.7 Summary of hypotheses
The hypotheses to be investigated can be summarised by their locus of attention. The first focuses on individual member demographics: age (1); and gender (7, 8). The second focuses on the impact of plan design and its interaction with member characteristics, specifically lump sum multiples and age (2) and contributions and age (3, 4). The third group focus on psychological influences, namely the external market performance (5, 6) and the desire for control (9).
4.3 Methodology
A multinomial logit model was estimated for the two samples. Members were classified into one of four choice groups. The first comparison group contains those members who remained in the DB plan, either actively or passively. For those who elected to move to the DC plan, three further groups were identified. The second group contains those members who elected the DC plan and selected the same level of investment risk as the investment strategy of the DB, which was also the default DC investment strategy. The third group selected an investment strategy with a lower investment risk than the default investment strategy, and the fourth group selected an investment strategy with a higher level of investment risk.
5 Summary of results
5.1 Sample profiles
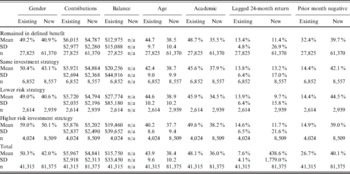
Summary statistics for the two samples, Existing and New, are presented in Table 1. The Existing sample member had an average age of 43.9 years with 6-month contributions of $5,967, and was approximately equally likely to be male or female as well as academic or general staff. The average member age of the New sample is more than 5 years younger at 38.5 years. This is to be expected given the Existing membership was a cumulative sample of members. For the same reason the lower 6-month contributions of $4,830 for the New sample is to be expected.Footnote 9 The New sample has a smaller proportion of academic members (36.1%) and a smaller proportion of male members 42%, representing a relative shift in employment patterns in the University sector and overall economy over the past decade.
Summary statistics: Existing and New samples This table presents summary statistics for the two samples of members. ‘Existing’ includes those who were members as at 30 June 1998, prior to the introduction of the choice. The ‘New’ sample includes those who joined from 1 July 1998. Contributions reflect the 6-month contributions for the first full 6-month reporting period available for the member. Contributions have been indexed to wage inflation to be comparable with end of 2009 values. Age is calculated at date of choice. The ‘12-month return’ is the All Ordinaries Share Price Index to the month-end preceding the choice month. ‘Negative Month’ is the proportion of times a particular choice was made that the preceding month had a negative return as measured by the All Ordinaries Share Price Index.

5.2 Overall DB/DC choice
For members in the Existing sample who were first given the choice to opt out of the DB and into the DC plan, approximately 67% of members (actively or passively) chose to remain in the DB plan.Footnote 10 New sample members were initially more willing to opt out of the DB. In fact the new members of 1999 had the highest proportion of members leaving the DB and joining the DC (56%). Since 1999, the proportion of each new member cohort remaining in the DB has increased reaching 73% by the end of 2009. This pattern of a spike in choice followed by increased default behaviour is consistent with more active decision making initially as a consequence of the increased attention given to the option of making a choice for the collective membership. Brown and Weisbenner (Reference Brown and Weisbenner2007) and Palme et al. (Reference Palme, Sundén and Söderlind2007) report similar results.
5.2.1 Existing members: investment strategy choice
Having made the choice to move to the DC, a member is then required to choose an investment strategy.Footnote 11 The investment strategy can be classified as either the same, lower or higher level of investment risk relative to the default investment option. Of the 33% of Existing members who chose the DC plan, 51% who selected the default investment option. That is, 51% moved out of the DB plan, assumed the investment risk of the DC plan, and then selected an investment risk equivalent to that of the DB plan. Thirty per cent chose the higher investment risk ‘Shares’ option with 19% selecting the lower investment risk than the DB strategy (14% Stable and 5% Secure).
5.2.2 New members: investment strategy choice trend
New members were initially more likely to choose a higher risk DC plan option than members in the Existing sample. For example, 38% of the members who joined in 1999 and selected the DC plan chose the higher risk ‘Growth’ option. However, as the overall proportion selecting the DC declined, so did the proportion selecting the higher risk option, which dropped to 29% in 2002, mirroring declines in the stock market.
In October 2002, several significant changes were made to the DC investment choice menu, including an expansion of options to seven.Footnote 12 Of greater significance was a reduction in the default investment strategy risk, with equity allocation reduced from 62.5 to 52.5% and the allocation to fixed interest increased from 15 to 30%. In July 2005, the ability for members to mix across options was introduced. Where a member made such a choice they have been classified to one of the categories (same, higher, lower risk) on the basis of the weighted-asset allocation underlying the choice using the reported strategic asset allocations. Reflecting the market rise to November 2007, the proportion of those selecting a higher investment risk strategy increased, although the overall proportion choosing to opt out of the DB declined significantly, ‘recovering’ by 2009 to just 11%.
5.3 Regression analysis
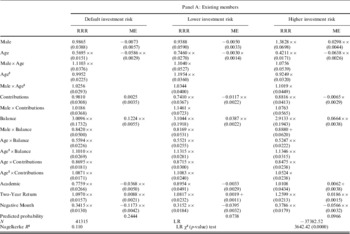
Results of the regression analysis of member choice are presented in Table 2, with panels for the Existing and New samples. The table presents relative risk ratios and marginal effects of a multinomial regression of the DB/DC choice with remaining in the DB plan the baseline category. The three reported categories represent the investment risk classification of those who selected the DC plan: the same investment risk as the default investment strategy, lower investment risk than the default, and higher investment risk than the default investment strategy.
Regression estimations: This table reports the estimates of a multinomial regression of the initial DB/DC choice members faced with remaining in the DB plan (the baseline comparison). The three reported categories represent the investment risk choice of those selecting the DC plan: equal to the default (‘Default’); or lower or higher than the default. Panel A presents results for the sample of Existing members who were eligible for the choice for the first time. Panel B presents the sample of New members who joined between 1 July 1998 and 31 December 2008. Within each category, the first column presents the relative risk ratio. The second column presents marginal effects evaluated for a one standard deviation change for continuous variables (Age, Contributions, Balance (for Existing only) and Lagged Two-Year Market Return). The unstandardised mean of each is in Panel A (B): Age 44 (38), Contributions $5,967 ($4,830), Balance $15,750 (n/a). The standard deviation of each in Panel A(B): Age 10(10), Contributions $2,918 ($2,429) and Balance $33,450 (n/a). Categorical variables are set at Male, Academic and a Negative Lagged Market Month. At the bottom of the marginal effect column is the predicted probability of the choice evaluated at the mean value of each continuous variable and each categorical variable set to Female, General staff, and not a Negative Return Prior Month (i.e. all categorical values = 0). The Smalland Hsiao (Reference Small and Hsiao1985) test of independence and irrelevant alternatives was estimated for the deletion of each category in turn and rejected at 99% confidence level using likelihood ratio tests. Additionally a collapsed three category regression was estimated with likelihood ratio and Wald tests, by in turn combining all pairings of dependent categories (six in total). Each rejected collapsing the categories. Robust standard errors were estimated for both samples with residuals also clustered by year for the New sample. Significance indicated at 99% (××), 95% (×) and 90% (+) levels.


Panel A presents results for the Existing sample of members who were eligible for the choice of DC over DB. Panel B presents the sample of members who joined between 1 July 1998 and 31 December 2008. Within each category, the first column presents the relative risk ratio. The second column presents marginal effects evaluated at a one standard deviation change for continuous variables which have been standardised to enable easier comparison (Age, Contributions, Balance (for Existing only) and Lagged 24-month Market Return).
A test for independence of irrelevant alternatives was estimated for the deletion of each category in turn, which was rejected in each case. A collapsed three-category regression was also estimated and rejected in preference to the fully reported model by combining all pairings of dependent categories (six in total). Robust standard errors were estimated for both samples with residuals also clustered by year for the New sample. Time dummies were included for the New sample with each significant for each investment risk category with the exception of the year 2000 dummy for the same and lower level of investment risk.
5.3.1 Age
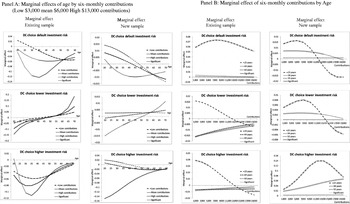
The relative risk ratio for age is <1 for the choice of each DC risk level relative to remaining in the DB plan for the Existing sample. Panel A of Figure 1 presents marginal effects of age on DC plan option choice by contributions level. The marginal effect of age is negative at mean values and U-shaped over the age range for selecting the DC choice with either the same or higher investment risk level relative to remaining in the DB. These results support hypothesis (H1) of a negative marginal effect of age on DC plan choice. There is a differential relationship by contributions level, though this is significant only between ages 35–45 years and age 60 years and beyond. The largest negative marginal effect for selecting the DC plan with the same or higher investment risk is at age 30 and 35 years, and significantly larger for those with the highest contributions level. The marginal effect of age on selecting the DC plan with a lower investment risk level increases with age. Across contributions levels the marginal effect is negative until age 40 and positive for those age 50 years and over. While the size of the marginal effect is larger for higher contributions levels it is not generally significant. Therefore, there is no evidence supporting the positive contributions and DC choice hypothesis (H3). There is no significant positive marginal effect at any age less than 40, with the marginal effect either not significant or significantly negative. Only the DC choice with lower investment risk has a positive marginal effect at older ages.
Selected marginal effects for DC risk level choice.

For the New sample the marginal effect declines over age for the DC choice with the same level of investment risk. For those with the lowest (average) contributions level, the marginal effect of age is positive and significant to age 40 (35), and negative and significant from age 55 years for both contributions levels. For those on the highest contributions levels the marginal effect of age is negative and significant between ages 40 and 50 years for the DC choice with the same level of investment risk. A positive marginal age effect is evident for those on lower contributions in the selection of the DC choice with higher investment risk but restricted to those between ages 35–40 years. A strong negative age marginal effect for those on the highest contributions level reflects the greater likelihood that they choose the DC plan with the same or higher investment risk. Until age 45 years the higher contributions group is more likely than those with lower contributions to select the DC choice. Age reduces this effect rapidly in the case of the higher risk option.
In terms of second hypothesis (H2), of a positive age and DC plan choice, the results for the Existing sample are not generally supportive whereas they are for the New sample. The results support the view that members do consider the lump-sum factors relative to their age at choice date. For the Existing sample, the results suggest a peak marginal effect for age on selecting the DC plan options prior to age 40 reflecting the DB lump-sum payouts which are flat to age 40. Beyond age 40, the negative marginal effect for age becomes smaller in magnitude for the same and higher DC investment risk options and positive for the DC plan with a lower investment risk. Similarly, for the New sample, the overall marginal effect is either positive or not significant for each DC risk choice until age 35. For the DC choice with the higher risk level the average marginal effect is negative from age 35.
The exception to what could be deemed a ‘rational’ or at least expected approach is found in the trend in the marginal effect of age or choice of the DC plan with lower investment risk. For the Existing sample, the significant and positive marginal age effect suggests older members took on lower investment risk themselves rather than remaining in the DB plan with its more generous expected payout and pooling of risk. These members generally had larger balances. For New members there is also evidence of a positive marginal age effect, though it is small in magnitude, relatively constant and restricted to those on lower contributions.
5.3.2 Contributions levels
Panel B of Figure 1 identifies that the marginal effect of contributions is contingent on member age and the contributions level. For the DC choice with a higher risk level the marginal effect is increasing at average member age for the New sample but constant for the Existing sample. Most notable, however, is the profile of younger members, where a humped profile is suggested in the New sample for each DC risk level. The marginal effect is positive and significant for the DC choice with higher investment risk but becomes negative for higher contributions levels for the same and lower investment risk. This humped profile for the youngest members is also evident for the same investment risk level in the Existing sample. Younger members with high contributions were suggested as more likely to select the DC plan which this profile bears out with the exception of the negative and significant effect for very high contributions. This result coupled with the flat and not significant marginal effect for the oldest age group and positive and increasing effect for the DC with the higher investment risk, in the New sample, support a reasoned approach to the choice. The evidence thus provides qualified support for the hypotheses of a positive relationship between contributions and DC plan choice (H3, H4).
5.3.3 Market performance
The relative risk of selecting the DC plan with any of the risk levels for the Existing sample is increased with positive lagged 24-month market returns. The marginal effects of lagged market performance are positive and significant at mean values of other regressors and averaged over categorical variables. The largest marginal effect is for those who select the DC choice with a higher investment risk level. The result is also evident in the New sample, though the impact is reversed for the DC choice with a lower investment risk. That is, the relative risk of selecting the DC plan with a lower investment risk reduces with increased market performance. This supports the hypothesis (H6) of a differential impact of market performance on DC risk choice.
For the Existing sample the relative risk of choosing the DC plan with any risk level is reduced if the previous month had a negative market return. The marginal effect is large and significant for the same and higher risk levels. If the previous month's return was negative the probability of selecting the DC plan with the same level of investment risk as the default reduces by 11.7 percentage points. The likelihood of choosing a higher risk option reduces by 5.6 percentage points. Given the investment horizon of retirement savings the apparent size of the influence of the prior month's return is striking. For the New sample the influence of a negative previous month return is only significant for the DC choice with the same level of investment risk. With this exception, the results support the market performance and DC choice hypothesis (H5).
5.3.4 Gender
The regression results suggest that for the Existing sample a gender effect in isolation is only significant for the likelihood of selecting the DC with a higher investment risk level. However, the gender marginal effect for other options is mediated by age, level of contributions and balance. The male marginal effect is negative up to age 35–40 years for selecting the DC plan with the same level of investment risk. It is most pronounced for those with higher contributions and balances. There is no significant effect beyond age 40 until a significant positive effect emerges beyond age 55. A negative and significant male effect is evident for those selecting the DC choice with a lower investment risk level relative to remaining in the DB, but is isolated to those with average or lower contributions levels less than 45 years of age. However, a positive and significant male effect is evident for older males with a high contributions level. This is an exception to the general trend of males selecting higher investment risk options. The clearest male effect is found in those who select the DC plan with a higher investment risk level. The marginal effect is positive, reducing with age and highest for high contributions levels which also reduce with age.Footnote 13
The positive marginal effect for males in selecting the DC plan with a higher investment risk is also suggested in the New sample. The same increasing marginal effect with age for males is evident for selecting the DC plan with the same investment risk level. As with the Existing sample, this is positive for those with higher contributions beyond age 45 years. For those on average contributions level, the effect is only significant beyond age 60. Unlike the Existing sample a negative male effect is only significant for those on the lowest contributions level between 30 and 40 years of age. A negative and significant marginal effect is estimated for males for selecting the lower DC investment risk restricted to younger males, less than 30 years, on low to average contributions. The regression was re-estimated with the lower investment risk strategy as the base category. For the New sample, a positive male marginal effect is again found for the selection of the DC plan with the same or higher investment risk relative to the lower investment risk. For the Existing sample a significant and positive marginal effect for males is restricted to the higher investment risk DC plan relative to the lower investment risk DC plan, reduced by age. These results broadly support hypotheses of higher risk tolerance among males (H7, H8).
5.3.5 Relative risk choice
For the Existing sample, 50% of those who selected the DC plan chose the default level of investment which is the same as in the DB plan. For the New sample the results are mixed. Between 1999 and 2002 the largest proportion selected the same investment risk as the default whereas from 2003 this reversed. The total number selecting the DC plan reduced significantly so the percentages are relative to smaller numbers. Thus the hypothesis that those choosing the DC plan do so for a sense of control (H9) is not supported for the Existing sample and is inconclusive for the New sample.
5.4 Alternative model
An ordered probit was also estimated to explore the suitability of a ranking of the choices. Two rankings were examined. The first ranked remaining in DB as the lowest risk, then DC choice with a lower level of investment risk; then a DC choice with the same investment risk; and finally a DC choice with a higher level of investment risk. The second swapped the ordering of remaining in the DB with choosing a DC plan with a lower level of investment risk. In both cases a test of the parallel lines assumption is significant which rejects the ranking estimation. This rejection is significant at a 99% confidence level for both samples.
5.5 Synthesis of results
Recognising that the DB plan provides a formula for calculating retirement income while the DC plan makes no such promise of retirement income and is subject to the risks associated with investment decision-making and performance, much of the academic literature supposes that because human beings are risk averse, most people would choose to remain in the DB plan rather than assume the risks associated with DC plan. At the same time, it is widely believed that risk exposure is probably age-related in that younger employees in the early stages of their careers might reasonably take on high levels of risk because of their capacity to absorb any costs associated with such a strategy. Likewise, if older workers are likely to be more risk averse than younger workers, higher income older workers may be able to assume higher than average risks because they can also better balance risk and returns. In any event, as we noted in the literature review, there are likely to be members that are willing to gamble on their future welfare.
The empirical results obtained in this paper largely confirm these expectations. That is, amongst Existing members (1998), it was younger members and more so those with higher incomes who chose the DC over DB, but only with investment options of the same or higher investment risk than the DB. As regards selecting the choice of the DC with a lower investment risk relative to remaining in the DB, the marginal effect of age was positive for older, higher income individuals notwithstanding the foregone advantages of remaining with the DB plan for an enhanced lump sum. For New members (1999–2008), it was younger, higher income members that tended to choose the DC, at least initially, with the same or higher investment risk. For the DC choice with a lower risk, the marginal effect of age was positive particularly so those with higher incomes. We also observed that the results from behavioural psychology suggest that male members rather than female members were more likely to assume the risks associated with the DC environment. While we also found a gender effect for the DC choice with the same level of risk, the intriguing result was that this effect was pronounced for older men with higher contributions. For younger males, the effect was in fact negative, similar to that estimated for the DC choice with lower investment risk. Missing from our analysis is the possible interaction between household members in terms of the allocation of the various risks associated with families and partners together saving for the future.
By this account, our findings are broadly consistent with related research in pension economics and finance, as well as behavioural psychology. Nonetheless, there remains a significant issue: the fact that a significant group of those choosing the DC plan chose an investment portfolio with a risk profile mimicking the DB plan left behind. Here, there are three possible explanations we would wish to emphasise (recognising that there are other possible explanations for this behaviour). One possibility is that those that moved to the DC plan did so, so as to assume control of their retirement ‘pot’ thereby claiming the opportunity to be ‘active’ managers of their entire savings portfolios (including property, bank accounts and other types of savings instruments). This explanation would be consistent with relating findings to the effect that those that plan for retirement are older, higher educated and higher income individuals (Clark et al., Reference Clark, Strauss and Knox-Hayes2012). It is also consistent with widespread belief that, notwithstanding significant age-related DB lump-sum payments at retirement, DB retirement savings are not as fungible as DC plans.
A second explanation builds upon the first; having claimed control over their pension pot DC plan participants either doubt their ability to be effective investors or realise that control comes at a price (risk). Looking for security, they adopt the DB plan investment option because they perceive it to be a low-risk option underwritten by their confidence in UniSuper's trustees. As such, it is much like Roy's (Reference Roy1952, 432) argument to the effect that ‘real people’ do not have ‘precise knowledge of all possible outcomes of a given line of action, together with their respective probabilities’ and are risk averse especially as regards the possibility that an economic disaster might wipe-out their savings. As such, our results suggest that, at one level, those who choose the DC plan do for reasons that trump risk aversion; but recognising the risks assumed, they seek to manage those risks by the risk management strategies of their institutional sponsor. A third possible explanation is that those who chose the DC plan did not understand the risks assumed and once in that environment took fright and sought to mimic that which they had lost by reason of their overconfidence. It is also possible that a similar such group, who may not understand the risks, remain in the DB plan.
We also found that both Existing and New members were sensitive to the past performance of financial markets. Again, this is consistent with recent research in finance and economics, where it has been shown that market events and momentum can prompt individual investors to trade in and out of the market and even change their asset mix (Calvet et al., Reference Calvet, Campbell and Sodini2009). In large part, academic research on this topic suggests that being market responsive is a losing game; typically, individual investors are naive investors compared with their professional counterparts. Basically, it is widely believed that individual investors respond to events after any value has been reaped by institutional investors and respond to market momentum in the light of exuberance amplified by the print and electronic media. It is telling that the largest effect of market movements was found for Existing and New members that selected the DC plan with the highest investment risk. It was also found that the probability of selecting the DC plan with a lower investment risk decreases with increasing market performance for New members.
In a related manner, the declining attractiveness of the DC plan, especially amongst younger, less educated New members, may be a reflection upon increasing market volatility over the period 1999–2008. Whereas older more educated, and higher income members may see a benefit in controlling the pension ‘pot’ it is possible that newer members, realising their ignorance of the structure and performance of global financial markets, chose to retreat from engaging with risk directly, thereby choosing deliberately or by default to remain in the DB environment. The systematic nature of this behaviour over the period 1999–2008 is all the more striking given the media's increasing preoccupation with retirement funds' quarter-to-quarter returns over the same period. If anything, it seems that heightened media scrutiny of these issues convinced a large proportion of New members to stick with the tried-and-true DB formula for retirement saving.
6 Conclusions
In this paper, we analyse the patterns and correlates of participants' voluntary choice of DC over DB plans. Relying on data provided by one of Australia's largest funds, we focus in particular upon a one-time moment of plan choice for Existing members (1998) and the choices made by New members to the fund over a 10-year period (1999–2008). Unlike many instances where plan participants are effectively forced into one plan or the other, in this case the pension plan has provided the option of choosing DC over DB; this option is accompanied by a large volume of information appropriate to making an informed choice. Furthermore, employers participating in the multi-employer fund have not sought to drive the choice towards one plan or the other. The fund has, as much as possible, been neutral about the choice while identifying the likely costs and risks associated with choosing DC over DB.
The choice provided to Existing and New members has been a once-and-for-all choice: that is, being automatically enrolled in the DB plan, to choose to switch to the DC environment is irrevocable. As we show in the paper, some people who do make the switch nonetheless retreat to the asset allocation (risk profile) of the DB plan left behind. Three striking patterns are apparent in the data: first, in 1998, approximately one-third of Existing members made the choice to switch to the DC plan; second, over the period 1999–2008 the proportion of New members switching from DB to DC declined dramatically such that by 2008 less than 20% of New members opted for the DC plan. If left to themselves, the average plan participants would remain in the DB environment, whether by default or by active choice. Third, we show that there is considerable variation in behaviour and risk preferences between plan participants. If we take into account their age, gender, imputed incomes, and responsiveness to market movements and momentum, then it becomes clear that the notion of an ‘average’ participant hides considerable heterogeneity in behaviour.
Much of the literature on the transition from DB to DC in the Anglo-American world concentrates on the expected costs of DB promises for employers and the preferences of younger workers, in particular for risk-based compensation and the portability of workplace retirement savings. In a sense, the transition from DB to DC has been sustained by employer interests in containing expected costs and employee interests in new forms of performance-based compensation (as suggested by Teece, Reference Teece2000). While this particular study does not directly deal with employer interests or, for that matter, employee preference for different kinds of compensation packages, it is apparent that those participants who chose to switch tended to be younger and higher paid. Having reported the marginal effects, it is notable that in this large Australian multi-employer industry fund, younger and lower-income members have, over time, retreated from the risks associated with the DC plan. We suggest that one explanation for the retreat of younger members from risk is their increasing anxiety about financial market volatility.
There are, as indicated above, plausible reasons to suppose that any switch from DB to DC is an informed choice consistent with members' goals and objectives. Nonetheless, the fact that a significant portion of those who switch rely upon the asset allocation formula of the DB plan they left behind indicates that some may regret their irrevocable decision while others may rely upon plan trustees to set the investment strategy because they lack confidence in making good on the option to choose encompassed by switching to the DC environment. This raises two questions. First, should the option to switch from DB to DC be subject to tests of reasoning and understanding? Second, should the choice of DC over DB remain irrevocable? These questions are part of a larger agenda of research focused upon the design of DC plans in the context of the lessons learned from the behavioural revolution (Clark and Urwin, Reference Clark and Urwin2011).