Implications
In African small-holder free-ranged farming systems, reproduction is a key component for improving livestock productivity. Reliable estimates of parturition rates are needed to orientate decision makers and research. Naïve, crude rates can be misleading. Annual parturition rates can be highly variable depending on the 12-month periods considered. Rates estimated on short-term data, even with gold standard field survey methods, must be considered cautiously.
Introduction
Many parameters have been proposed for evaluating reproduction performances of ruminants in tropical farming systems. In intensive farming conditions or experimental stations, reproduction is controlled and continuous observations of the reproductive status of females (e.g. anoestrus, oestrus, service and gestation periods) are available. This enables to calculate detailed parameters such as the percentage of mated or inseminated females that become pregnant or the average number of services per conception (Mukasa-Mugerwa, Reference Mukasa-Mugerwa1989). In free and extensively ranged systems (even in Northern countries, e.g. Marzin and Liénard (Reference Marzin and Liénard1984)), reproduction is generally uncontrolled. Males and females are reared together and births occur throughout the year, although seasonal peaks are generally observed. Mating and reproductive cycles cannot be individually monitored without cumbersome protocols and cruder reproduction parameters must be used.
One of these parameters is the number of parturitions, say h, encountered in average by a reproductive female, if this female spends the whole year in the herd. In such a parameter, for simplification, females are classified as reproductive when they are older than a given age (which can depend on farming systems). A frequent estimate of h is the ratio h c = m/T, so-called ‘crude annual parturition rate’ (e.g. ILCA, 1990; Lhoste et al., Reference Lhoste, Dollé, Rousseau and Soltner1993), where m is the observed number of parturitions during the year in the herd and T the corresponding total time of presence of the reproductive females. This estimate is simple to calculate but suffers from several difficulties. It is only valid if instantaneous hazard rates (i.e. probabilities of occurrence in a very short period of time) of parturition and of its competing events (such as mortality or other exits from the herd) are constant with time. In that situation, m follows a Poisson distribution and h c is the maximum likelihood estimator of h (Kalbfleisch and Prentice, Reference Kalbfleisch and Prentice1980; Laird and Olivier, Reference Laird and Olivier1981; Agresti, Reference Agresti1990). In other cases, h c is biased and represents an apparent parturition rate. For instance, when parturitions and females’ sales or slaughtering are seasonal, h c can vary without biological meaning, depending on whether the main parturition season is sooner or later than sales or slaughtering periods (this point is discussed later). An additional source of bias in h c comes from the calculation of T. Accurate T estimates can only be obtained from longitudinal herd follow-up with data recorded at animal level (for examples of protocols, see Poivey et al. (Reference Poivey, Seitz and Landais1981), Faugère and Faugère (Reference Faugère and Faugère1986), Faugère et al. (Reference Faugère, Merlin and Faugère1991), de Leeuw et al. (Reference de Leeuw, McDermott and Lebbie1995), van Klink et al. (Reference van Klink, Corten and Kalonoki1996) and Metz and Asfaw (Reference Metz and Asfaw1999)). In other protocols, such as herd follow-up surveys without animals identification (Berthet-Bondet and Bonnemaire, Reference Berthet-Bondet and Bonnemaire1986; Landais and Sissokho, Reference Landais and Sissokho1986; Huttner et al., Reference Huttner, Leidl, Pfeiffer, Kasambara and Jere2001; Madani et al., Reference Madani, Hubert, Vissac and Casabianca2002; Bebe et al., Reference Bebe, Udo, Rowlands and Thorpe2003) or cross-sectional retrospective surveys based on farmers’ recall (SEDES, 1975; CIRAD-IEMVT, 1989; ILCA, 1990; Planchenault, Reference Planchenault1991; Lhoste et al., Reference Lhoste, Dollé, Rousseau and Soltner1993; Lesnoff et al., Reference Lesnoff, Saley, Adamou, N’Djafa Ouaga, Ayantunde and Gérard2008), T needs to be approximated. A common approach is to replace T by estimates of the average reproductive herd size (following the same principle as in the life table method in human demography (Chiang, Reference Chiang1984)). Accuracy of this approximation depends on the frequency (e.g. monthly, quarterly or yearly) of data used to estimate the average herd-size.
The objective of the article is to evaluate the bias of the crude annual parturition rates h c, without or with approximations of T, when estimating h. Empirical bias of h c was calculated by comparison to a gold-standard, calculated on long-term longitudinal herds’ follow-up data on cattle and small ruminants.
Material and methods
Data sets
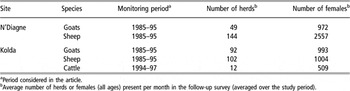
Data used for bias calculation were collected during two past research programs (PPR: Pathologie et productivité des petits ruminants and ABT: Alimentation du bétail tropical) jointly implemented by ISRA (Senegalese Institute of Agricultural Researches) and CIRAD (French Agricultural Research Centre for International Development). Herds were selected in traditional villages sampled from northern to southern Senegal. Two sites, N’Diagne and Kolda, were considered in the article (Table 1), representing different rainfall patterns. N’Diagne is located in northern Senegal (16.10W; 15.38N) and is classified in the Sahelian eco-climatic type with an average annual rainfall of 300 mm. Kolda is located in Upper-Casamance in southern Senegal (14.94W; 12.88N) and is classified in the Sudano-Guinean eco-climatic type with an average annual rainfall of 1.110 mm.
Data sets used to estimate the relative bias in annual parturition rates

aPeriod considered in the article.
bAverage number of herds or females (all ages) present per month in the follow-up survey (averaged over the study period).
In each site, herds have been monitored by field enumerators using the same protocol (Faugère and Faugère, Reference Faugère and Faugère1986; Faugère et al., Reference Faugère, Merlin and Faugère1991). At the first farm visit, all the animals present in the herds have been recorded and identified with ear-tags. Herds have been subsequently visited every 15 days. At each visit, exact dates of all parturitions, exits (natural deaths, slaughtering, sales, gifts, loans and withdrawals) and entries (purchases, gifts and loans) occurred since last visit have been recorded. Data have been stored in a relational database especially designed for herd follow-ups (with animal identification) in tropical extensive farming systems (Juanès and Lancelot, Reference Juanès and Lancelot1999). Recorded information have already been analyzed in other contexts (Faugère et al., Reference Faugère, Dockes, Perrot and Faugère1990a and Reference Faugère, Dockes, Perrot and Faugère1990b; Clément et al., Reference Clément, Poivey, Faugère, Tillard, Lancelot, Gueye, Richard and Bibé1997; Lesnoff, Reference Lesnoff1999; Lancelot et al., Reference Lancelot, Lesnoff, Tillard and McDermott2000; Ickowicz and Mbaye, Reference Ickowicz and Mbaye2001; Ezanno et al., Reference Ezanno, Ickowicz and Bocquier2003).
Five data sets have been used in the article (Table 1): cattle (one), goats (two) and sheep (two). Study periods were 1994–97 for cattle (Kolda) and 1985–95 for small ruminants (N’Diagne and Kolda).
Annual parturition rate
Gold standard estimate
When estimating h over a 12-month period, one approach to eliminate bias due to variable competing risks (Prentice and Kalbfleisch, Reference Prentice and Kalbfleisch1978) is to calculate hazard rates over successive short sub-periods of times (e.g. day, week, fortnight or month) and then to sum the sub-period rates over the whole period. Calculating rates for each sub-period independently and then summing sub-period rates enables to represent more accurately the expected average number of parturition by reproductive female spending whole year in the herd. This approach is close to the one used in the non-parametric Kaplan–Meier survival model when instantaneous hazard death rates are calculated at each time of death or censoring and then summed to get the cumulative hazard rate (Collett, Reference Collett2003).
Time was decomposed into monthly intervals. Finer decomposition can improve the estimate. Nevertheless, improvement was negligible on our data sets (results not detailed here). Shorter sub-periods also had the drawback to generate larger databases, especially for long-term follow-up (e.g. a weekly decomposition of the demographic data of sheep in N’Diagne generated a database of size higher than 80 Mo).
For a given 12-month period, the annual parturition rate estimate used as reference was defined as the sum of the monthly rates:

where j is the index of the month in the 12-month period, h c,j = mj/Tj, Tj is the time of presence of the reproductive females (defined as females older than a given exact age) in the herd in month j, mj is the number of parturitions in month j.
Crude estimate and approximations
For the 12-month period, the crude estimate (without approximation) of the annual parturition rate was calculated by h c1 = m/T, where T is the time of presence of the reproductive females in the herd in the period  and m the number of parturitions
 .
Five approximations of the crude estimate (h c2 to h c6) were calculated by m/T approx, where T approx represents estimates of average reproductive herd size. Denoting t the time (in month) within the 12-month period (t = 0 and t = 12 correspond to beginning and end of the year, respectively) and nt the number of reproductive females present at time t in the herd, T approx was calculated by:
–
 (monthly average),
- (quarterly average),
–
(half-yearly average),–
(yearly average),–
(end of the 12-month period).
 (monthly average),
 (quarterly average),
 (half-yearly average),
 (yearly average),
 (end of the 12-month period).
Bias calculation
To take into account for seasonal patterns, successive 12-month periods have been built (within study periods) by shifting the annual observation period of one month each time: 36 successive 12-month periods have been built for the period 1994–97 and 120 for the period 1985–95. For each 12-month period, bias has been evaluated as follows. We calculated the reference rate h ref and then the crude rate h c1 and its approximations (h c2 to h c6). The relative bias (in percentage) was calculated as 100 × (1 − (h ci/h ref)) for i = 1 to 6. A positive relative bias means an overestimation of h ref. Distributions (location and variability) of h ref and of the bias of h c1 to h c6 were summarized with descriptive statistics and graphical analyses.
Results
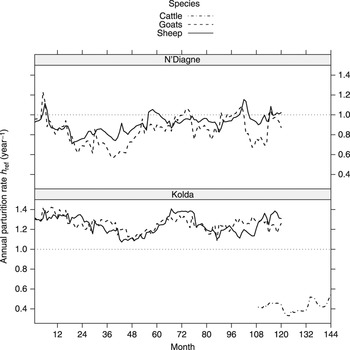
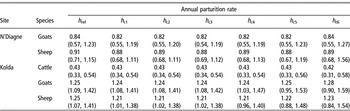
Time series of h ref for each site and species in the study periods are provided in Figure 1. Cattle h ref in Kolda ranged from 0.33 to 0.54/year with an average of 0.43/year (Table 2). For small ruminants, h ref was in average lower in N’Diagne than in Kolda (Table 2), but with higher dispersion (for instance, for goats, average h ref were 0.84 and 1.25/year in N’Diagne and Kolda, respectively, while corresponding ranges were 0.66 and 0.33/year).
Time series of the reference annual parturition rates h ref for goats, sheep and cattle in N’Diagne and Kolda sites. The x-axis represents the rank (in the monitoring period) of the first month of each 12-month period used for the calculation of the annual rates.

Average annual parturition rates (minimum and maximum in brackets) h ref and h c1 to h c6 (see text for detail) for each site and species over the study period 1994–97 for cattle and 1985–95 for small ruminants

Average bias of h c1 to h c6 was low for all sites and species (Table 2); depending on the site and the estimation method, average bias varied from −0.5% to 0.7% for cattle, from −2.7% to 1.8% for goats and from −3.0% to 0.5% for sheep.
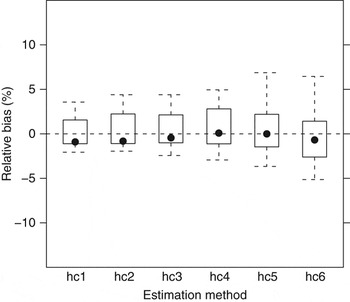
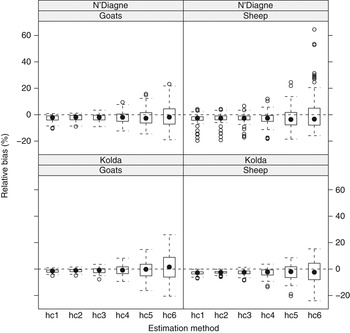
Bias dispersion was sensitive to the site, the species and the estimation method. This dispersion was lower for cattle than for small ruminants (Figures 2 and 3): in absolute value, minimum and maximum biases for cattle were 1.9% (h c2) and 6.9% (h c5), while biases higher than 10% were frequent for small ruminants, particularly with h c6. Highest bias dispersion has been observed in N’Diagne for sheep. In absolute values, maximum biases were 19.6%, 19.2%, 17.2%, 18.2%, 24.6% and 64.5% with h c1 to h c6, respectively.
Box-and-whisker plots of the relative bias (%) of the estimated annual parturition rates h c1 to h c6 compared to the reference value h ref for cattle in Kolda site. For a box, the closed point located in the box represents the median and the two ‘hinges’ are the first and third quartile. The ‘whiskers’ extend out from the box to the most extreme data, which is ⩽1.5 × IQR away from the box (IQR: inter-quartile range). Eventual outliers are represented by open circles.

Box-and-whisker plots of the relative bias (%) of the estimated annual parturition rates h c1 to h c6 compared to the reference value h ref for small ruminants in N’Diagne and Kolda sites (see Figure 2 for details on box-and-whisker plots).

For small ruminants, bias dispersion has increased from h c1 to h c6 (Figure 3). For instance, in N’Diagne, bias standard deviation (s.d.) increased from 2.3 (h c1) to 8.8 (h c6) for goats and from 3.5 to 13.8 for sheep. This pattern was less obvious for cattle: bias s.d. has increased from 1.6 (h c1) to 2.8 (h c5) (Figure 2).
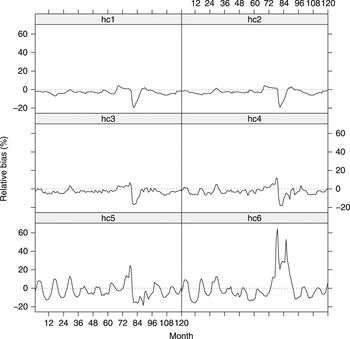
Time series of biases over the study periods has shown complex patterns depending on the estimation method and the period, mixing seasonal and irregular fluctuations. Series of sheep in N’Diagne are presented in Figure 4 as an example. Besides fluctuations, Figure 4 has confirmed the increasing amplitude of the bias dispersion from h c1 to h c6. It has also showed that even the less variable estimate h c1 can be affected by large drops.
Time series of the relative biases (%) of the annual crude parturition rates h c1 to h c6 compared to the reference rate h ref for sheep in N’Diagne site. The x-axis represents the rank (in the monitoring period) of the first month of each 12-month period used for the calculation of the annual rates.

Discussion
An important feature observed in the study was the high variability of the successive 12-month parturition rates h ref (the same result was noted by Marzin and Liénard (Reference Marzin and Liénard1984) in a French extensive farming system). For instance, for sheep in N’Diagne, h ref has dropped from 1.15 to 0.87/year only by shifting the 12-month period three months later. This variability was mostly due to the marked seasonality of parturitions in the observed systems (particularly in N’Diagne) and to the location of the parturition peaks which can shift of one or two months according to the year. For instance, in N’Diagne, highest observed values of h ref corresponded to 12-month periods including a parturition peak and, by chance, a part of the start of the following peak. Such phenomena make it difficult to get a representative estimate of the annual parturition rate when data are only recorded over one or two years. Longer data are needed to eliminate the effect of the successive 12-month rates variability.
In general, h ref has been correctly estimated by h c1. In absolute value, bias was lower than 11% in all sites and species, except for sheep in N’Diagne (19.6%, corresponding to the negative drop observed in Figure 4). Rate h c1 is simpler to calculate and to analyze with inferential statistical methods (h ref needs within-year decomposition and involves more parameters). Nevertheless, one drawback of h c1 is its potential sensitivity to competing risks, such as mortality and other exits from the herd (sales, slaughtering, gifts and loans) of reproductive females. For instance, in farming systems with marked seasonal parturitions, large withdrawals of females before parturition peak will artificially decrease the number m of parturitions observed in herds, and subsequently h c1. An example of this effect was the drop that has been observed for sheep in N’Diagne (Figure 4). It was due to massive exits of ewes within a short period of time (Lesnoff, Reference Lesnoff1999). In such situations, h c1 represents an apparent annual parturition rate, without biological meaning, rather than the average parturition rate of a reproductive female spending all the year in the herd. The same drawback applies to approximate crude rates (Figure 4). Therefore, when using crude rates h c, we recommend to also calculate h ref (if data have been collected in a herd follow-up survey), and to check that discrepancies between these estimates remain at an acceptable level, and that no events such as in Figure 4 has occurred.
In this study, reliability of the crude rate has progressively decreased from h c2 to h c6, corresponding to the degradation of information used for approximating T. This decrease was much lower for cattle (for which all methods had an acceptable reliability) than for small ruminants, in relation with a higher precocity of goats and sheep and a faster turnover of these animals in herds. Among compared estimates, the lower reliability has been observed for h c6: bias reached 26.0% for goats and 64.5% for sheep. Therefore, we do not recommend using this estimate, especially for small ruminants. Reliability of h c2 and h c3 was acceptable, with the same reservation as for h c1 regarding the sensitivity to competing risks.
Rates h c5 and h c6 can be used in rapid cross-sectional 1-year retrospective surveys based on interview of farmers and their recall of the demographic events that occurred in the herd over the last past 12 months (ILCA, 1990; Lesnoff et al., Reference Lesnoff, Saley, Adamou, N’Djafa Ouaga, Ayantunde and Gérard2008). These surveys are quicker and less expensive than herd follow-up – especially in large areas or in nomadic systems – and can be implemented after unpredictable crises (such as droughts or disease outbreaks) to estimate their impacts. Nevertheless, the study has shown that h c5 and h c6 only provide very approximate results. Calculation bias may also be worsened by farmers’ recall errors during retrospective interviews. Results of retrospective surveys and h c5 and h c6 estimates should be considered with caution. When possible, other surveys methods and estimates should be preferred.
Finally, the observed variability between the estimates and between the successive 12-month periods have shown that comparisons of parturition rates, for instance, during a literature review or when analyzing field data for testing impacts of innovations, should use estimates calculated with the same method and on the same 12-month periods. In the first case, however, the frequent lack of methodological details reported in the articles on small-holder tropical livestock farming systems remains a constraint.