

INTRODUCTION
In recent years, a growing body of research has been focusing on meaning of life, belief systems, life attitudes, and demoralization in the course of chronic or life threatening illness at the end of the life period (Baider et al., Reference Baider, Russak and Perry1999; Holland et al., Reference Holland, Passik and Kash1999; Kissane et al., Reference Kissane, Clarke and Street2001; Nelson et al., Reference Nelson, Rosenfeld and Breitbart2002; Thune-Boyle et al., Reference Thune-Boyle, Stygall and Keshtgar2006). A relatively large number of empirical studies have clearly demonstrated that meaning in life is an important variable in the maintenance and enhancement of physical, psychological, and mental health (Reker & Butler, Reference Reker and Butler1990; Zika & Chamberlain, Reference Zika and Chamberlain1992; Reker, Reference Reker1994; Reference Reker1997; Nicholson et al., Reference Nicholson, Higgins and Turner1994; Fry, Reference Fry2001). Many of these studies examined the correlates of meaning, described the moderating, and mediating role of meaning (Reker & Fry, Reference Reker and Fry2003). However, there was no adequate number of studies regarding meaning in life and its predictors in cancer patients. Issues of meaning in life are particular important for patients given the threat of a serious illness, treatment measures, and the potential confrontation with the finiteness of their own lives (Saleh & Brockopp, Reference Saleh and Brockopp2001; Xuereb & Dunlop, Reference Xuereb and Dunlop2003; Bower et al., Reference Bower, Meyerowitz and Desmond2005). Previous studies concluded that majority of cancer patients expressed their need for hope, sense, meaning and purpose in life, spirituality, and death and dying (Moadel et al., Reference Moadel, Morgan and Fatone1999; Jenkins et al., Reference Jenkins, Fallowfield and Saul2001). Cancer can challenge the experience of meaning in life and meaning of life. The diagnosis and consequences of a life-threatening illness such as cancer can demolish self-perceptions, life attitudes, individual assumptions, and value systems and can prevent the sense of meaning in life continuity and coherence (Habermas & Bluck, Reference Habermas and Bluck2000). Thus, cancer can block the maintenance of purpose and meaning in life (Kissane, Reference Kissane2000; Cohen & Block, Reference Cohen and Block2004).
It may be that some people confronted with the diagnosis and treatment of cancer may be forced to change their former outlook on life, as it no longer gives enough direction to life. The threat to life can challenge people's beliefs about their life and sense of well-being. Positive moods may predispose them to feel that life is meaningful and may increase their sensitivity to the meaning relevance to a situation. Issues of meaning in life and spirituality are essential components of the experience of people facing serious illnesses (Folkman & Moskowitz, Reference Folkman and Moskowitz2000; Breitbart et al., Reference Breitbart, Gibson and Poppito2004; Folkman, Reference Folkman2008).
Determining meaning in life and its predictors could assist nurses in understanding meaning in life of patient with cancer. Therefore, nurses need to know meaning in life of patients with cancer so that this knowledge could be used in planning of health care services. No studies have investigated evaluating the meaning in life among Turkish cancer patients although Turkey health care professionals are becoming increasingly aware of the need for spiritual and palliative care. Despite a vast amount of research that has examined meaning in life in cancer populations, the relationships among meaning in life, symptoms experienced and demographic and disease/treatment characteristics of the participants are still not well understood. A thorough understanding of these relationships is critical for health care professionals to provide appropriate care management to patients with cancer. Therefore, this study focuses on how patients with cancer evaluate meaning in life, its predictors.
AIM
The aim of the study was to determine the meaning in life and its predictors in Turkish patients with cancer.
METHODS
Design
The design of the study was cross-sectional.
Participants
The participants were 182 patients with cancer at a university hospital medical oncology department in Turkey. G-Power software program for windows was used to determine sample size of the study. A sample size of 214 patients was estimated using power analysis based on an alpha of 0.05, power of 0.95, assumed effect size was 0.50 for the sample size estimation. The response rate was 85.1%. Thirty-two patients did not participate because they were too busy or unwilling; their characteristics were similar to those included in the study. The patients were recruited through convenience sampling method. The inclusion criteria were: (1) being registered with a primary diagnosis of cancer in the oncology clinic; (2) aged 18 years or more, (3) able to read and understand the Turkish language, and (4) no history of psychiatric illness.
Data Collection
The data were collected in 2007. The researcher visited the oncology clinic on five working days in every week and conducted interviews with the patients. The researcher explained the questionnaire to the patients and invited them to participant in the study. Then, the researcher assisted the participants with the self-completion questionnaire. The questionnaire took approximately 25 minutes to complete and could be understood by people with minimal reading ability. The questionnaire was given to patients in a separate quiet room in the oncology clinic.
Validity and Reliability of The instruments and Measurement
The Life Attitude Profile Scale
The life attitude profile scale was used for the measurement of meaning in life. The scale developed by Reker (Reference Reker1992) and was adapted to Turkish patients with cancer by Erci (Reference Erci2008). First, the scale was translated into Turkish and was reviewed by two experts for clarity and cultural sensitivity. Then, three experts in both languages translated the Turkish instrument into English. The translation phase had the purpose of checking for discrepancies between the content and meaning of the original version and the translated instrument. Finally, the instrument was tested for comprehension. Internal reliability coefficients (Cronbach's alpha) for the four factors ranged from 0.73 to 0.82, and total alpha of the scale was 0.71. The test retest reliability of the scale was 0.76. Factor loadings of scale's items ranged 0.32 to 0.65. The corrected item-total correlations ranged from 0.29 to 0.72. The scale is a 30-item self-report multi-dimensional measure of discovered meaning and purpose in life and the motivation to find meaning and purpose in life. The scale is scored and profiled in terms of four (purpose: 8 items, coherence: 7 items, Choice/ Responsibleness: 8 items, Goal Seeking: 7 items) dimensions scales. Each statement of meaning in life was measured on a seven-point Likert scale, ranging from strongly agree (scored 7) to agree (6), moderately agree (5), undecided (4), moderately disagree (3), disagree (2) and strongly disagree (1) (Reker, Reference Reker1992; Erci, Reference Erci2008). In the current study, the alpha of the scale was 0.85.
The M. D. Anderson Symptom Inventory (MDASI)
The MDASI is a brief measure of the severity and impact of cancer related to symptoms. Each symptom is rated on an 11-point scale (0–10) to indicate the presence and severity of the symptom, with 0 meaning “not present” and 10 meaning “as bad as you can imagine.” 11-point rating scales maximize the trade-off between a patient's ease of responding and the marginal increase in reliability associated with a greater number of response choices. Each symptom is rated at its worst in the last 24 hours. The MDASI also includes ratings of how much symptoms interfered with different aspects of a patient's life in the last 24 hours. These interference items include general activity, mood, work (includes both work outside the home and housework), relations with other people, walking, and enjoyment of life. The interference items also are measured on 0–10 scales, with 0 meaning “did not interfere,” and 10 meaning “interfered completely.” The mean of all of these symptom interference items was used as a measure of overall symptom distress. The inventory's alpha was 0.87 (Mendoza et al., Reference Mendoza, Wang and Cleeland1999; Cleeland et al., Reference Cleeland, Mendoza and Wang2000).
Initially, the inventory was translated into Turkish and reviewed by two experts for clarity and cultural sensitivity; recommended changes related to wording were implemented in the inventory. Three individuals, expert in both languages, back-translated the Turkish instrument into English, between them achieving agreement. No item was extracted from the questionnaire because factor loading was adequate. Internal reliability coefficients (Cronbach's alpha) for the two factors ranged from 0.84 to 0.77, and total alpha of the inventory was 0.85. The corrected item total correlations ranged from 0.36 to 0.79, and test retest reliability of the inventory was 0.76. Statistical analyses have shown that a standardized inventory of symptoms has statistically acceptable levels of reliability and validity. In the current study, the alpha of the inventory was 0.85.
Ethical Considerations
The study was approved by the ethics committee at the Atatürk University and informed consent was obtained from each participant. The patients were informed about the purpose of the research, and assured of their right to refuse to participate or to withdraw from the study at any stage. Anonymity and confidentiality were guaranteed.
Data Analysis
Independent sample t-tests (confidence interval 95%) were used to examine differences in scores of the four categories of the meaning in life scale by occupation situation, marital status, and gender. Kruskal-Wallis variance was utilized to investigate the differences among scores of the four categories of the meaning in life scale by education level and treatment characteristics and stage of cancer with confidence interval 0.95 (P < 0.05). Bivariate correlation was used to determine whether relationship exists between scores of the four categories of the meaning in life scale and age, monthly income, duration of diagnosis, and the MDASI with criterion 0.95 (P < 0.05).
RESULTS
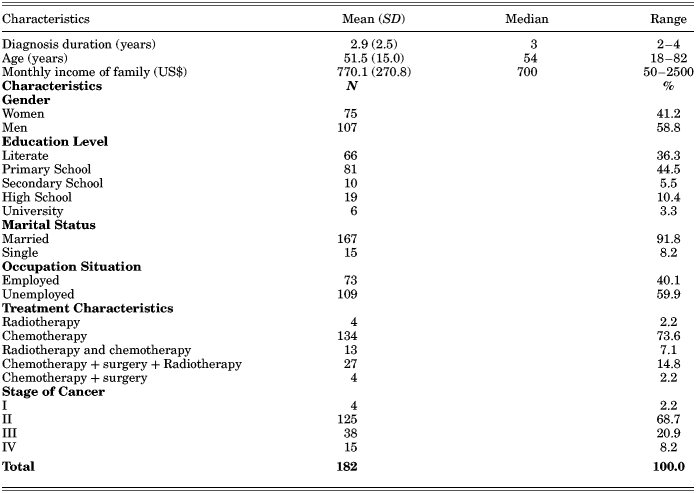
The characteristics of the sample were summarized in Table 1. The mean age of the participants was 51.5 (SD = 15.0) years and 58.8% of the sample consisted of men and 41.2% women. Most of the patients had graduated from primary school (44.5%), the mean monthly income of the participants' families was 770.1 (SD = US$ 270.8). Mean monthly income of family in Turkey is US$ 952 as a whole. According to mean monthly income of family in Turkey, the mean monthly income of participants' families was lower in this study (ATO 2008). The rate of unemployed among the patients was 59.9%, and 45.7% of the unemployed consisted of housewife. About 91.8% of the joints were married. The mean duration of cancer since diagnosis was 2.9 (SD = 2.5) years. The majority of them had received chemotherapy, 68.7% of the patients in Stage II of cancer (Table 1).
The demographic and disease/treatment characteristics of the participants (n = 182)

The mean scores of the two categories and total of the symptom inventory ranged from 64.9 (SD = 25.1) (severity) to 27.0 (SD = 13.3) (interfere category) and 91.9 (SD = 32.6) points. The mean score of the inventory suggested that the patients had moderate severity symptoms.
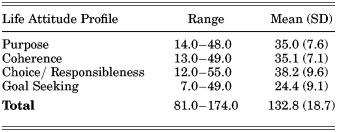
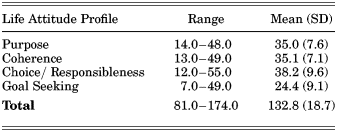
The mean scores of the four categories of the meaning in life ranged from the lowest [Goal seeking: 24.4 (SD = 9.1)] to the highest [Coherence: 35.1 (SD = 7.1)]. The mean score of the total meaning in life was 132.8 (SD = 18.7) points. The mean score of the total meaning in life stated that the patients had low motivation to find meaning and purpose in life. The mean score of the coherence subscale showed that the patients had an integrated and consistent understanding of self, others, and life (Table 2).
Descriptive statistics for the life attitude profile scale and its subscales
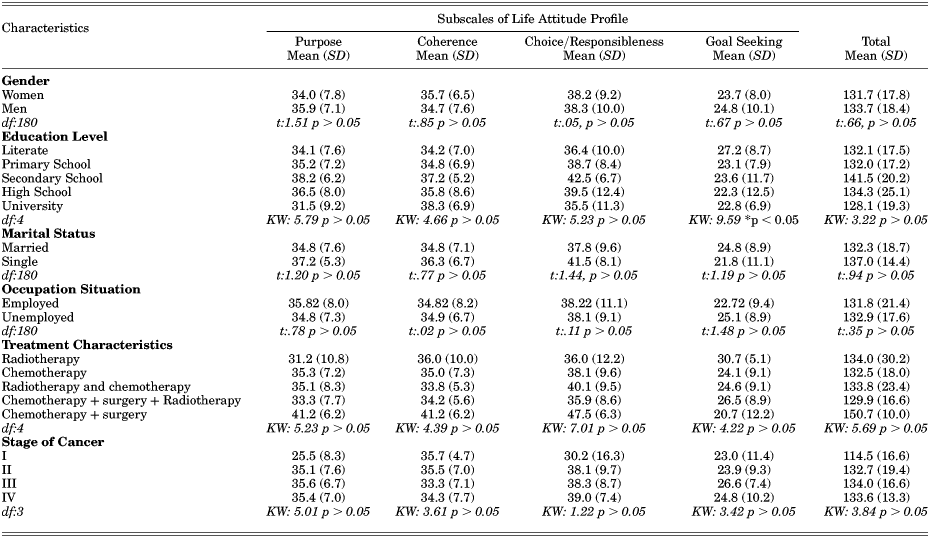
Statistical evaluation of demographic features with the meaning in life and its dimensions demonstrated that the patients' gender, marital status, occupation situation, treatment characteristics, stage of cancer, level severity of symptom were no influence on the meaning in life and its dimensions. Education level of the patients was statistically effect on goal seeking dimension of the meaning in life and literate patients with cancer had higher goal seeking score (Table 3).
The difference between the life attitude profile or its subscales and demographic and disease/treatment characteristics of the participants
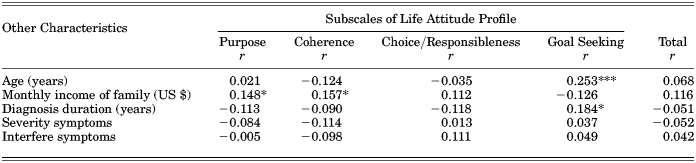
Age of the patients was positive correlated with the goal seeking dimension (r = 0.253***). Also, there was a significant positive correlation between monthly income of the patient's family (US$) and the purpose (r = 0.148*) or coherence dimensions (r = 0.157*). Similarly, diagnosis duration (years) was a positive associated with the goal seeking dimension (r = 0.184*) (Table 4).
The relationship between the life attitude profile or its subscales and demographic and disease characteristics of the participants
***Correlation is significant at the 0.001 level (2-tailed).
*Correlation is significant at the 0.05 level (2-tailed).
DISCUSSION
The findings must be interpreted cautiously because of the study limitations. This non-probability sample from a single geographic area consisted of lower socio-economic status. Therefore, it is not reasonable to generalize these findings to other populations. Although relationships between these variables have been identified, the actual path and interaction among them remains unclear. The results of this study may be generalized to the sample group in this study. The sample in this study reflects only one area of Turkey. The findings therefore cannot be generalized to all patients with cancer in Turkey.
Meaning in life is a broad phrase that also is referred to as existential meaning, whereas meaning of the cancer experience, or situational meaning, focuses on the meaning a person discovers from that particular event (Thompson, Reference Thompson2007). Meaning in life is determined by the life attitude profile scale in general.
In this study, the mean score of the total meaning in life stated that the patients had low motivation to find meaning and purpose in life. The scores of the meaning in life showed that there was loss of meaning in life in Turkish patients with cancer. The mean score of the coherence indicated that the patients had an integrated and consistent understanding of self, others, and life. The goal seeking subscale score showed that the patients desired to search for new and different experiences (Table 2). Bauer-Wu and Farran (Reference Bauer-Wu and Farran2005) found mean score of total meaning in life was 81.4 points in women with breast cancer. Differently, a previous study established that the meaning in life of patients with cancer's scores were higher (Thompson, Reference Thompson2007). It may be thought that scores of the meaning in life of the patients vary as depend on country and culture. Breitbart and Heller (Reference Breitbart and Heller2003) stated that those were the patients who knew they were going to die and the cancer had robbed them of many of the usual sources of meaning in their lives. Also, culture supplies people with the provisions to derive meaning from life. Thus, the search for meaning appears to be influenced by culture, and search for meaning appears to moderate cultural influences on presence of meaning (Steger & Kashdan, Reference Steger and Kashdan2007). Patients who are confronted with cancer tend to search for a meaning in that experience (Moore, Reference Moore1997; Richer & Ezer, Reference Richer and Ezer2002; Coward & Kahn, Reference Coward and Kahn2005).
It was found that gender, marital status, occupation situation, treatment characteristics, stage of cancer of the patients were no influence on the meaning in life and its dimensions in this study. Skrabski et al. (Reference Skrabski, Kopp and Rózsa2005) determined that meaning in life relatively unrelated to gender. Also, one previous study found that meaning in life was uncorrelated with socio-demographic variables (employment, spousal status, disease characteristics) (Jim et al., Reference Jim, Purnell and Richardson2006). These findings of this study are similar to those of other studies.
In the study, education level of the patients was effective on goal seeking dimension of the meaning in life and literate patients with cancer had higher score of goal seeking (Table 3). Jim et al. (Reference Jim, Purnell and Richardson2006) indicated that education level affected life attitude profile. Skrabski et al. (Reference Skrabski, Kopp and Rózsa2005) clarified that education level was less closely related to life attitude profile. These results of the current study are compatible with those of other studies.
In the present study, age was positive correlated with the goal seeking dimension (r = 0.253***). Steger and Kashdan (Reference Steger and Kashdan2007) found that age was important predictor for life attitude profile. Thompson (Reference Thompson2007) found that breast cancer survivors aged 50–59 years scored significantly higher on meaning of life than survivors aged 36–49 years. Additionally, Skrabski et al. (Reference Skrabski, Kopp and Rózsa2005) declared that age was effectual on meaning of life. Younger cancer patients have been found to experience more meaning in life (Schroevers et al., Reference Schroevers, Ranchor and Sanderman2004). It may be that younger patients with cancer poses a greater sense of threat, because it is more interfering with their developmental stage, while older patients may already have learned most of their lessons of life (Jaarsma et al., Reference Jaarsma, Pool and Ranchor2007). These findings in this study are compatible with those of other studies.
There was a significant positive correlation between monthly income of the patients' families (US$) and the purpose or coherence dimensions in this study. Jaarsma et al. (Reference Jaarsma, Pool and Ranchor2007) found that the experience of meaning in life was also related to trait-like characteristics as personality. Diagnosis duration (years) was positive connected with the goal seeking dimension (Table 4). Park et al. (Reference Park, Malone and Suresh2008) established that there was a positive relationship between increased life meaning and over time.
The results of this study point that education level, age, monthly income of family, and diagnosis duration of the independent variables were effective predictors for meaning in life.
CONCLUSION
The findings of this study provide support for potential clinical application and future research related to meaning in life and predictor factors in patients with cancer. Nurses and other health care providers can assist the patients in expressing and processing their psychological or provide referrals to counselors, chaplains, which might help to alleviate physical, mind, and emotions health consequences. This information may be used in nursing education to develop continuing education programs for nurses and other health care providers.
The results of the study have implications for nursing practice. First, nurses should be aware that meaning in life may be related to demographic and disease/treatment characteristics. That awareness should lead to assessment of a sense of life meaning or purpose in patients and survivors. Assessment may lead to determination of a potential source of meaning for individuals and guide nurses in possible interventions or referrals.
The present study can be only a beginning to understanding the meaning in life and its relation to demographic and disease/treatment characteristics of patients with cancer. The study findings add to the growing body of nursing literature. The literature review revealed need for more studies relating evaluate meaning in life and its predictors. Further studies would be useful regarding how evaluate meaning in life and its predictors can aid health professionals to better identify the patients' evaluate meaning in life and its predictors. The meaning in life should be studied in various forms of cancer to determine whether meaning in life changes throughout the process of diagnosis, during treatment, following treatment, and during advanced stages of cancer. In Turkey, the results of this study have to be taken into consideration in the related areas of this issue. The meaning in life and its predictors should be further evaluated with a large and enough sample size at different regions of Turkey and diverse populations in different cultures of world.