I. INTRODUCTION
The power amplifier is often the largest power consumer of the transmit chain in base-station applications, and thus its efficiency greatly impacts the overall system performance. With the increasingly crowded wireless spectrum, the use of signals with high peak-to-average ratio (PAPR) such as HSDPA and 3 GGP LTE has become more prevalent, degrading the efficiency of the power amplifier. In the past, a number of efficiency enhancement techniques have been developed [Reference Cripps1, Reference Raab2] for these signals such as the Doherty amplifier [Reference Steinbeiser3, Reference Kim4], and the envelope-tracking (ET) amplifier [Reference Jeong5]. In many wireless applications, the output power averaged over modulation time scales further varies with time by as much as 10 dB, as a function of the number of users and data transmission demands occurring during different times of day or seasonally. As a result, the power amplifier may not always be operating at its maximum “average” output power, where the efficiency is generally specified. It is highly desirable to maintain high efficiency under the long-term varying operating conditions to reduce the overall energy consumption. Little has been reported in the literature for performance of high power amplifiers under these conditions. In this paper, we discuss the performance of ET power amplifiers (PAs) under average power back-off operation, demonstrating that high long-term average efficiencies can be achieved. Digital predistortion (DPD) linearization requirements for ET in general change as the average power is backed off. Here we introduce a DPD model that accommodates power scaling over an average power range of more than 10 dB. Our measurements show that the ET-HPA (high-power amplifier) efficiency is reduced by less than a factor of 2 at 10 dB average power back-off. Monte Carlo simulations based on a projected time-varying power profile were performed to compare the long-term efficiency of Class B, Doherty, and ET amplifiers. For the specific power profile investigated, ET PAs demonstrated more than 40% improvement in long-term efficiency (averaged over a period of more than 24 h) relative to Doherty amplifiers with the same peak efficiency.
II. ET-HPA
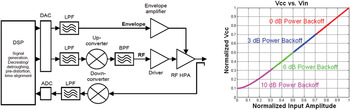
The ET-HPA architecture, shown in Fig. 1(left), can be used to maintain high efficiency for high PAPR signals [Reference Wang6]. ET employs a dynamic supply voltage defined by the envelope of the RF signal, provided by a high-efficiency wideband envelope amplifier, keeping the power amplifier in saturation at most times where the efficiency is highest. The envelope amplifier consists of a switching DC–DC buck converter and a linear amplifier. The drain (or collector) supply voltage was shaped to linearly track the envelope of the RF signal, except at low-input voltages, for which the drain supply was “de-troughed” in order to reduce sensitivity to time misalignment and avoid gain collapse [Reference Wang6], according to:
 $$V_{DD} \approx V_{DD\comma max} \lpar \left\vert {x_{RF} } \right\vert +b \times e^{ - \left\vert {x_{RF} } \right\vert /b} \rpar \comma \;$$
where |x RF| is the normalized amplitude of the RF input signal and b is the approximately equal to the ratio of the RFPA knee voltage and the peak voltage of the envelope signal. By setting a low b, high average efficiencies were obtained by keeping the RFPA close to saturation even in back-off, as shown in the sections to follow. In this work, b was set to 0.1.
LEFT: ET high-power amplifier system block diagram. RIGHT: Normalized Vdd versus normalized input voltage at the different back-off levels.

Signal generation, decresting/detroughing, time alignment, and pre-distortion algorithms are performed with digital signal processing (DSP) at baseband, with a sampling rate of 107.52 MHz. The RF signal is generated with a digital intermediate frequency (IF) at 26.88 MHz. The ET system was implemented using a GaAs high-voltage hetero-junction bipolar transistor (HBT) as the RF final stage. Measurements were done with a 7.54 dB PAPR WCDMA signal centered at 2.14 GHz. The GaAs HVHBT was operated at a peak envelope voltage of 29.5 V and a minimum supply voltage of 2.95 V. Proper time alignment is critical between the supply voltage and the RF signal at the RFPA. In this work, sub-sample time alignment was performed digitally.
A) Operation in back-off
To operate the ET amplifier in average power back-off, the signal power levels were adjusted in DSP. The values of the RF input and envelope voltages were simultaneously scaled to maintain ET operation. The detroughing relation in (1), normalized to the peak drain voltage of the input signal at full power, was maintained, keeping the RFPA in saturation for ET operation as the power is backed off, depicted in Fig. 1(left). Thus, the ETPA operated with a single trajectory of supply voltage versus output power both at full power and in back-off.
III. SCALABLE DPD FOR AVERAGE POWER BACK-OFF
Memoryless DPD was carried out by collecting the output data via the down-converter chain, synchronizing the output data with the corresponding input, and fitting the data with an appropriate polynomial. The pre-distorted signal was generated from the fitted polynomial to provide a linear input–output relationship. In this work, we studied how the linearity requirements change under power back-off operation, and we developed a simple DPD model capable of being used at the different back-offs.
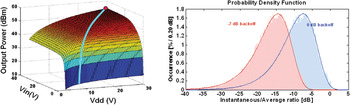
Figure 2 (left) illustrates the relationship between the output power, input voltage, and drain supply voltage for the RFPA. The output power of an RFPA is a function of the input power and the drain supply voltage. In the case of the ET-HPA, where the drain supply voltage and the input voltage are strongly coupled by the expression given in (1), for a particular drain supply relationship, the ET-HPA follows a single trajectory such that
 $$P_{out}=f\lpar x_{RF}\comma \; V_{DD} \rpar =f\left[{x_{RF}\comma \; g\left({\left\vert {x_{RF} } \right\vert } \right)} \right]\comma \;$$
where x RF is the RF input signal and V DD is the drain supply voltage, as depicted by the solid blue line in Fig. 2(left). This suggests that a single behavioral model can be extracted and scaled to generate the predistorted inputs for the other average power back-offs.
LEFT: Relationship surface between output power, input voltage, and drain supply voltage of an RFPA. The ET-HPA follows a single trajectory as depicted by the blue line; RIGHT: PDF of the modulated 7.54 dB PAPR WCDMA signal at 0 dB and at −7 dB back-off.

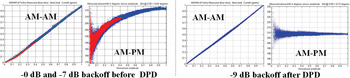
In order to perform DPD with up to 10 dB average power back-off, measurements at full power and 7 dB back-off, as depicted in Fig. 2(right) were combined to develop the scalable LUT. By combining these datasets, there is sufficient overlap to validate consistency while providing higher confidence in the look-up table (LUT) model in the low power regime, where relatively very few points exist in the full power measurement. The AM–AM distortion was determined using a 16th order polynomial fit based on evenly spaced amplitudes of 2000 points to model the gain expansion occurring at low-input voltages that is characteristic of ET PAs. The AM–PM distortion was determined in a similar manner with a fourth-order polynomial fit. Using this behavioral model, a signal with memory-less pre-distortion can be generated for various back-off levels without the need to regenerate a DPD model at each back-off level. Figure 3(left) illustrates the measured results at 0 and 7 dB back-off from which the behavioral model was extracted. A small amount of gain expansion and about 25° of phase lead were observed before DPD. The overlap of the two sets of measurements demonstrates that the ET-HPA follows a single gain trajectory for which a scalable DPD model can be used.
AM–AM and AM–PM plots – LEFT: before DPD at 0 dB (blue) and 7 dB (red) average power back-off and the corresponding extracted behavioral model, using a polynomial fit; – RIGHT: after DPD at 9 dB average power back-off with derived LUT.

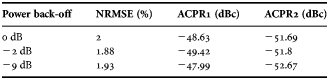
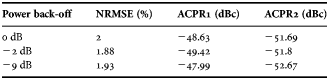
To demonstrate linearization at back-off, two different power levels (2 and 9 dB back-off) were selected and the corresponding predistorted inputs were generated from the derived LUT. Figure 3(right) shows the resulting amplitude–amplitude (AM–AM) and amplitude–phase (AM–PM) after DPD using the single scalable DPD model at 9 dB back-off. The linear behavior of the AM–AM and the flat response of the AM–PM at these various average power levels demonstrate that the GaAs HVHBT was successfully linearized using the single DPD model. In contrast, with a DPD model generated from only full average power data, successful linearization was achieved for only up to 3–4 dB average back-off, due to the lower accuracy in the DPD model at the lower powers. Table 1 summarizes the measured linearity at the different backed-off powers. The measured NRMSE was less than 2% over a 10 dB average power range and the adjacent channel power ratio (ACPR) linearity specification of the WCDMA standard was satisfied. A small amount of history dependent memory effects were present in the ETPA, adding slightly to the spectral content; these can be observed by the spread in the AM–AM and AM–PM after memory-less DPD. Further reductions in ACPR could be done (if needed to provide greater margin relative to specifications) by including memory-related corrections.
Summary of measured linearity results at various back-offs.
IV. AVERAGE POWER EFFICIENCY IN BACK-OFF
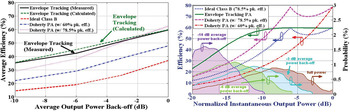
Efficiency measurements were made of the ET amplifier in back-off conditions. At full power (35 W), the measured ET-HPA efficiency was 59.7%. Backing off the average output power by −3, −6, and −10 dB, the ET-HPA efficiency was measured to be 52.6, 45, and 35.4%, respectively. In the following, we consider the factors influencing this efficiency, and we compare the results with the performance expected from other amplifier configurations. The measured results along with the comparisons discussed below are shown in Fig. 4(left).
LEFT: Average efficiency of various PAs using a 7.54 dB PAPR WCDMA signal versus average output power; RIGHT: Left axis: “Instantaneous” efficiency versus normalized P out of the measured ET-HPA and comparison PAs. Right axis: PDFs of a 7.54 dB WCDMA signal.

A) Amplifier efficiency at various output powers
Under ET operation, the overall system efficiency can be defined as the product of the RFPA efficiency (η RF) and the drain modulator efficiency (η Env), expressed as:
 $$\eta _{ET}=\displaystyle{{P_{out} } \over {P_{DC} }}=\displaystyle{{P_{out} } \over {P_{env} }} \times \displaystyle{{P_{env} } \over {P_{DC} }}=\eta _{RF} \times \eta _{Env}\comma \;$$
where P out is the RF output power, P env is the modulated envelope supply power, and P DC is the DC power into the drain modulator. The “instantaneous collector efficiency” of the GaAs HVHBT was measured to be 85% over a 12.5 dB output power range before the efficiency begins to roll off. Here, the “instantaneous efficiency” corresponds to the expected result for single tone signals as the output varies at the modulation rate between the different power levels. The drain modulator efficiency was ~70% in our experiments. The instantaneous output power and instantaneous efficiency of the ET-HPA can be approximately analyzed by the quasi-static relationship between the instantaneous input power and instantaneous drain supply voltage, using the simplifying assumption that η Env is constant. Figure 4 (right) illustrates the instantaneous efficiency of the ET-HPA as a function of the instantaneous output power. For comparison, the results expected for an ideal Class B, ideal Doherty amplifier with a peak efficiency of 78.5%, and a Doherty amplifier with a peak efficiency of 60% are shown. Additional architectures (such as Doherty amplifiers or ET amplifiers with adjustable power supply voltages) are possible, but are not considered here, for simplicity.
B) Average efficiency with modulated signals
The “average” output power using a modulated signal can be determined by averaging the instantaneous output power (P out) weighted by the probability density function (PDF) of the signal p(P out) as a result of the modulation. The average efficiency of the RF amplifier under the excitation of a modulated signal at a particular average output power can be calculated as:
 $$\left\langle \eta _{ET} \right\rangle=\displaystyle{\left\langle P_{out} \right\rangle \over \left\langle P_{DC} \right\rangle }=\displaystyle{\int P_{{\rm out}} \times p\lpar P_{out} \rpar dP_{out} \over \int P_{out} /\eta _D \lpar P_{out} \rpar \times p\lpar P_{out} \rpar \times dP_{out} }\comma \;$$
where η D(P out) is the “instantaneous” drain efficiency. In the calculations that follow, the PDFs of a 7.54 dB PAPR WCDMA signal under various back-off conditions were used. Figure 4(right) shows the signal PDFs for full power, 3, 6 and 10 dB back-off as determined in MATLAB. Integrations of the instantaneous efficiencies of the power amplifiers shown in Fig. 4(right), was carried out with the PDF of the modulated signal at various power back-offs to determine a corresponding average efficiency curve as a function of average output power for the different power amplifiers. Calculated average efficiencies for the ET-HPA efficiency were in very good agreement with the measurements, as shown in Fig. 4(left).
V. MODELING OF LONG-TERM AVERAGE AMPLIFIER PERFORMANCE
The transmitted power from a base-station varies with time of day and seasonally, according to user requirements. The good performance of the ET amplifier in back-off can increase the long-term efficiency of a base-station, to an extent dependent on its usage profile. Such usage profiles are not available in the open literature. Here we develop an approximate model for the profile. The long-term probability distribution for the base-station output power is estimated based on a known traffic profile.
A) Base-station average output power
The total transmitted power of a base-station (P BS) can be calculated as the sum of the overhead power for pilot, paging, and synchronization ( $P_{overhead} $) and the power transmitted to each user (
 $P_{TX\comma n} $) in the cell. For n users, this leads to:
 $$P_{BS}=P_{overhead}+\sum\limits_n {P_{TX\comma n} }\comma \;$$
In the calculations that follow, it is assumed that the power transmitted to each user is proportional (by a factor K) to the power transmitted by each user back to the base-station. The user power typically fluctuates because of changing fading, path loss, shadowing, etc. In our simplified system model, the power transmitted to all the users in the cell is expressed as:
 $$\eqalign{\sum\limits_n {P_{TX\comma n} } &= K \times \sum\limits_n {P_{user\comma n} } \comma \; \,\cr &{\rm where}\, K = {{\lpar P_{BS\comma max} - P_{overhead} \rpar } / {\lpar N_{user\comma max} \times P_{user\comma max} \rpar \comma \; }}}$$
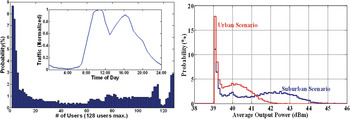
K can be found in the limiting case where the transmit power is the greatest (the maximum number of users are present at the cell edge). The power transmitted by each mobile terminal can be estimated based on the long-term PDFs for the urban and suburban environments obtained from the CDG4 operational system performance test [Reference Asbeck7]. Further, a traffic profile can be used to estimate the number of users in a cell site at any given time. Figure 5(left) shows the representative traffic profile assumed in this work (adapted from [Reference Yang8]). In general, this distribution may change as the usage mix changes from primarily voice to primarily data. The largest usage occurs during the day-time, with peak usage around 11 am and a second peak around 4 pm. However, between 11 pm and 7 am, the usage is significantly reduced with a minimum around 4 am. Within a cell in which the maximum number of users is 128, the PDF of the number of users at any given time, in 15 min intervals is illustrated in Fig. 5(left).
LEFT: PDF of the number of users over a 24-h period in a given cell with 128 maximum number of users. (INSERT: Normalized traffic versus time over 24-h period); RIGHT: PDF of average output power in a 40 W base-station based on the traffic profile.

To determine the probability density function of a base-station average output power P BS, Monte Carlo simulations were performed based on the PDFs of the traffic profile and the CDG4 profiles. To provide suitable randomness, 100 000 trials were performed. The number of users present in the cell at any given time was generated using the acceptance-rejection method such that the random number of users generated X is bounded between
 $$0\lt {{f\lpar X\rpar } / {\left[{c \times g\lpar X\rpar } \right]}} \leq 1\comma \;$$
where f(x) is the known PDF of the traffic profile, g(x) is PDF of random variables X, and c is chosen to be 1.1. Thus, we obtained a set of the number of users whose PDF is within 10% of the PDF of the traffic profile. For each trial, n number of users exists at a given 15 min interval. For each user within the given 15 min interval, a random output power P user,n, scaled by a factor K, as expressed in (6), was generated based on the CDG4 profile using the acceptance-rejection method, similar to the procedure described earlier, for both the urban and suburban environment. The summation of the output power P user,n contributed due to each user n and the overhead power P overhead given the average output power P BS of the base station during the specific 15 min intervals, as expressed in (5). Figure 5(right) shows the PDF of the average base-station power P BS, as a result of 100 000 Monte Carlo trials, for the specified traffic profile for the suburban and urban environment.
B) Long-term energy usage calculation
The average efficiency over a 24 h time-scale, as defined by the traffic profile, can be calculated by dividing the average base-station output power over the 24 h time-scale 〈P BS,out〉 by the average power consumption over the same time-scale 〈P BS,DC〉, similar to (4). Table 2 tabulates the average efficiency, energy consumption, and energy dissipation calculated for the specified traffic profile. The average RF energy output for this base-station is calculated to be 9.9 W × h for the urban case and 13.7 W × h for the suburban case. For the specified traffic profile, the base-station overall output power was calculated to be 4.65 and 6.05 dB backed-off from the maximum average power, for the suburban and urban scenarios, respectively, or approximately 13.5 dB backed-off from maximum peak efficiency. For the specific traffic profile, ET offers >45% efficiency. Its associated energy consumption is >1.4x lower than that of an ideal Doherty with 60% peak efficiency.
Energy usage of a base-station over 24 h period.

VI. CONCLUSION
In this work, operation of an ET amplifier was considered for a base-station in which the usage profile varies over a period of hours to days. A simple scalable memoryless DPD model was demonstrated to successfully linearize the ET-HPA in representative back-off conditions. Estimates were also made of the long-term power efficiency of base-station amplifiers, taking into account fluctuating number of users. It is shown that long-term efficiency is lower than the commonly quoted value of efficiency at peak output power. For ET amplifiers, less than 2x reduction in efficiency was measured as average power was decreased over a 10 dB range. Calculations of long-term efficiency indicate that, compared with an ideal Doherty amplifier with the same peak efficiency, ET amplifiers can provide more than 1.4x reduction in overall energy consumed. Thus, ET provides significant opportunities for system energy savings under realistic operation conditions. Further long-term efficiency improvement can potentially be obtained by using Doherty amplifiers in conjunction with ET [Reference Bumman9].
 Jonmei J. Yan received her Bachelor's and Master's degrees in Electrical Engineering at the University of California, San Diego. She is currently pursuing her Ph.D. at the same institution. Previously, she was at ARM Inc. as an analog designer, where she was involved in the design and layout of the custom high-speed I/O's. She also guided the automation of the quality control process. Since 2006, she has been a design engineer at MaXentric Technologies, leading multiple power amplifier projects ranging from UHF to Ku-band as the principle investigator. Her research interests include high-efficiency/high-power RF amplifiers for wireless communications and adaptive digital predistortion. She is currently engaged in research on broadband power amplifiers, envelope-tracking power amplifiers, and advanced digital predistortion techniques.
 Paul Draxler received the BSEE and MSEE degrees from the University of Wisconsin, Madison, in 1984 and 1986, respectively. Upon graduation, he designed hybrid and GaAs monolithic microwave integrated circuit PA circuits at Hughes Aircraft Corporation and Avantek. From 1988 to 1995, he held various positions with EEsof and HP-EEsof, where he focused on RF and microwave computer-aided engineering: custom design environments, nonlinear modeling, and electromagnetic simulation. In 1995, he joined Qualcomm Inc. to lead a team focused on RF computer-aided engineering. In this role, he has provided consulting to many design teams on system and circuit simulation, electromagnetic modeling, and design methodologies. He is currently a principal engineer with corporate R&D with Qualcomm Inc. and is currently a Ph.D. candidate at UCSD. He has authored papers on electromagnetics, circuit and system simulation, PA modeling, and linearization. He is co-inventor on three pending patents with other patents pending.
 Calogero D. Presti received the Laurea degree in electronics engineering (cum laude) and the Ph.D. degree in electronics and automation engineering from the University of Catania, Italy, in 2005 and 2008, respectively. He also received the diploma (cum laude) from the Scuola Superiore di Catania, Catania, Italy, in 2005. In 2005, he joined the Radio Frequency Advanced Design Center (RF-ADC), Catania, Italy, a joint research group supported by the University of Catania and STMicroelectronics, where his Ph.D. research focused on CMOS PAs, RF switches, device reliability, and digital predistortion. During 2009, he was a Postdoctoral Researcher at the University of California, San Diego, where he mainly worked on PA digital predistortion, and co-designed RF PAs and analog circuits for PA envelope tracking. In 2010, he joined Qualcomm, Inc., San Diego, CA, where he is currently part of the RF/Analog IC design team.
 Donald F. Kimball received the B.S.E.E. (Suma Cum Laude) with distinction and the M.S.E.E. at The Ohio State University, Columbus, Ohio, in 1982 and 1983, respectively. From 1983 to 1986 he worked for Data General Corp. as a TEMPEST engineer. From 1986 to 1994 he worked at Data Products New England as an electromagnetic compatibility engineer/manager. From 1994 to 1999 he worked at Qualcomm, Inc. as a regulatory product approval engineer/manager. From 1999 to 2002 he worked at Ericsson, Inc. as a research and technology engineer/manager. Since 2003 he is working at Calit2 at the UCSD as a principal development engineer. He is currently the CTO of MaXentric Technologies. He holds seven U.S. patents associated with high power RF amplifiers (HPA). His interests include HPA envelope elimination and restoration techniques, switching HPAs, adaptive digital predistortion, and memory effect inversion.
 Peter M. Asbeck attended MIT, where he received the B.S. and Ph.D. degrees in 1969 and in 1975, respectively. He worked at the Sarnoff Research Center, and at Philips Laboratory, in the areas of quantum electronics and GaAlAs/GaAs laser physics. In 1978, he joined Rockwell International Science Center, where he was involved in the development of high-speed devices and circuits using III–V compounds and heterojunctions. He pioneered efforts to develop HBTs based on GaAlAs/GaAs and InAlAs/InGaAs materials. In 1991, he joined the UCSD, where he is the Skyworks Chair Professor. His research has led to more than 350 publications. He is a member of the National Academy of Engineering, and has been a Distinguished Lecturer of the IEEE. He received the 2003 IEEE David Sarnoff Award for his work on HBTs. His research interests are in development of high performance transistor technologies and their circuit applications.