






1. Introduction
The Magellanic Clouds are a system of two satellite galaxies of the Milky Way (MW) that subtend a large fraction of the sky in the Galactic off-plane region, at distances of 49.6 kpc (Pietrzyński et al. Reference Pietrzyński2019) and 62.4 kpc (Graczyk et al. Reference Graczyk2020) from the MW. Their dynamical histories are still subject to investigation despite this accessibility, and the current leading theories suggest that the Clouds are on their first (Besla et al. Reference Besla, Kallivayalil, Hernquist, Robertson, Cox, van der Marel and Alcock2007) or second (Vasiliev Reference Vasiliev2024) orbit of the Milky Way (MW).
The Large Magellanic Cloud (LMC) has a mean metallicity of
 $-0.38 \pm 0.03$
dex (Choudhury et al. Reference Choudhury, Subramaniam and Cole2016) and is morphologically classified as a Magellanic spiral with a faint but discernible internal structure. With a mass of
 $1.38 \times 10^{11}\,{\rm M}_\odot$
(Erkal et al. Reference Erkal2019), it far exceeds the relatively modest
 $7 \times 10^9\,{\rm M}_\odot$
of the Small Magellanic Cloud (SMC) (Bekki & Stanimirović Reference Bekki and Stanimirović2009), itself a dwarf irregular with a low mean metallicity of
 $-0.97 \pm 0.05$
dex (Choudhury et al. Reference Choudhury2020). These morphologies and metallicities are similar to those commonly observed in galaxies at redshifts
 $z = 2$
and beyond (see for example Curti et al. Reference Curti2019 in comparison to the LMC). That period corresponds to the ‘cosmic noon’, the period
 $(2\lt z\lt3)$
in which star formation was most active (Madau & Dickinson Reference Madau and Dickinson2014) and a critical period for understanding galaxy evolution.
The kinematics of the Magellanic Clouds are key to understanding the full dynamical history of the Local Group, and this is in turn key to understanding the dynamical history of the Magellanic Clouds. Prior to the Hubble Space Telescope (HST) mission to survey the Magellanic Clouds, they were modelled as bound satellites of the MW (Bekki & Chiba Reference Bekki and Chiba2005). The first proper motion analysis of the LMC using HST data determined the its centre of mass proper motion to be (
 $2.03\pm{0.08}$
,
 $0.44\pm{0.05}$
) milliarcseconds per year (Kallivayalil et al. Reference Kallivayalil, van der Marel, Alcock, Axelrod, Cook, Drake and Geha2006), leading to a first-infall model (Besla et al. Reference Besla, Kallivayalil, Hernquist, Robertson, Cox, van der Marel and Alcock2007). Further epochs of observation with the HST allowed a refined proper motion estimate of (
 $1.910\pm{0.08}$
,
 $0.229\pm{0.047}$
) milliarcseconds per year (Kallivayalil et al. Reference Kallivayalil, van der Marel, Besla, Anderson and Alcock2013). This second proper motion estimate also adopted a different location for the dynamical centre of the LMC, which is not a well-constrained parameter for a disc at relatively low inclination (Kim et al. Reference Kim, Staveley-Smith, Dopita, Freeman, Sault, Kesteven and McConnell1998; van der Marel & Cioni Reference van der Marel and Cioni2001)
The James Webb Space Telescope was used in conjunction with HST data (Libralato et al. Reference Libralato2023) to show that the young stellar population of the LMC has higher velocities and velocity dispersion than the general population. The results of the VISTA survey of the Magellanic Clouds system (Emerson & Sutherland Reference Emerson and Sutherland2010) are in agreement with both the dynamical centre used for the HST analysis (Niederhofer et al. Reference Niederhofer2022) and the kinematic offset of the young stellar population (Vijayasree et al. Reference Vijayasree2025).
The Gaia mission (Gaia Collaboration et al. Reference Collaboration2018a; Katz et al. Reference Katz2023) has provided the most comprehensive optical survey of the Magellanic Clouds to date. The most recent kinematic study of the stellar population by Gaia Collaboration et al. (Reference Collaboration2021) calculated multiple proper motions by holding different dynamical parameters as constant. They found a proper motion of (
 $1.858\pm{0.02}$
,
 $0.385\pm{0.05}$
) milliarcseconds per year with a dynamical centre of (
 $81.28^{\circ}$
,
 $-69.78^{\circ}$
), and an equally plausible proper motion of (
 $1.847\pm{0.02}$
,
 $0.371\pm{0.047}$
) milliarcseconds per year with a dynamical centre at (
 $81.07^{\circ}$
,
 $-69.41^{\circ}$
); the centre is still relatively unconstrained by existing observations. A measure of LMC kinematics independent of optical observations is required to further refine the proper motion of the Magellanic Clouds.
Radio searches towards star formation regions in the Magellanic Clouds have detected interstellar masers from a number of transitions, 22 GHz water masers being the most commonly observed (van Loon et al. Reference van Loon, Zijlstra, Bujarrabal and Nyman2001; Brogan et al. Reference Brogan, Goss, Lazendic and Green2004; Ellingsen et al. Reference Ellingsen, Breen, Caswell, Quinn and Fuller2010; Imai et al. Reference Imai, Katayama, Ellingsen and Hagiwara2013). Interstellar masers are both intrinsically intense and compact, making them ideal targets for accurate radio astrometry and provide proper motion measurements independent of those made at optical wavelengths. While some of the water masers have been known for decades, the majority of observations have been made with large single-dish telescopes or connected element interferometers, neither of which have sufficient angular resolution to measure proper motions for the maser sources. The known water masers are all thought to be associated with young, high-mass star formation regions and hence trace a population of objects not covered in any of the Hubble or Gaia investigations.
Very long baseline interferometry (VLBI) has been used to make proper motion measurements of water masers associated with a number of northern hemisphere Local Group galaxies, in particular IC10 (Brunthaler et al. Reference Brunthaler, Reid, Falcke, Henkel and Menten2007) and M33 (Brunthaler et al. Reference Brunthaler, Reid, Falcke, Greenhill and Henkel2005), both of which are at significantly greater distances from the Milky Way than the Magellanic Clouds. High angular resolution imaging of water maser sources within the Magellanic Clouds can therefore enable astrometric measurements with the precision required to successfully determine proper motions of Magellanic Cloud sources.
In this paper, we present the results of the first sensitive, multi-epoch VLBI observations of water maser sources in the Magellanic Clouds.
2. Observation and data reduction
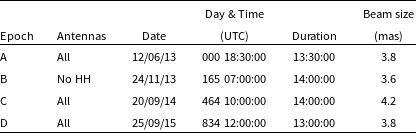
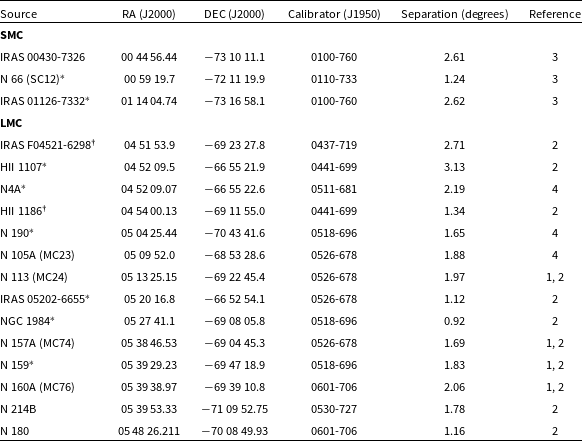
We have used the Long Baseline Array (LBA) to undertake four epochs of observations summarised in Table 1. The observations were made as part of project V490 and targeted a total of 17 Magellanic Clouds water maser sources. The name and position of each of the target masers is listed in Table 2.
The four epochs of observations in this experiment, along with the synthesised beam size for the manual phase calibrator PKSB0601-706 in that epoch. The 0601-706 beam was approximately circular in all epochs.

Table 1. Long description
The table presents data on four epochs of observations, detailing the date, time, duration, and beam size for each epoch. The table has four rows and five columns. The columns are labeled Day & Time, Beam size, Epoch, Antennas, and Date (UTC). The rows provide specific details for each epoch. Row 1: Day & Time, 000 18:30:00 13:30:00; Beam size, 3.8; Epoch, A; Antennas, All; Date (UTC), 12/06/13. Row 2: Day & Time, 165 07:00:00 14:00:00; Beam size, 3.6; Epoch, B; Antennas, No HH; Date (UTC), 24/11/13. Row 3: Day & Time, 464 10:00:00 14:00:00; Beam size, 4.2; Epoch, C; Antennas, All; Date (UTC), 20/09/14. Row 4: Day & Time, 834 12:00:00 13:00:00; Beam size, 3.8; Epoch, D; Antennas, All; Date (UTC), 25/09/15.
All maser sources targeted in this experiment. The RA and DEC reported are the initial coordinates of antenna pointings used for this experiment’s observations. Phase calibrators listed are those used for imaging where possible; masers not detected are indicated by a † after the source name, while those not imaged by phase transfer are indicated by an *. Reference is made to the most recent observation of the source.

Table 2. Long description
A table listing maser sources targeted in an experiment. The table has 15 rows and 5 columns. The columns are labeled Source, RA (J2000), DEC (J2000), Calibrator (J1950), Separation (degrees), and Reference. Row 1: Source, IRAS 00430-7326; RA (J2000), 00 44 56.44; DEC (J2000), 73 10 11.1; Calibrator (J1950), 0100-760; Separation (degrees), 2.61; Reference, 3. Row 2: Source, N 66 (SC12)*; RA (J2000), 00 59 19.7; DEC (J2000), 72 11 19.9; Calibrator (J1950), 0110-733; Separation (degrees), 1.24; Reference, 3. Row 3: Source, IRAS 01126-7332*; RA (J2000), 01 14 04.74; DEC (J2000), 73 16 58.1; Calibrator (J1950), 0100-760; Separation (degrees), 2.62; Reference, 3. Row 4: Source, LMC IRAS F04521-6298; RA (J2000), 04 51 53.9; DEC (J2000), 69 23 27.8; Calibrator (J1950), 0437-719; Separation (degrees), 2.71; Reference, 2. Row 5: Source, HII 1107*; RA (J2000), 04 52 09.5; DEC (J2000), 66 55 21.9; Calibrator (J1950), 0441-699; Separation (degrees), 3.13; Reference, 2. Row 6: Source, N4A*; RA (J2000), 04 52 09.07; DEC (J2000), 66.55.22.6; Calibrator (J1950), 0511-681; Separation (degrees), 2.19; Reference, 4. Row 7: Source, HII 1186; RA (J2000), 04 54 00.13; DEC (J2000), 69 11 55.0; Calibrator (J1950), 0441-699; Separation (degrees), 1.34; Reference, 2. Row 8: Source, N 190*; RA (J2000), 05 04 25.44; DEC (J2000), 70 43 41.6; Calibrator (J1950), 0518-696; Separation (degrees), 1.65; Reference, 4. Row 9: Source, N 105A (MC23); RA (J2000), 05 09 52.0; DEC (J2000), 68 53 28.6; Calibrator (J1950), 0526-678; Separation (degrees), 1.88; Reference, 4. Row 10: Source, N 113 (MC24); RA (J2000), 05 13 25.15; DEC (J2000), 69 22 45.4; Calibrator (J1950), 0526-678; Separation (degrees), 1.97; Reference, 1, 2. Row 11: Source, IRAS 05202-6655*; RA (J2000), 05 20 16.8; DEC (J2000), 66 52 54.1; Calibrator (J1950), 0526-678; Separation (degrees), 1.12; Reference, 2. Row 12: Source, NGC 1984*; RA (J2000), 05 27 41.1; DEC (J2000), 69 08 05.8; Calibrator (J1950), 0518-696; Separation (degrees), 0.92; Reference, 2. Row 13: Source, N 157A (MC74); RA (J2000), 05 38 46.53; DEC (J2000), 69 04 45.3; Calibrator (J1950), 0526-678; Separation (degrees), 1.69; Reference, 1, 2. Row 14: Source, N 159*; RA (J2000), 05 39 29.23; DEC (J2000), 69 47 18.9; Calibrator (J1950), 0518-696; Separation (degrees), 1.83; Reference, 1, 2. Row 15: Source, N 160A (MC76); RA (J2000), 05 39 38.97; DEC (J2000), 69 39 10.8; Calibrator (J1950), 0601-706; Separation (degrees), 2.06; Reference, 1, 2. Row 16: Source, N 214B; RA (J2000), 05 39 53.33; DEC (J2000), 71 09 52.75; Calibrator (J1950), 0530-727; Separation (degrees), 1.78; Reference, 2. Row 17: Source, N 180; RA (J2000), 05 48 26.211; DEC (J2000), 70 08 49.93; Calibrator (J1950), 0601-706; Separation (degrees), 1.16; Reference, 2.
1. Ellingsen et al. (Reference Ellingsen, Breen, Caswell, Quinn and Fuller2010), 2. Imai et al. (Reference Imai, Katayama, Ellingsen and Hagiwara2013), 3. Breen et al. (Reference Breen, Lovell, Ellingsen, Horiuchi, Beasley and Marvel2013), 4. Johanson et al. (Reference Johanson, Migenes and Breen2014).
For these observations the LBA included six antennas: the Australian Telescope Compact Array (ATCA;
 $5\times 22$
m antennas as a phased array), the Parkes Observatory (Parkes; 64m), the Mopra Radio Telescope (Mopra; 22m), the Mount Pleasant Radio Observatory (Hobart; 26m), the Ceduna Radio Observatory (Ceduna; 30m) and the Hartebeesthoek Radio Astronomy Observatory (Hart; 26m). Each of the four observing sessions was 13–14 h, with individual scans of approximately 100 s duration alternating between maser and nearby continuum calibrator sources. Observations targeted the frequency range 22 211–22 243 MHz, divided into 2 048 spectral channels of width 16 kHz and velocity resolution 105 ms
 $^{-1}$
.
Approximately one week prior to each LBA session, the maser sources were observed using the ATCA to check for spectral and flux density variability in the targets and inform optimisation of the VLBI schedule. We interleaved observations of the maser sources with nearby compact extragalactic sources to provide phase reference information and enable relative astrometry (the measurement of change in position of the maser over time). Potential phase calibration sources were selected from the Radio Reference frame database of Petrov & Kovalev (Reference Petrov and Kovalev2025). At the time of the observations this typically contained an estimate of the VLBI-scale flux density of these sources at one or two epochs at a frequency of 8 GHz. Table 2 gives the final phase calibrator used for each of the target masers, the angular separation of each pairing, and indicates which pairings provided a solution of sufficient quality to enable imaging of the maser.
The data were reduced using the NRAO Astronomical Image Processing Software (AIPS) package and visualised using the Karma visibilities (kvis) and Cube Analysis and Rendering Tool for Astronomy (CARTA) packages. The observations followed a typical VLBI astrometry strategy, with a number of scans of a very strong, compact calibrator source to measure the delays and rates (manual phase calibration), several 30 min blocks targeting strong extragalactic sources with well determined positions to estimate the tropospheric delay (geoblocks), and the remaining time spent on the astrometric observations of the maser targets.
The source PKSB1921-293 was the intended manual phase calibrator, but for two of the four epochs we were not able to use it for this purpose due to one or more of the antennas not participating in the observations of this source. We instead used the best of the phase reference sources, PKSB0601-706, to calibrate the rates and delays consistently across all epochs.
We were not able to obtain reliable manual phase calibration for Hartebeesthoek due to the limited mutual visibility and hence the data used for analysis included only the 5 Australian antennas. Due to a combination of limited zenith angle coverage (Parkes has an elevation limit of 30 degrees) and array sensitivity, most geoblocks did not provide a reliable estimate of the tropospheric delay and so were not used in the analysis. Reliable amplitude calibration data was not available for some of the antennas and so the nominal sensitivity of each antenna at 22 GHz was used to set the relative weights. The resulting degradation of amplitude calibration data had minimal impact on the astrometric measurements which were the main purpose of these observations.
3. Results
Interstellar masers are compact and intrinsically narrow-band sources that can reliably be self-calibrated. We were able to detect maser emission in an image cube following self-calibration in at least one of the four epochs for 15 of the 17 targeted masers. The two exceptions were IRASF 04521-6298 and HII 1186.
To undertake relative astrometry we have two options: we can transfer the phase measurements from the extragalactic calibrator to the maser and measure the relative maser position, or in the case of strong masers we can use the maser as the reference source and measure the relative position of the extragalactic calibrator. The latter approach is commonly used for Galactic maser astrometry, but due to the greater distance to the Magellanic Clouds the maser emission we detect is weaker and so here we have used standard phase referencing of the masers based on the extragalactic calibrator.
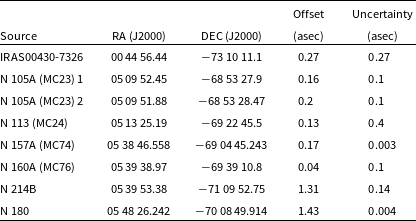
This approach allowed us to successfully detect nine of the seventeen maser targets following phase referencing. For seven of these nine masers we obtained detections in three or more epochs, N 180, N 157A, N 113, N 214B, N 105A, N 160A, and IRAS 00430-7326. The first six of these sources are in LMC regions and the last listed is within the SMC. For these seven sources, the improved position and associated uncertainty are given in Table 3. The previous positions were based on Australia Telescope Compact Array observations which have a typical astrometric accuracy of 0.4 arcsec; however, at 22 GHz positional errors of up to 2 arcsec are commonly seen in observations of Galactic water masers. For the Magellanic cloud masers the improved astrometry has in most cases shifted the maser position by less than 0.5 arcsec, with the largest being for N 180 at 1.4 arcsec. Appendix B reports relevant position information for maser sources.
Observed position of maser sources for which phase transfer was achieved, both absolute and relative to previous observations. For maser sources where a proper motion was not observed, the uncertainty in position is taken to be the magnitude of the distribution around an assumed central position.

Table 3. Long description
A table titled ’Observed position of maser sources for which phase transfer was achieved, both absolute and relative to previous observations.’ The table has seven rows and five columns. The columns are labeled ’Source’, ’RA (J2000)’, ’DEC (J2000)’, ’Offset (asec)’, and ’Uncertainty (asec)’. Row 1: IRAS00430-7326, 00 44 56.44, 73 10 11.1, 0.27, 0.27. Row 2: N 105A (MC23) 1, 05 09 52.45, 68 53 27.9, 0.16, 0.1. Row 3: N 105A (MC23) 2, 05 09 51.88, 68 53 28.47, 0.2, 0.1. Row 4: N 113 (MC24), 05 13 25.19, 69 22 45.5, 0.13, 0.4. Row 5: N 157A (MC74), 05 38 46.558, 69 04 45.243, 0.17, 0.003. Row 6: N 160A (MC76), 05 39 38.97, 69 39 10.8, 0.04, 0.1. Row 7: N 214B, 05 39 53.38, 71 09 52.75, 1.31, 0.14. Row 8: N 180, 05 48 26.242, 70 08 49.914, 1.43, 0.004. The table provides the right ascension and declination coordinates of various maser sources, along with their offsets and uncertainties in arcseconds.
Emission was detected in two regions of N 105A, matching two historical regions of emission. Offsets are reported relative to the nearest historical emission.
3.1. Proper motions
The primary science goal of this experiment was the determination of the bulk motion of the Magellanic Clouds from tracers independent of the stellar populations that have been used in previous investigations. Of the seven water maser sources for which we were able to successfully image following phase calibration only those associated with the two regions N 180 and N 157A showed similar positions across all the epochs. For these sources we can use the change in the position relative to the extragalactic calibrator over time to accurately estimate the proper motion.
3.1.1. N 180
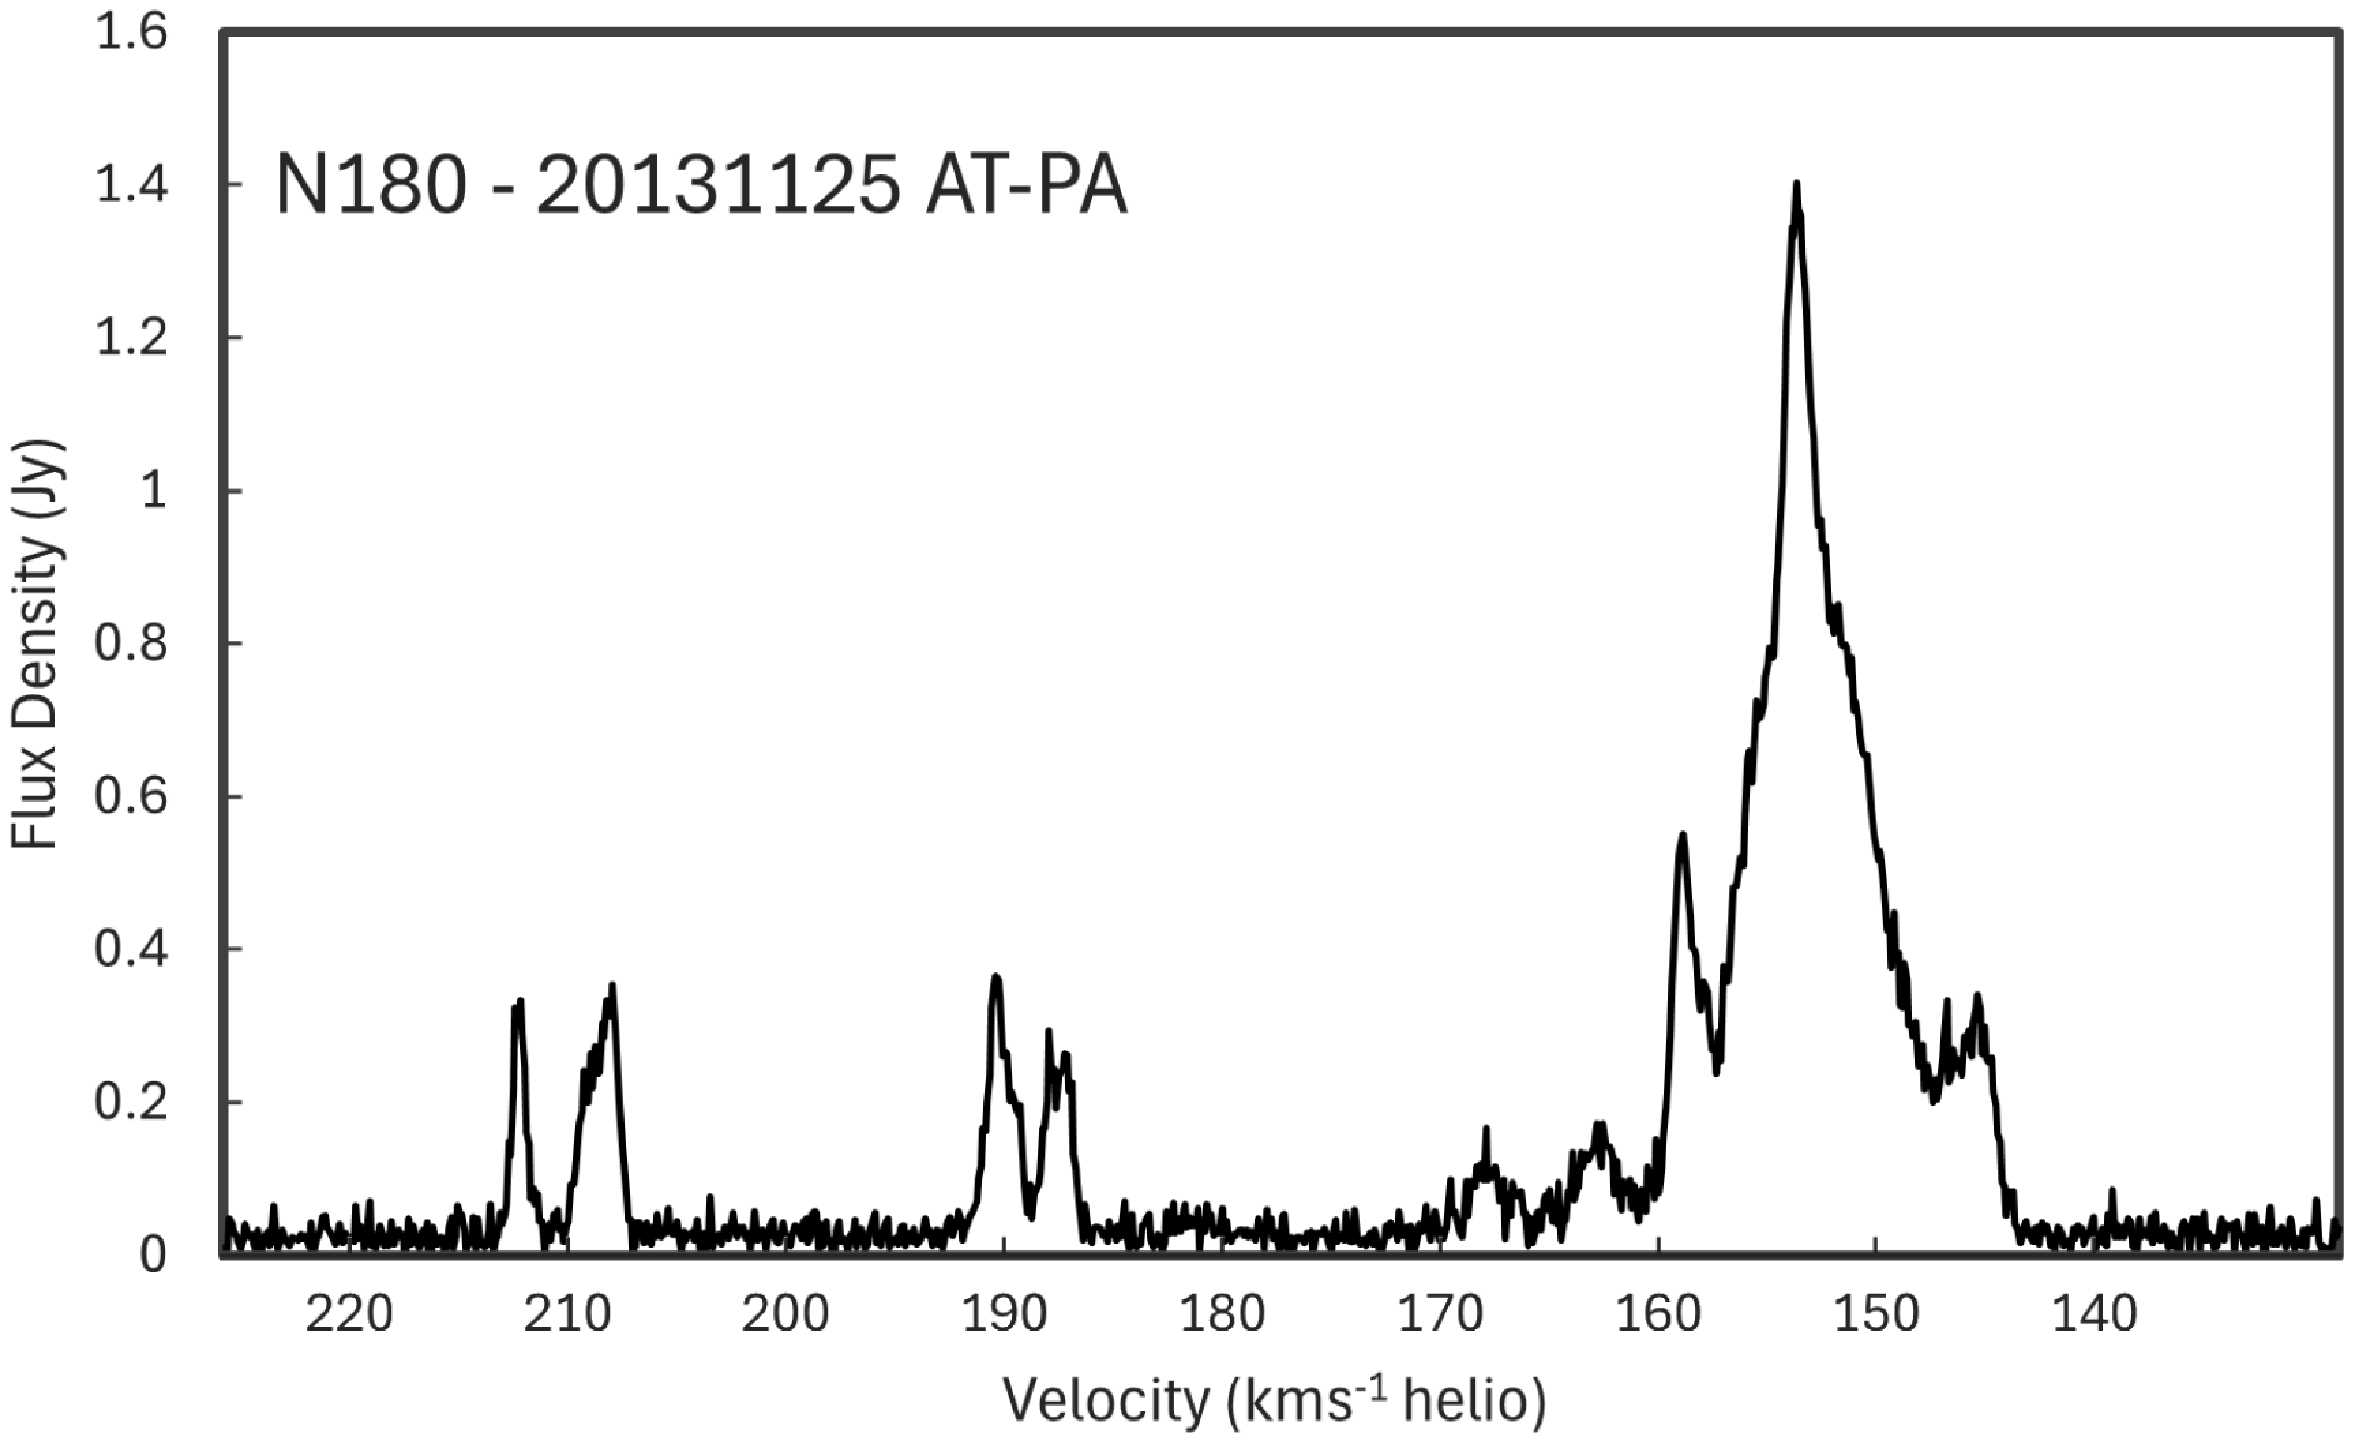
Figure 1 shows the spectrum of N 180 over the velocity range of 122–232 km s
 $^{-1}$
. While Galactic water masers associated with star formation regions sometimes show emission over a relatively wide velocity range, which can exceed 100 km s
 $^{-1}$
, in most cases the spectrum shows multiple narrow spectral peaks with some overlap. N 180 has an unusual spectrum, with very broad emission more reminiscent of the emission seen in some extragalactic water masers associated with AGN jets (e.g. Claussen et al. Reference Claussen, Diamond, Braatz, Wilson and Henkel1998). In the cross-correlation spectrum the phase across the majority of the water maser emission (between 200 and 140 km s
 $^{-1}$
) is approximately constant on longer baselines, showing it arises from the same region (on scales of 10–100 microarcseconds).
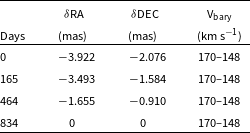
Astrometric parameters of the primary spectral feature of the N180 source in four epochs, from channel-averaged images of a velocity range of 22 km s
 $^{-1}$
. Offsets are reported with respect to the position of the N180 primary spectral feature in Epoch D.

Table 4. Long description
A table with four rows and three columns. The columns are labeled Days, delta RA (mas), delta DEC (mas), and V_bary (km s). The row labels are 0, 165, 464, and 834. The values in the table are as follows: Row 1: Days, 0; delta RA (mas), -3.922; delta DEC (mas), -2.076; V_bary (km s), 170-148. Row 2: Days, 165; delta RA (mas), -3.493; delta DEC (mas), -1.584; V_bary (km s), 170-148. Row 3: Days, 464; delta RA (mas), -1.655; delta DEC (mas), -0.910; V_bary (km s), 170-148. Row 4: Days, 834; delta RA (mas), 0; delta DEC (mas), 0; V_bary (km s), 170-148. The table shows the astrometric parameters of the primary spectral feature of the N180 source in four epochs, with offsets reported with respect to the position of the N180 primary spectral feature in Epoch D.
The spectral profile of the AT-PA baseline of N180 in Epoch B using associated 0601-706 calibration solution.

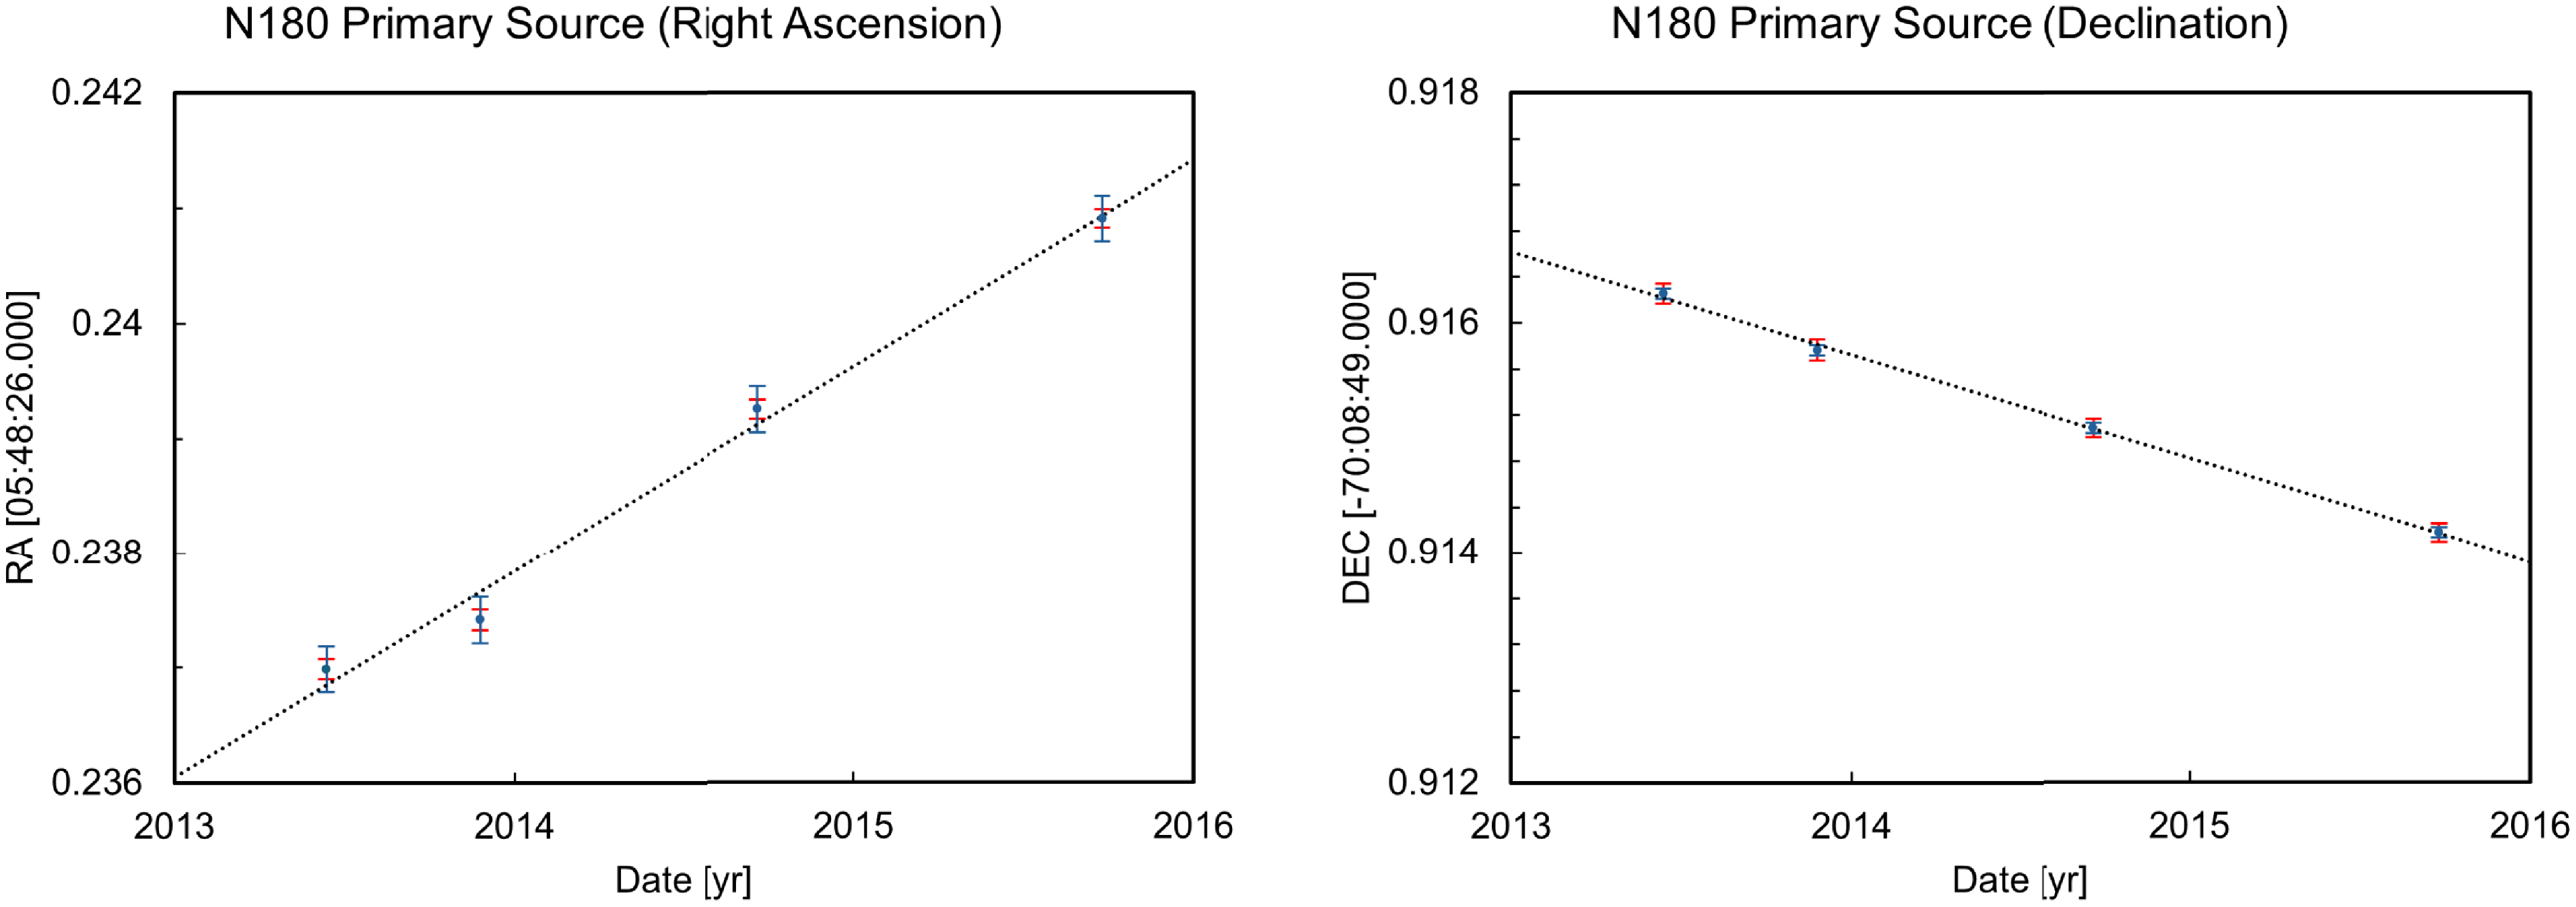
The maser positions from Table 4 against the linear models used to derive the final proper motion. The dotted line shows the modelled proper motion. Blue error bars represent the uncertainty determined from fitting a linear model to the data; red error bars represent the uncertainty calculated from known observational characteristics.

The primary spectral feature of N 180 was imaged by channel-averaging the velocity range 170–158 km s
 $^{-1}$
, for which the cross correlation spectra showed a constant phase. Narrower spectral ranges had noticeably degraded image signal-to-noise ratios in Epoch C, though the positions derived from other epochs were not affected, so the broad average was chosen to maintain consistency between epochs.
The emission at velocities around 210 km s
 $^{-1}$
show an offset phase in the cross-correlation spectra and so provide an opportunity to measure the relative location of a second spectral feature in the same field. This was imaged by channel-averaging a narrower velocity range of 210–206 km s
 $^{-1}$
.
Figure 2 shows the observed proper motion of the strongest N180 emission in right ascension and declination over the four epochs. The proper motions as measured from a straight-line fit for the two spectral components are slightly different, at (
 $1.79\pm{0.13}$
,
 $0.89\pm{0.07}$
) and milliarcseconds per year for the primary feature and (
 $1.49\pm{0.74}$
, 0.79
 $\pm{0.14}$
) milliarcseconds per year for the secondary feature, a large difference which suggests the secondary feature is associated with an unusually fast outflow offset from the primary feature by 120 km s
 $^{-1}$
. The high uncertainty of the measurement for the second significantly weaker spectral feature means it is plausible that both have the same bulk proper motion, and both components should be moving with the associated YSO.
3.1.2. N 157A
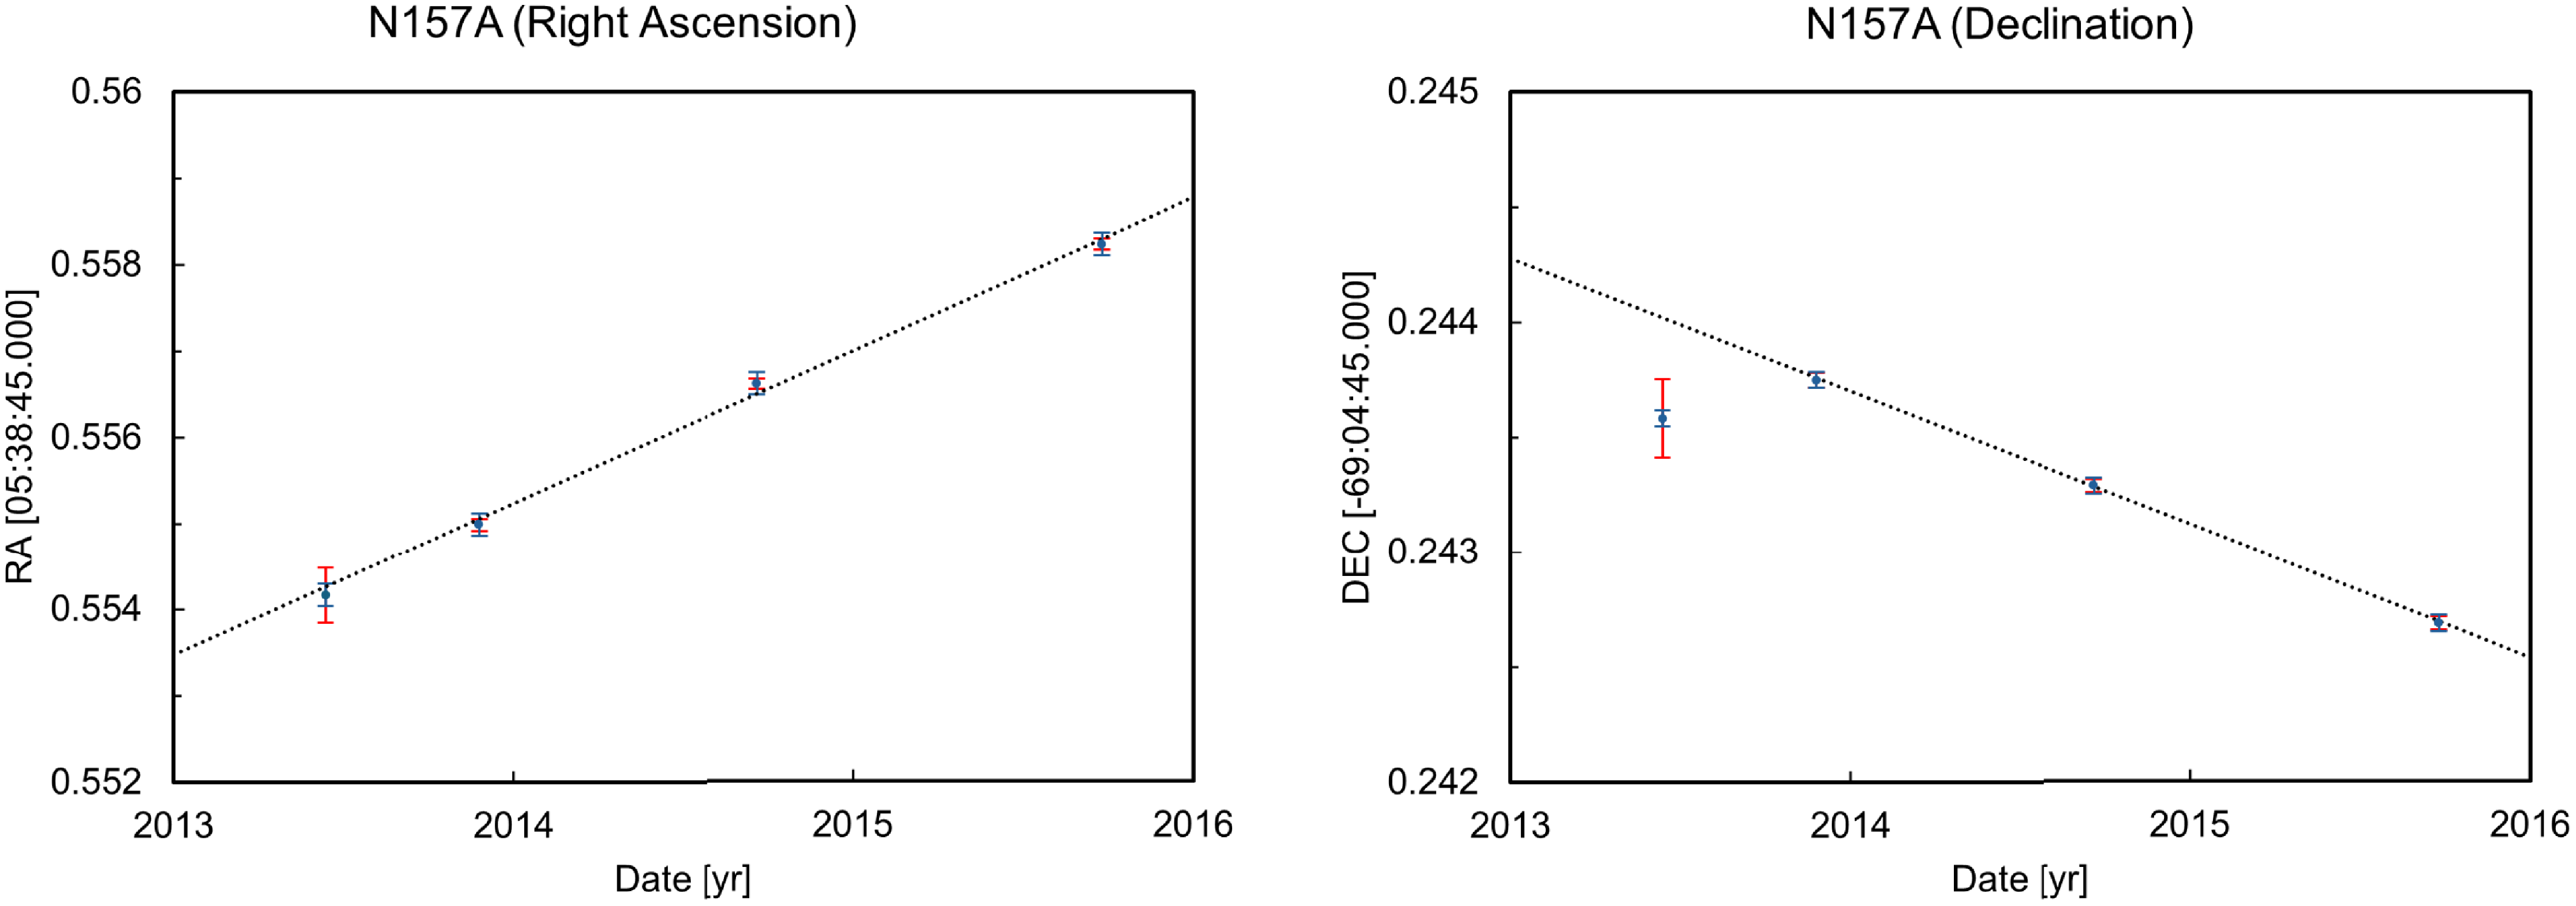
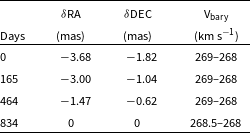
N 157A had no secondary features, but lower time on source in the first epoch resulted in a significantly larger synthesised beam (approximately 5 times) than for the other epochs, with correspondingly large sidelobes. Figure 3 shows the observed motion of N 157A, and we measured two possible proper motions, (
 $1.74\pm{0.29}$
,
 $0.55\pm{0.08}$
) milliarcseconds per year excluding the first epoch and (
 $1.63\pm{0.34}$
,
 $0.74\pm{0.37}$
) including it.
The maser positions from Table 5 against the linear models used to derive the final proper motion. Epoch A has been included in the plotting but was not considered for the creation of the linear model. The dotted line shows the modelled proper motion. Blue error bars represent the uncertainty determined from fitting a linear model to the data; red error bars represent the uncertainty calculated from known observational characteristics.

3.1.3. Uncertainties
Figures 2 and 3 show two separate error bars for separate methods of determining the positional uncertainty of observations. The uncertainties represented by red error bars were calculated from the separation between maser and calibrator. The assumed characteristics of the observational setup for this calculation were a 1 500 km baseline observing at a mean 45 degree zenith angle, using the dominant term in the uncertainty equation of Rioja & Dodson (Reference Rioja and Dodson2020) in the 22 GHz regime. The one exception is the Epoch A observation of N 157A, where the displayed error bars are the calculated uncertainty from the full width at half maximum of the synthesised beam, which was larger than that calculated from maser-calibrator separation.
The uncertainties represented by the blue error bars were determined statistically from minimising the reduced chi squared of the linear fit to the observed positions.
The final reported uncertainties we report are the statistical rather than calculated uncertainties, as there were several known issues with the current observations that impact astrometric precision which are not included in the equations Rioja & Dodson (Reference Rioja and Dodson2020) derive.
4. Discussion
4.1. Proper motions
We have used Gaia DR3 data to determine regional proper motions from the averages of reliable stellar sources within 1 arcmin of the observed position of the masing source. The process is outlined in greater detail in Appendix A.1.
Astrometric parameters of the primary spectral feature of N157A in all four epochs, from channel-averaged images of a velocity range of 1 km s
 $^{-1}$
barycentric. Offsets are reported with respect to the position in Epoch D.

Table 5. Long description
A table showing astrometric parameters of the primary spectral feature of N157A across four epochs. The table has four rows and three columns. The columns are labeled Days, delta RA (mas), delta DEC (mas), and V bary (km s^-1). The row labels are 0, 165, 464, and 834. The values in the table are as follows: Row 1: Days, 0; delta RA (mas), -3.68; delta DEC (mas), -1.82; V bary (km s^-1), 269-268. Row 2: Days, 165; delta RA (mas), -3.00; delta DEC (mas), -1.04; V bary (km s^-1), 269-268. Row 3: Days, 464; delta RA (mas), -1.47; delta DEC (mas), -0.62; V bary (km s^-1), 269-268. Row 4: Days, 834; delta RA (mas), 0; delta DEC (mas), 0; V bary (km s^-1), 268.5-268.
For N 180, the DR3 proper motion of the region was found to be
 $(1.76\pm{}0.77, 0.86\pm{}0.57)$
, compared to the maser source proper motion of (
 $1.79\pm{}0.13$
,
 $0.89\pm{}0.07$
) milliarcseconds per year. The secondary maser spectral feature providing a semi-independent tracer of the same region as the primary feature. The close agreement between the Gaia and maser proper motions is strong evidence that the maser proper motion measurement has low peculiar motion.
For N 157A, the three-epoch proper motion measurement has a lower uncertainty. The first epoch of observation was undersampled compared to subsequent epochs, and the primary source of uncertainty in the derived four-epoch proper motion is that epoch’s inconsistency with the other three. The DR3 proper motion of the region was found to be
 $(1.70\pm{}0.40, 0.78\pm{}0.39)$
, compared to the three-epoch solution proper motion of (
 $1.74\pm{}0.29$
,
 $0.55\pm{}0.08$
) milliarcseconds per year. These closely match the proper motions expected from the LMC rotation curves of Jiménez-Arranz et al. (Reference Jiménez-Arranz2023), derived from Gaia DR2 data. We conclude that the masing sources observed trace the same motions as optical surveys, providing independent verification of the optical results.
4.2. Other masers
Nearly all sources targeted in this experiment were detected with good signal to noise on the AT-PA baseline and could be imaged using self-calibration of the interferometric data.
Phase transfer solutions were less reliable. The most critical problem was the lack of prior interferometric observations of calibrators in the 22 GHz regime. Scheduling in Epoch A was not consistent with other epochs, as this first epoch was also used to trial possible maser-calibrator pairs; existing southern 22 GHz quasar surveys (e.g. ATCA survey C2049) were performed with connected-element interferometers and the majority of the calibrator sources found were not suitable VLBI calibrators.
The current observations have identified a number of 22 GHz calibrators suitable for future VLBI phase referencing of Magellanic Clouds water masers. The calibrator-maser separations are between 1.7 and 2 degrees which are at the upper limit for reliable phase transfer at this frequency. The most critical factor required to make more accurate water maser proper motions for Magellanic Clouds sources in the future will be to identify additional suitable phase calibrators close to the targets.
5. Conclusions
The measured proper motions for the N180 and N175A water masers in the LMC find that they are both consistent with the motion of their local regions as determined from Gaia DR3. Consideration of the Gaia-derived rotation curve also shows that they are in good agreement with each other as tracers of the bulk motion of the LMC and trace motion closest to the
 $(1.847\pm{}0.02, 0.371\pm{}0.047)$
milliarcseconds per year figure given for the LMC by Gaia Collaboration et al. (Reference Collaboration2021) using a dynamical centre of (
 $81.07^{\circ}$
,
 $-69.41^{\circ}$
). This supports optical evidence suggesting that the dynamical centre of the LMC is offset from its current assumed position.
While the technique of phase referencing used in this experiment is sufficient for limited future 22 GHz astrometric studies of the Magellanic Clouds, a wider and more well-understood catalogue of calibrators at 22 GHz would significantly improve the options for scheduling and phase referencing. We recommend a comprehensive survey for calibrator sources before any further attempts at water maser astrometry in the galaxies.
Acknowledgements
The Long Baseline Array is part of the Australia Telescope National Facility (https://ror.org/05qajvd42) which is funded by the Australian Government for operation as a National Facility managed by CSIRO. Data were processed using the AIPS (Glendenning Reference Glendenning, Jacoby and Barnes1996), CARTA (Comrie et al. Reference Comrie2021), and kvis (Gooch Reference Gooch, Jacoby and Barnes1996) software packages.
Data availability statement
Observation data used for this project can be downloaded from the Australian Telescope Online Archive (ATOA, https://atoa.atnf.csiro.au/) under project name V490.
Funding statement
S.E. – This research was supported by the Australian Research Council (ARC) Discovery grant No. DP230100727. H.I. – This research was supported by JSPS Strategic Young Researcher Overseas Visits Program for Accelerating Brain Circulation (ID 177012).
Appendix A. Comparison to existing studies
This appendix gives details as to the method used to measure regional motions for the LMC from Gaia DR3, alluded to in Section 4.1.
A.1. GAIA data
Initial data collection was performed by querying the Gaia DR3 archive for sources within 60 arcsec of the chosen coordinate.
Gaia sources without a listed proper motion or with high parallax (parallax above 0.05 milliarcseconds or with uncertainty above 2
 $\sigma$
) were removed to correct for possible foreground contamination.
The local proper motion was then determined by averaging the proper motion of the remaining sources in RA and DEC separately.
A.2. Kinematic comparison
A.2.1. Proper motions
The local proper motions determined from DR3 were compared to available DR2 proper motion maps of the LMC (Vasiliev Reference Vasiliev2018; Gaia Collaboration et al. Reference Collaboration2018 b) at a set of specific grid points in the orthographic projection approximating a flat LMC:
 \begin{align*}x &= \cos(\delta{})\sin(\alpha{} - \alpha_{c}) \\y & = \sin(\delta{})\cos(\delta_{c}) - \cos(\delta{})\sin(\delta_{c})\cos(\alpha{} - \alpha_{c}) \\\mu_{x} &= \mu_{\alpha{}}\cos(\alpha{} - \alpha_{c}) - \mu_{\delta{}}\sin(\delta{})\sin(\alpha{} - \alpha_{c}) \\\mu_{y} &= \mu_{\alpha{}}\sin(\delta_{c})\sin(\alpha{} - \alpha_{c})\\ &\quad + \mu_{\delta{}}(\cos{\delta{}}\cos{\delta_{c}}) + \sin(\delta{})\sin(\delta_{c})\cos(\alpha{} - \alpha_{c}) \end{align*}
where x and y are the position along the x and y axes of the target region’s projection;
 $\alpha$
and
 $\delta$
are the position in degrees of right ascension and declination, respectively of the target region;
 $\mu_{\rm subscript}$
is the magnitude of the proper motion – the subscript refers to the direction of proper motion along either an unprojected or projected axis;
 $\alpha_c$
is the central position of the LMC in degrees of right ascension, being 81
 $^{\circ}$
in the Vasiliev projection and 78
 $^{\circ}$
in the Gaia projection;
 $\delta_c$
is the central position of the LMC in degrees of declination, being –69.75
 $^{\circ}$
in the Vasiliev projection and
 $-69.01^{\circ}$
in the Gaia projection.
Under these conditions, a high level of agreement was found between the DR3 data and the less comprehensive DR2 data. The DR3 data in the two regions with maser proper motions was then found to be:
N 157A –
 $(1.70\pm{}0.40, 0.78\pm{}0.39)$
milliarcseconds per year, compared to an observed motion of
 $(1.74\pm{0.29}, 0.55\pm{0.08})$
milliarcseconds per year for the maser source.
N 180 –
 $(1.76\pm{}0.77, 0.86\pm{}0.57)$
milliarcseconds per year, compared to an observed motion of
 $(1.79\pm{}0.13, 0.89\pm{}0.03)$
milliarcseconds per year for the maser source.
Both sources are in very good agreement with the motions derived from DR3 for their regions, indicating very little peculiar motion in the related masing regions.
A.2.2. Rotation curve
Additionally, the observed proper motions were compared after subtracting the rotation curve determined from Gaia data by Jiménez-Arranz et al. (Reference Jiménez-Arranz2023). This also required transformation to and from the projection of A.2.1; all final values are reported in unprojected J2016 coordinates.
N 157A – The rotational component of the motion at N 157A’s position is
 $(0.013, 0.219)$
milliarcseconds per year in RA and DEC, respectively. Subtracted from the proper motion of the N 157A maser, the nonrotational component of the proper motion is found to be
 $(1.76\pm{}0.29, 0.39\pm{}0.08)$
milliarcseconds per year.
N 180 – The rotational component of the motion at N 180’s position is
 $(-0.011, 0.159)$
milliarcseconds per year in RA and DEC, respectively. Subtracted from the proper motion of the N 157A maser, the nonrotational component of the proper motion is found to be
 $(1.80\pm{}0.14, 0.66\pm{}0.03)$
milliarcseconds per year.
A.2.3. Radial velocity
The N180 source is found in the H
 $_{\mathrm{II}}$
region LHA 120-N 180, and the N157A source is found in a subregion of the larger 30 Doradus H
 $_{\mathrm{II}}$
region. The H
 $_{\mathrm{I}}$
and H
 $_{\mathrm{\alpha}}$
radial velocities of each were sampled by Lah et al. (Reference Lah, Colless, D’Eugenio, Groves and Gelfand2024), which found that both gas populations in each region were at the adopted systemic velocity of 270 km s
 $^{-1}$
, with a velocity dispersion of approximately 20 km s
 $^{-1}$
.
The molecular gas content was most recently surveyed by Mizuno et al. (Reference Mizuno2001), which catalogued the characteristics of CO clouds in the LMC. The N157A source is found within the LMC/M5391-6906 cloud, which has a radical velocity of 263 km s
 $^{-1}$
and a velocity line width of 7.7 km s
 $^{-1}$
. The water maser emission has a peak velocity of 268 km s
 $^{-1}$
, in lockstep with all gas content in the region.
The N180 source is found within the LMC/M5486-7040 cloud, which has a radial velocity of 232 km s
 $^{-1}$
and a velocity line width of 8.9 km s
 $^{-1}$
. This is significantly lower than the radial velocity of the H
 $_{\mathrm{I}}$
and H
 $_{\mathrm{\alpha}}$
content of the region, but still significantly offset from the peak water maser velocity of 150–155 km s
 $^{-1}$
. The weaker maser features are closer to the radial velocities of the gas content, with the most intense at 210 km s
 $^{-1}$
, but still lie outside the dispersion ranges of the molecular gas content. For most star formation regions the strongest water maser emission occurs at velocities within 20 km s
 $^{-1}$
of the systemic velocity. Outflows with velocities which can exceed 100 km s
 $^{-1}$
are seen in some sources (Breen et al. Reference Breen, Caswell, Ellingsen and Phillips2010; Titmarsh et al. Reference Titmarsh, Ellingsen, Breen, Caswell and Voronkov2013), in most cases this is of lower intensity than the emission closer to the systemic velocity. That suggests that the systemic velocity of the N180 water masers is significantly offset from that of the bulk of molecular gas in this part of the LMC.
Each source has only one Gaia source within an arcminute with a reported radial velocity; both are faster than the systemic gas velocity.
Appendix B. Positional refinements
This short appendix discusses the observed positions of sources targeted in this experiment.
N 180’s adjusted position places it closer to the YSO J05482622-7008502 determined by Imai et al. to be its associated stellar object.
N 157A’s adjustment is very small, on the order of 0.01 arcsec compared to its existing position.
N 214B’s position was adjusted significantly (on the order of arcseconds) compared to the Imai et al. position, with a positional variance of around 0.3 arcsec. The shift is large enough that this low precision does not diminish the importance of the adjustment.
Other adjusted positions are insufficiently precise to be meaningfully different from their positions in existing studies.
 −1
 −1

 Open access

