




1. Introduction
In July 2020, the government of Flanders, the Dutch-speaking northern constituent state of Belgium, issued a video messageFootnote 1 on account of National Day (July 11th). The content of the message was uncontroversial: Flemings were exhorted to stay at home in order to contain the Covid-pandemic. The language of the 85-second video, however, was remarkable. The male actor spoke in an educated standard accent (with a slight trace of an Antwerp flavor), but his speech – a transcript of which can be found in Appendix A – contained no less than 34 tokens of shibboleth features of a generally stigmatized colloquial variety of Belgian Dutch dubbed tussentaal (literally ‘in-between-language’). The choice of this standard–nonstandard fusion is significant in a community with a complex standard language dynamic that can be glossed – somewhat indiscriminately – in the paradox that the Flemish revere and protect a spoken standard that very few Flemings speak, whereas they reject and stigmatize the variety that almost all Flemings speak.
Standard Dutch in Flanders is often regarded as an exoglossic variety, as it was modeled after Netherlandic Standard Dutch from the beginning of the twentieth century, following three centuries in which the development of Dutch in Flanders was complicated by foreign occupiers (subsequently Spain, Austria, and France) who preferred French for official communication (more extensive accounts of the history of Dutch in Flanders can be found in Absillis, Jaspers, & Van Hoof Reference Absillis, Jaspers and Van Hoof2012, Vandenbussche Reference Vandenbussche, Gilles, Scharloth and Ziegler2010, Vosters, Rutten, & Van der Wal Reference Vosters, Rutten and Van der Wal2010). The standardization of Dutch in Flanders gathered significant momentum in the interwar period, and eventually culminated in an uncontested written code, but not in a spoken lingua franca. Spoken Standard Dutch in Flanders is epitomized in the prestige variety produced on the national broadcaster Vlaamse Radio- en Televisieomroeporganisatie (better known as VRT, hence the label “VRT-Dutch”), and it is often described as an almost unattainable linguistic ideal that Flemings do not master, and target only when the formality of the occasion requires it (Geeraerts Reference Geeraerts2001 has used the “Sunday suit” metaphor in this respect).
Crucially, the reluctance to use VRT-Dutch is not mirrored in negative speaker attitudes towards that variety, on the contrary. The Belgian authorities’ eagerness to introduce Standard Dutch in Flanders culminated in a propagandistic and highly mediatized “hyperstandardization” project between the 1950s and 1980s (Van Hoof & Jaspers Reference Van Hoof and Jaspers2012:97), which thoroughly ideologized usage in Flemish society. Flemings were painstakingly imbued with the limitations of their dialects, and with the virtues and necessity of a non-Flemish standard language. This hyperstandardization did not foster a widely spoken consensus standard, but it did spawn an exclusionary ideology embodied in a hypersensitivity to language errors, and an attitudinal rejection (in terms of status) of Flemish endogenous varieties, notably tussentaal (Jaspers & Van Hoof Reference Jaspers and Van Hoof2013).
The tension between the ideological framing and the actual usage of Dutch in Flanders periodically erupts in mediatized language “wars” – typically following pleas from language professionals for a more moderate language policy or the use of tussentaal in television programs in which VRT-Dutch should allegedly be spoken – and it motors language-political exclusion by the authorities. Policy documents by former education ministers Vandenbroucke (Reference Vandenbroucke2007) and Smet (Reference Smet2009) are clear cases in point. Driven by emancipatory goals (viz. facilitating integration and upward mobility, see also Jaspers & Van Hoof Reference Jaspers and Van Hoof2013), these policies promote strict adherence to standard language norms as the primary means of achieving these aims, thereby marginalizing and delegitimizing nonstandard language practices. More concretely, in order to ensure equal opportunities for all Flemings, a variety of Dutch is required that is “correct,” “nonregional,” and “non-tussentaal” as a conditio sine qua non for participation in Flemish public life,Footnote 2 while “inarticulate language use or a tussentaal or a regional language” (Vandenbroucke Reference Vandenbroucke2007, our translation) is to be avoided at all costs.
In light of the pro-standard rhetoric of the Flemish authorities, a crucial question to be asked is what the language choice in the National Day video signifies, linguistically and language-politically.Footnote 3 To begin with, it plausibly signals that the authorities are aware of the fact that the default option of VRT-Dutch would be unsuitable for a video which aims to embrace a frustrated population, and to create a somewhat more festive atmosphere. The realization that such a captatio benevolentiae requires different overtones than status, formality, and neutrality is in itself a remarkable innovation in a standard language culture like Flanders.
Additionally, Van de Velde, Van Hout, & Gerritsen (Reference Van de Velde, Hout and Gerritsen1997) and Grondelaers, Van Hout, & Van Gent (Reference Grondelaers and Van Hout2016) have argued that the conscious inclusion of specific language features on national radio and television amounts to a more or less official acceptance of these features; in this capacity, such media licensing is a proxy for the earlier-day “codification” of features in lexicons and grammars. If that should be the case, then the copious use of tussentaal features in the official communication of a government which is an ardent promotor of Standard Dutch is no less than a legitimization, if not an endorsement of the used nonstandard variants. Phrased somewhat more programmatically: Does the National Day video propose a practical standard for Belgian Dutch?
Official legitimation is one of the four criteria that are widely cited as prerequisites for standardness, the others being uniformity (all community members preferably use the same variants and avoid variation), usage in formal settings, and overt prestige, in the sense that a standard language is associated with traditional success correlates including a privileged social background, high-quality education, strong professional competence, and a higher income (Auer Reference Auer, Kortmann and Van der Auwera2011:490, Deumert Reference Deumert2010:244, Ghyselen Reference Ghyselen, Lenz, Soukup and Koppensteiner2022, Grondelaers et al. Reference Grondelaers, Hout and Van Gent2016:120, Hinskens & Taeldeman Reference Hinskens, Taeldeman, Hinskens and Taeldeman2013:5). In this article we report a speaker evaluation experiment which principally investigates to what extent the mixed language in the National Day video meets the prestige criterion for standardness.
The relevance of this research extends beyond the Flemish situation in that it aligns with a broader scientific interest in the perceptual and ideological correlates of standard language dynamics. This focus on the perceptual side of the standardization coin was introduced in Milroy & Milroy (Reference Milroy and Milroy1985), who argued that standard language is a social construct and an ideological ideal rather than a fixed linguistic reality, which exists more in people’s beliefs and attitudes than in consistent, uniform usage. In most European countries, standard languages have been observed to incorporate proportionally more regional, social, ethnic, and stylistic (nonstandard) features, a process generally accounted for by the acceleration of informalization and democratization processes and their concomitant impact on the ideologies which frame and drive variation (see e.g. Ghyselen, Delarue, & Lybaert Reference Ghyselen, Delarue and Lybaert2016, Kristiansen & Coupland Reference Kristiansen and Coupland2011, Kristiansen & Grondelaers Reference Kristiansen and Grondelaers2013). From beliefs and attitudes with respect to the different types of variation percolating into European standard languages, experimental sociolinguists have inferred a tripartite division into conservative, modern, and regional standards. Since European standard languages typically derive from the regiolect of the socio-economically dominant class in a community, conservative standards which heed prescriptive norms are widely associated with prestige traits such as beauty, correctness, civility, and intellectual or professional competence; nonstandard varieties with regional or dialect features are typically subject to strong downgrading on these traits, but they are upgraded on scales pertaining to personal and social attractiveness and proximity. However, broader socio-cultural shifts in late modern Europe – such as globalization, migration, and digitalization – have fostered the association of nonstandard colloquial features with a new kind of modern or dynamic prestige linked to urban and hipster-like profiles, media-savvy presentation, and informal expressiveness. This coupling of colloquiality with modern prestige has spawned the emergence of “neo-standard” (Auer Reference Auer, Cerruti, Crocco and Marzo2017) varieties across the European territory that are delocalized, relaxed, and socially modern, signaling a move away from normative idealizations toward more dynamic and contemporary “practical” standards.
In this article, we zoom in on the competition between regional cues (accent) and colloquial features to explore how the tension between conservative, regional, and neo-standards manifests itself in Flanders, a community with a very conservative standard language ideology. In the following section, we first review the theoretical groundwork for each of the four standardness criteria within the context of the Flemish sociolinguistic situation. We subsequently propose two sets of testable research questions, which will be addressed in a contextualized speaker evaluation experiment in which the speech of the National Day video is manipulated in four conditions (with and without a regional accent, and with and without tussentaal features). After we have outlined the experiment’s design, we discuss evaluations on the scaled measures and then on the free response returns. In the final sections, we review our findings in response to the research questions, and ruminate on their empirical, methodological, and language-political significance.
2. Background
2.1. Uniformity
Traditionally, in language users’ conceptualizations of standard languages, linguistic uniformity is a crucial criterion (Milroy & Milroy Reference Milroy and Milroy1985): a standard language is (ideally) assumed to manifest no geographical variation in the territory in which it is used (cf. Auer Reference Auer, Kortmann and Van der Auwera2011:486). In actual linguistic practice, however, full uniformity is never achieved (Geeraerts Reference Geeraerts, Boye and Engeberg-Pederson2010, Ghyselen Reference Ghyselen, Lenz, Soukup and Koppensteiner2022, Grondelaers, Van Hout, & Van Gent Reference Grondelaers and Van Hout2016), if only because absolute uniformity, the ultimate goal of standardization, runs counter to a key role of human language, which is to convey social meaning (Grondelaers & Van Hout Reference Grondelaers and Van Hout2010:234). In any community where people have loyalties and identities that can be expressed and understood through language, linguistic variation is inevitable and enduring, even within the standard (Grondelaers et al. Reference Grondelaers, Hout and Van Gent2016:129). The crucial question, then, is how much variation is accepted within the confines of the standard language.
In the context of Dutch, Netherlandic Standard Dutch has been observed to be more tolerant towards (regional and other) variation in its spoken variant than Belgian Standard Dutch (cf. Grondelaers, Van Hout, & Speelman Reference Grondelaers and Van Hout2011, Van De Velde Reference Van De Velde1996:237).Footnote 4 Due to the extensive, mediated standardization campaign of the 1950s to 1980s in Flanders (Jaspers & Van Hoof Reference Jaspers and Van Hoof2013), Flemings adhere more rigidly to the ideal of a stable, variation-free pronunciation norm compared to the Dutch. This Flemish desire is reflected in VRT-Nederlands (‘VRT-Dutch’, Geeraerts Reference Geeraerts1998) or Journaalnederlands (‘Newscast Dutch’, Plevoets Reference Plevoets2008), a speech norm upheld by the public broadcaster VRT, modeled on the pronunciation of the Randstad elites in the 1930s (Van De Velde Reference Van De Velde1996), and codified in Blancquaert’s Practische Uitspraakleer (1934). In the recruitment process for radio and television presenters, high proficiency in an accentless “neutral” pronunciation standard is rigorously tested in a procedure supervised by the VRT’s “language adviser.”
Tussentaal, conversely, is known for its high variability, and in this capacity it is generally deemed unsuited to function as a standard language in Flanders (Goossens Reference Goossens2000, Van Damme Reference Van Damme2023). Tussentaal is typically characterized by a combination of standard and nonstandard variantsFootnote
5
and the presence of a regional accent (Rys & Taeldeman Reference Rys, Taeldeman, Sandra, Rymenans, Cuvelier and Van Petegem2007). In (1c, d) for instance, some dialectal elements are maintained (e.g. the word subiet instead of straks ‘later/soon’, or the deletion of final -t in niet ‘not’), but others are replaced by standard variants (e.g. the West-Flemish dialectal pronoun wijder for standard Dutch wij ‘we’). The proportion and type of nonstandard features (incl. the strength of the regional accent) typically varies across regions, situations, and speakers (Willemyns Reference Willemyns2005:31). Hence, tussentaal is not a uniform variety, if it can be regarded as a variety at all. If anything, tussentaal represents a repertoire of linguistic features which occupies the large middle portion of the continuum in-between the regional dialects and the (VRT) standard. Depending on how standard they want to sound, speakers shift up or down on this continuum (see e.g. Ghyselen Reference Ghyselen2016, Vandekerckhove & Nobels Reference Vandekerckhove and Nobels2010). For this reason, it is not possible to draw sharp boundaries between dialect, tussentaal, and standard language in Flanders (see Ghyselen & De Vogelaer Reference Ghyselen and De Vogelaer2018, Plevoets Reference Plevoets2008).
(1)
a.
Wij komen straks niet. [standard Dutch]
b.
Wijder komen subiet nie. [West-Flemish dialect; nonstandard variants marked in bold]
c.
Wij komen straks nie. [tussentaal with low frequency of dialect variants; nonstandard variants marked in bold]
d.
Wij komen subiet nie
. [tussentaal with higher frequency of dialect variants; nonstandard variants marked in bold]
WE COME-[3PL PRES] LATER NOT
‘We won’t be coming later’.
However, it is important to note that a number of dialect features appear in the tussentaal of almost all Flemish speakers (Ghyselen Reference Ghyselen2015, Rys & Taeldeman Reference Rys, Taeldeman, Sandra, Rymenans, Cuvelier and Van Petegem2007, Taeldeman Reference Taeldeman2008); these are typically dialect features which are endogenous in the majority of the dialects in Flanders. Some of these features are morphological, such as diminutives with the suffix -ke (bloemeke ‘little flower’). Others relate to pronunciation, like the optionality of the word-final [t] in short function words such as niet (‘not’) and dat (‘that’), as seen in examples (1c) and (1d). Additionally, there are lexical features, such as the use of the lexeme politieker instead of politicus (‘politician’) and syntactic features, including subject doubling, as in ‘k weet ek ik da nie (‘I know I I that not’) and double negation, as in ik kan nooit niet komen (‘I can never not come’). These features are so prevalent in tussentaal that they contribute to a sense of uniformity despite the repertoire’s intrinsic variability. As they have also been observed in the speech of tussentaal speakers for whom the variants are not endogenous in their local dialect, these features have been claimed to constitute the “heart” of a homogenizing tussentaal variety (Ghyselen Reference Ghyselen2015). Interestingly, it is exactly such widespread dialect features that occur in the National Day Video launched in July 2020.
Another important point to make is that tussentaal is not merely a random idiolectal mix of dialect and standard features. While it is highly variable, and cannot be conceptualized as a cluster of systematically co-occurring variants, there is an underlying structure to the variability, more specifically in the form of implicational patterning. Corpus research on the style shifting behavior of West-Flemish tussentaal speakers has for instance demonstrated that the use of certain dialect features in tussentaal (e.g. subject doubling) automatically entails the selection of other features (e.g. t-deletion), but not vice versa (Ghyselen & Van Keymeulen Reference Ghyselen and Van Keymeulen2016). This observation has led to the conclusion that tussentaal is more coherent than hitherto envisaged, in the sense that multiple linguistic variables covary systematically (see Beaman & Guy Reference Beaman and Guy2022; Guy & Hinskens Reference Guy and Hinskens2016 on the concept of coherence). As a rule, the more widespread a dialect feature is geographically, the “higher” it is on the implicational ladder. The implicational grammar of tussentaal has not been fully mapped out yet – more research is necessary to investigate phonetic, phonological, lexical, and morpho-syntactic style-shifting behavior throughout Flanders – but it seems reasonable to assume that the language used in the National Day Video does not conform to the implicational principles that govern spontaneous tussentaal use in Flanders, and that it is hence incoherent, as it combines a range of typical phonological and morphosyntactic tussentaal features, but does not have a clearly identifiable regional accent. In this context, it is relevant to mention Ghyselen & Grondelaers’ (Reference Ghyselen, Grondelaers, Beaman and Guy2022) study into the perceptual status of (in)coherence, which explored whether language users notice explicit tampering with coherence patterns. To answer that question, they designed an experiment in which native speakers of West-Flemish evaluated audio-taped clips of West-Flemish tussentaal and near-standard language on a number of scaled descriptors, a selection of which pertained to (in)coherence. Crucially, coherence violations were not revealed on the scaled measures, but on some of the open response comments. A vital question to be addressed in connection with the mixed repertoire in the clip at issue in this article is to what extent the fusion of nonstandard tussentaal features with an educated accent impacts language users’ speaker judgments, and which experimental methodology should be employed to elicit coherence judgments.
2.2. Usage in formal contexts
There is wide convergence that VRT-Dutch is not a vital lingua franca: No matter how highly regarded by the population and arduously supported by the Flemish authorities, VRT-Dutch represents an unattainable ideal which is used by a small number of speakers, in a small number of contexts (see, amongst many others, Beheydt Reference Beheydt and Stroop2003:160, Geeraerts & De Sutter Reference Geeraerts, De Sutter and Stroop2003, Goossens Reference Goossens2000:8). It has repeatedly been suggested (De Caluwe Reference De Caluwe, Fenoulhet, Gelderblom, Kristel, Lalleman, Missine and Pekelder2007, Grondelaers & Van Hout Reference Grondelaers and Van Hout2016) that VRT-Dutch is a “virtual variety” which is uniform and homogeneous exclusively by virtue of the fact that it is usually scripted and almost never produced spontaneously.
The closest vital instantiation of VRT-Dutch has been dubbed “Teacher Dutch” (Grondelaers et al. Reference Grondelaers, Hout and Van Gent2016), an educated variety produced by teachers of Dutch, who were aware that their speech was being recorded for inclusion in a standard language corpus (the Teacher Corpus of the Spoken Dutch Corpus, Oostdijk Reference Oostdijk, Peters, Collins and Cohen2002), and who could therefore be expected to make an effort to sound as standard as possible. Still, their Dutch featured perceptible regional accents (Adank, Van Hout, & Van de Velde Reference Adank, Hout and Van de Velde2007) and occasional nonstandard features such as t-deletion in function words. In terms of uniformity, this teacher Dutch occupies a compromise position between VRT-Dutch and “fully fledged” tussentaal, inasmuch as it is relevant to make such distinctions in Flanders. Prestige-wise, however, it is certainly not on a par with VRT-Dutch (see below).
In daily Flemish practice, tussentaal with a high proportion of nonstandard features is ubiquitous. Tussentaal increasingly is the L1 of ever more Flemings, not only because the local dialects are subject to dialect loss, leveling, and shift (Ghyselen & Van Keymeulen Reference Ghyselen and Van Keymeulen2014), but also because tussentaal features are encroaching on domains in which more formal varieties of Dutch used to be the evident option (De Caluwe Reference De Caluwe2009, Ghyselen et al. Reference Ghyselen, Delarue and Lybaert2016, Grondelaers & Van Hout Reference Grondelaers and Van Hout2011). These features are increasingly embraced by demographic groups that were considered to be the traditional diffusers of standard speech: while the cultural elite in Flanders held on to some form of the standard much longer than the economic elite, the youngest generation in any professional group is increasingly switching to tussentaal features (Plevoets Reference Plevoets2009).
If we go by informal observation, the combination of unaccented Dutch with tussentaal variants used in the National Day video also occurs with some frequency in radio and television commercials, as well as on popular VRT radio channels such as Radio 2 (broad mainstream), MNM (youth-oriented, with a focus on contemporary chart music), and Studio Brussel (which similarly targets a younger audience, albeit with a stronger emphasis on alternative music and cultural content). A quick YouTube search reveals several commercials which feature a near-standard accent and (some) tussentaal traits; cases in point are the Vlaanderen Vakantieland videos of June 5Footnote 6 and July 6,Footnote 7 2020 which (re)invited Flemings to Flanders’ touristic highlights following the first wave of the pandemic – the first featuring noticeable t-deletion in function words, the second exclusive ge- instead of je- pronominal reference – the VLAIO commercial (Flanders Innovation & Entrepreneurship) of August 6, 2018Footnote 8 – again with t-deletion – and the September 30, 2019Footnote 9 commercial issued by Bakkers Vlaanderen (the professional federation of artisan bakers in Flanders), which contains exclusive ge-use. All these commercials target a nationwide variety of Dutch with no or only minimal regional flavoring and some prototypical tussentaal shibboleths to narrow the distance with the target audience. The mixing of unaccented Dutch with (some) tussentaal features appears to be absent on Radio 1, the VRT’s information-oriented radio channel, and Klara, the VRT’s cultural radio channel with a primary focus on classical music. In the absence of a systematic corpus analysis, these observations should be interpreted with caution; however, they tentatively suggest that the broadcaster selectively relaxes standard language norms in contexts where a degree of proximity to the audience is desirable, pointing to a functional rather than fully consistent orientation towards standard language use. More generally, unaccented Dutch with some tussentaal features appears to be characteristic of monitored genres – commercials and some radio contexts – that require a degree of informality and audience proximity.
2.3. Prestige and ideology
Standard languages are typically associated with overt prestige, reflected in evaluations of intelligence, education, competence, and socioeconomic status. Reviews of language attitudes in present-day European communities (like Kristiansen & Grondelaers Reference Kristiansen and Grondelaers2013) have shown that official standard varieties continue to enjoy broad public support and esteem, even as they come under increasing pressure, whereas competing nonstandard varieties are systematically rejected in formal contexts and attract markedly lower overt prestige. To account for the apparent paradox that the increasing popularity and diffusion of nonstandard varieties do not seem to be correlated with their regard, Kristiansen (Reference Kristiansen2009) proposed a “double standard” scenario involving two ideologies to account for the increasing co-variation of standard and nonstandard features in European standard languages. In his experimental studies of language dynamics in Danish, Kristiansen (Reference Kristiansen2009) originally found no prestige correlation for the unstoppable diffusion of the working-class Kobenhavensk ‘Low Copenhagen’ accent. In a label-ranking task, which extracted evaluations in answer to the task “order the labels of the following varieties in terms of your own preference,” Kobenhavensk was invariably ranked lower than Rigsdansk, the official standard and only prestige variety in Denmark. From this hierarchization, Kristiansen concluded that his label-ranking task had replicated the conservative standard language ideology which fuels public thinking and overt discourses about standard language. But Kristiansen also found evidence for an allegedly more covert (counter-) ideology. In a speaker evaluation experiment (Lambert et al. Reference Lambert, Hodgson, Gardner and Fillenbaum1960), in which listener-judges evaluated unlabeled speech clips on descriptors pertaining to speaker personality, Kristiansen found that Kobenhavensk but not Rigsdansk was upgraded on descriptors such as self-assured, fascinating, and cool. This “modern” prestige boost, which was argued to motor the vitality of Kobenhavensk in spite of its official rejection, was argued to reveal a deeper value system, which hierarchizes varieties in terms of dynamic media prestige.
For Kristiansen (Reference Kristiansen2009), language evaluation (viz. prestige) is the sole criterion for standardness; building on the conservative and modern evaluations he found, Kristiansen (Reference Kristiansen2001) refers to Denmark as a double standard situation, with conservative Rigsdansk as the standard for the schools, and the dynamic Kobenhavensk variety as the standard for the media. Dynamic standards like Kobenhavensk have also been dubbed “neo-standard” in the literature, viz. “ways of speaking characterized both by supra-regionality (even globalization) and informality” (Auer Reference Auer and Stickel2018:37). Neo-standards have been attested in Italy (Berruto Reference Berruto1987) and Germany (Auer & Spiekermann Reference Auer, Spiekermann, Kristiansen and Coupland2011); in Flanders, tussentaal has also been analyzed as a neo-standard (given its attested dynamic prestige) though it is termed an “emergent standard” in Grondelaers et al. (Reference Grondelaers, Hout and Van Gent2016).
In view of this dynamic prestige for tussentaal, there is some evidence for the validity of the “Kristiansen schema” – overt positivity for the conservative standard, overt negativity but covert positivity for competing nonstandard varieties – as an ideological model for Belgian Dutch. In speaker evaluation experiments, VRT-Dutch is invariably hailed as the only superior variety (Ghyselen & De Vogelaer Reference Ghyselen, De Vogelaer, Grondelaers and Kristiansen2013, Impe & Speelman Reference Impe and Speelman2007, Vandekerckhove & Cuvelier Reference Vandekerckhove, Cuvelier, Cuvelier, du Plessis, Meeuwis and Teck2007), while tussentaal features are upgraded on dynamic prestige (Grondelaers & Speelman Reference Grondelaers, Speelman, Kristiansen and Grondelaers2013, Rosseel Reference Rosseel2017).Footnote 10
Yet other findings suggest that standard language dynamics in Flanders diverge from the Kristiansen schema, in the sense that they show neither univocal endorsement for VRT-Dutch, nor outright rejection of tussentaal. Two qualitative investigations, to begin with, reveal more critical discourses about conservative VRT-Dutch, but also a more nuanced view on tussentaal. In her ethnographic analysis of language practices and ideologies in a Flemish secondary school, Van Lancker (Reference Van Lancker2016) found a powerful conservative ideology (which transpired from an unexpected appreciation of “beautiful Dutch” and a tendency among the students to downgrade their own speech as “extremely unsophisticated”) alongside explicit anti-norm attitudes. In her interviews with 80 highly educated Flemings, Lybaert (Reference Lybaert2017) found that genuine Standard Dutch was deemed “perfect,” but also “almost never spoken,” and therefore “difficult to achieve.” Lybaert also attested moderately positive evaluations of tussentaal as “normal,” as well as some dynamic prestige associations.
These qualitative observations are empirically confirmed in a number of recent experimental studies. Grondelaers et al. (Reference Grondelaers, Speelman, Lybaert and Van Gent2020) asked younger and older Flemish respondents to return the first three adjectives that came to mind in response to the labels of a number of Flemish language varieties. To the label “Dutch as spoken in the VRT news,” younger and older Flemings responded remarkably similarly: The most frequent adjectives returned by both groups were “beautiful,” “correct,” “intelligible,” and “clear,” in that same order (2020:8). Among older Flemish people, those adjectives formed the statistically dominant core of a stable pro-VRT-Dutch attitude; among younger people, however, these adjectives were proportionally much less important, and negative evaluations such as “standoffish,” “posh,” “manufactured,” “stiff”, and “arid” played a statistically larger role. Moreover, separate cluster analyses on the younger and older evaluations showed that older informants distinguished VRT-Dutch as the sole standard variety from all other varieties, while younger respondents conceptualized VRT-Dutch and tussentaal as one standard cluster distinguished from all other nonstandard varieties.
Zenner et al. (Reference Zenner, Grondelaers, Rosseel, Speelman, Esselinckx and Rombouts2021) reported a speaker evaluation experiment designed to collect language attitudes in a speech therapy context, a profession which comes with high standard language associations in Flanders. Two groups of respondents (either majoring in speech therapy or other fields) rated standard and tussentaal guises of therapist speech on two brands of professional competence, viz. traditional, as elicited on traits like intelligent, capable, experienced, and modern, as elicited on enthusiastic, funny, relaxed, and gentle. Attitudes were collected vis-à-vis language use in the relational small-talk preamble to therapy, and in the therapeutic transaction itself. Zenner et al. (Reference Zenner, Grondelaers, Rosseel, Speelman, Esselinckx and Rombouts2021) found that standard language was penalized in terms of modern professional competence when used in a relational context. More crucially, however, tussentaal did not generate lower traditional competence ratings than standard language in either the relational or transactional context.
To our knowledge, Zenner et al.’s (Reference Zenner, Grondelaers, Rosseel, Speelman, Esselinckx and Rombouts2021) evidence is the first that reveals positive traditional superiority evaluations of tussentaal. While the recency of this success might index standard ideology change, a methodological factor that could (also) account for the comparatively milder tussentaal evaluations is the increasingly popular methodological choice to contextualize attitude elicitation. In contrast to a lot of older experimental work, which relied on abstract in vitro elicitation in response to nonsense stimuli (Vandekerckhove & Cuvelier Reference Vandekerckhove, Cuvelier, Cuvelier, du Plessis, Meeuwis and Teck2007 is a notable exception), recent investigations like Zenner et al. (Reference Zenner, Grondelaers, Rosseel, Speelman, Esselinckx and Rombouts2021) and Lybaert, Van Hoof, & Deygers (Reference Lybaert, Hoof and Deygers2022) situate experimental stimulus speech in specific professional contexts, respectively speech therapy and education. In this capacity, they extract in situ judgments (Lybaert et al. Reference Lybaert, Hoof and Deygers2022:13), which are arguably more valid than decontextualized abstract ratings. While Lybaert et al. (Reference Lybaert, Hoof and Deygers2022) found that Standard Dutch was evaluated as more correct, beautiful, and well-groomed than tussentaal, their study – again – did not reveal any negative effects of tussentaal on the teacher’s didactic competence or prestige evaluations. As in Zenner et al. (Reference Zenner, Grondelaers, Rosseel, Speelman, Esselinckx and Rombouts2021), this conclusion is surprising in view of the symbolic value of Standard Dutch in educational contexts.
2.4. Codification
A strange observation in light of the virulence of the Flemish standard language debate is that no policy document, to our knowledge, has ever proposed a concrete model for spoken standard speech in the public domain. In their vision texts, former ministers of education Frank Vandenbroucke (Reference Vandenbroucke2007) and Pascal Smet (Reference Smet2009) do not literally refer to VRT-Dutch as the practical norm (see above), but their postulations that the intended language repertoire should be “correct,” “non-tussentaal,” and “nonregional” arguably approximates this ideal. However, informal conversations with the VRT language adviser, educational policymakers, and language teachers suggest that these experts do not consider the accentless VRT norm to be an attainable goal for public usage, particularly with regard to the requirement of nonregional pronunciation; yet, this nuance is rarely made explicit.
The final attainment targets formulated in secondary school curricula are not helpful either when it comes to determining the exact nature of the spoken standard envisaged by the authorities (see especially de Schryver Reference De Schryver2015). These targets invariably emphasize the need to reflect on language norms, but they never define what a norm actually is; neither do they show students how to interpret or define the concept of standard language. The latest version of the attainment targets issued by the Flemish educational authority which became available in 2019 (see onderwijsdoelen.be) is equally unspecific with respect to the exact nature of the envisaged standard. The only secondary school targets for the subject Dutch which mention Standaardnederlands (‘Standard Dutch’) (targets 2.9 and 2.10) do not provide any definition. Neither does the extended target (‘Uitbreidingsdoel’) UD 2.10, which reads De leerlingen analyseren het Standaardnederlands als taalsysteem (‘Students analyze Standard Dutch as a linguistic system’).
Given this absence of concrete criteria for a practical spoken standard, some linguists have turned to the national broadcast media as a referee for standard Dutch. Van de Velde et al. (Reference Van de Velde, Hout and Gerritsen1997:363) argue that there is
a fascinating interplay between radio language on the national broadcasting stations and standard language, in which the audience defines the standard (Milroy & Milroy Reference Milroy and Milroy1985). Broadcasters accommodate to the standard, but this does not mean that their usage coincides exactly with the abstract standard. Small deviations are evident. If according to the listeners, who consider the speech of broadcasters as representative of the standard, these deviations fall outside the range of variation tolerated within the standard, they will react in an attempt to redefine the standard.
In Grondelaers et al. (Reference Grondelaers, Hout and Van Gent2016:139), broadcast media acceptance is regarded as a practical proxy to determine the contours of an attainable spoken real-world standard. Still, there is a caveat, in the sense that radio practice and media policy do not always align. Grondelaers (Reference Grondelaers2019) invited the VRT to adapt its language policy to its current language practice, viz. to allow some regional and ethnic accent variation and some informal variants in programs intended for young people. This proposal was forcefully rejected in print and social media (see Vandenbussche Reference Vandenbussche2019 for a summary) and the ensuing fracas even led to a parliamentary question. What, it was asked, was the VRT planning to do about this attack on VRT-Dutch? And why, the member of parliament continued, should the exact status and delineation of VRT-Dutch be an issue at all, when both are determined by the government? Isn’t it the case that the VRT is contractually obliged to broadcast in Standard Dutch, and isn’t it perfectly clear what Standard Dutch is, or should be?
In light of the vagueness and controversy surrounding the exact nature of spoken Standard Dutch in Flanders, the speech that the Flemish government uses in its own communication is an evident exemplification of what Standard Dutch as a practical lingua franca could look like. The nature of the speech in the National Day video crucially suggests that tussentaal features are not de facto excluded, and that a well-groomed accent is in fact a much more important ingredient. In this article, we put these inferences to the test.
3. Research questions
We report on a contextualized speaker evaluation experiment designed to address our overarching research question: What is the standard status of the mixed Dutch in the National Day video message issued by the Flemish government? Against the backdrop of the existing groundwork, this general aim can be subdivided in two sets of specific, testable subquestions:
-
1. How perceptually coherent is speech which fuses a standard accent and nonstandard tussentaal features? Can we extract (in)coherence evaluations on the scaled measures, or do we need unconstrained free responses to detect them?
-
2. What is the prestige status of mixed speech which fuses a standard accent and nonstandard tussentaal features?
-
a. Does the Kristiansen scheme apply, to the extent that the tussentaal features invite dynamic prestige elicitations, but kill the perceived superiority of the speech?
-
b. Which is the strongest evaluation trigger, the tussentaal features or the regional accent?
-
c. Are tussentaal features intrinsically negative, or are the (negative) correlates of tussentaal (nonstandard, uneducated, renegade) counterbalanced by a groomed accent?
-
The answer to RQ’s 1 and 2 will help us formulate a response to the more general language-political question whether mixed speech which fuses a standard accent and nonstandard tussentaal features could be a viable spoken Belgian standard. In view of the fact that the Flemish authorities suggest that the latter is the case in their own use of mixed speech, which definitional features can we infer for vital, practical standards, and in which genres can we expect it to flourish?
4. Method
4.1. Experimental rationale
To answer our research questions, we designed a contextualized speaker evaluation experiment that elicited both scaled and open responses. Participants were presented with the National Day video, featuring its original script, in different speech guises produced by two educated speakers. In this way, Flemish respondents were immersed in a form of governmental communication familiar from television and online media. Ecological validity was further enhanced by framing the experimental task as a quest for suitable spokespersons.
Extracting evaluations through both scaled measures and open responses serves two complementary purposes. The inclusion of scaled measures allows us to target specific evaluative dimensions that may not yet be fully articulated in respondents’ spontaneous evaluative repertoires, and to capture more implicit or “deeper” attitudinal patterns in a systematic and comparable way (Rosseel & Grondelaers Reference Rosseel and Grondelaers2019). At the same time, the inclusion of open response fields enables us to access evaluative dimensions that may fall outside predefined categories, including potential (in)coherence effects (cf. Ghyselen & Grondelaers Reference Ghyselen, Grondelaers, Beaman and Guy2022). The availability of open responses also accommodates recurrent critiques of the speaker evaluation paradigm: The selection of rating scales has been questioned since Lee (Reference Lee1971), who argued that it “lacked empirical motivation and construct validity” (p. 413; but see Giles & Bourhis Reference Giles and Bourhis1973 for a rebuttal), and subsequent work has pointed to the risk of circularity and a “deceptive semblance of exhaustiveness” when scales are repeatedly adopted from a limited set of earlier studies (Garrett Reference Garrett, Ulrich, Dittmar, Mattheier and Trudgill2005:1256). By complementing scaled measures with open response formats, we explicitly address these concerns and allow respondents to articulate evaluations that may not be captured by standard descriptors.
4.2. Stimuli
We used the original video, but not the audio of the National Day message;Footnote 11 its speech was manipulated in a full factorial design with two variables: (1) presence or absence of a regional accent and (2) presence and absence of tussentaal features. In imitation of the original speech of the National Day message, we used an Antwerp accent which was somewhat broader than the original actor’s; this was done in function of a balanced manipulation with a more comparable impact of the predictors accent and tussentaal features. All tokens of the tussentaal features in the original message’s speech were copied in our manipulations (a full version and translation of the script, in which the tussentaal features are highlighted, is made available in Appendix A). There were 21 tokens of phonological tussentaal-features,Footnote 12 notably eight instances of final t-apocope (in dat ‘that’, niet ‘not’, wat ‘what’, met ‘with’, and goed ‘good’), one instance in which final /t/ was realized as [d] (in wat ‘what’), two reductions of maar ‘but’ to [ma], six instances of h-aphaeresis (in hebben ‘to have’, helaas ‘alas’, hand ‘hand’, hoekske ‘small corner’, and anderhalve ‘one and a half’), two instances of cliticization (in z’ebben ‘they have’ and w’in ‘we in’), and two instances of syncope in als ‘if’, pronounced as [as]. Additionally, the video contained 15 tokens of morphological tussentaal-features, viz. one nonstandard diminutive -ske and six nonstandard forms of definite and indefinite articles (notably nen, ne, and e for standard Dutch (SD) een ‘a’ and den for SD de ‘the’) as well as eight nonstandard forms for demonstratives and personal pronouns, notably dieje for SD die ‘that’, ge for SD je ‘you’, uw(e) for SD je/jouw ‘your’, and ons instead of SD onze ‘our’. The video also contained a nonstandard interjection (zuh).
In function of the accentless guises, we recruited experimental speakers with a background in either public broadcasting or speech therapy, arguably the professions with the highest standard language expectation in Flanders (Zenner et al. Reference Zenner, Grondelaers, Rosseel, Speelman, Esselinckx and Rombouts2021). Stimuli were recorded by candidate speakers who were all female – for reasons of comparability with earlier studies on (in)coherence (notably Ghyselen & Grondelaers Reference Ghyselen, Grondelaers, Beaman and Guy2022).
Two identical pre-experiments were conducted to investigate the effectiveness of our manipulations, and to determine whether experimental speakers were sufficiently similar. In the first check, 17 participants (4 male, 13 female; 9 majoring or having majored in language studies) were asked to determine the regional origin of the speech in the guises (on a drop-down menu with the five provinces of Flanders), to determine its strength (on a 7-point scale), to estimate the age of the speakers, and to evaluate them in terms of agreeability and fluency (7-point items). In addition, participants were asked to write down five words from the stimulus which, in their opinion, betrayed the regional origin of the speaker.
The first check featured three VRT radio broadcasters, but failed since two of these speakers were found to be incapable of producing regionally accented guises without colloquialisms or, conversely, tussentaal guises in a polished neutral accent; this inability to credibly produce the mixed guises is, in itself, a production reflection of incoherence. A similarly designed second check with 22 participants featured the one speaker retained from the previous check, and a new speaker who trained as a speech therapist. This time both speakers differed significantly across the four guises: They were unrecognizable in their accentless guises but regionally well-identifiable in their accented guises. In addition, they received similar accent strength scores and age estimations, as well as comparable agreeability and fluency scores. Speaker A (°1995) originates from a small town in the north-east of the province of Antwerp; she trained as a speech therapist and is a researcher in linguistics. Speaker B (°1988) originates from the south-west of the province of Antwerp, and is a public broadcaster. A filler stimulus, inserted prior to the critical materials in order to familiarize participants with the experimental setup, was recorded by the second author of this article, who produced the unaccented guise without tussentaal features in near-standard Belgian Dutch.
The speech in the five guises was subsequently synchronized with the video content of the National Day message in order to obtain stimuli which were maximally comparable to the original post.
4.3. Measures
Scaled evaluations were extracted on 16 Likert statements (seven-point response scales with Dutch translations of “don’t agree at all” as negative and “very much agree” as positive poles) included in function of four dimensions: superiority (this speaker sounds [the Dutch equivalent of] highly educated, competent, wealthy, sophisticated), dynamism (this speaker sounds charismatic, popular, energetic, contemporary), integrity (this speaker sounds kind, reliable, convivial, empathetic), and artificiality (this person sounds artificial, unnatural, contrived, rehearsed). The scales were limited to four per dimension in order to reduce the duration of the experiment and they were largely based on previous research (e.g. Ghyselen & Grondelaers Reference Ghyselen, Grondelaers, Beaman and Guy2022, Grondelaers & Speelman Reference Grondelaers, Speelman, Kristiansen and Grondelaers2013); scales included in function of dynamism, however, were updated since adjectives such as cool and hip were no longer felt to convey sufficient cool connotations.
In addition to the scaled measures, we also elicited unconstrained free responses: Participants were asked to return the first three adjectives that came to mind when listening to a guise. Since judgments about the violation of implicational scales have so far only been found in free response data, these qualitative data are expected to be useful for the research question concerning coherence.
Following the evaluation of the stimuli, we elicited from all participants the province they had grown up in (drop-down menu with the Dutch names of the five Flemish provinces and Brussels Metropolitan Region), their age (as a figure), their gender (drop-down menu with “male,” “female,” “nonbinary,” and “I’d rather not say”), their level of proficiency in a regional dialect (five-point scale from “none” to “full”), and their level of education (drop-down menu with “primary,” “secondary,” “higher vocational training/university college,” and “university”). We then asked participants – on an open response field – to report their study major when they believed it pertained to language “(language and literature, language teacher training, speech therapy, translation, interpreting …)”, and we requested that they would also provide their major if they doubted it had anything to do with language. Finally, we asked participants on an open response debriefing item what they believed the actual goal of the experiment was.
4.4. Participants
Participants were recruited through convenience sampling and snowballing, but care was taken from the outset to include both younger and older participants. The survey was targeted towards highly educated native speakers of Belgian Dutch to allow for comparability with previous work (Ghyselen & Grondelaers Reference Ghyselen, Grondelaers, Beaman and Guy2022; Grondelaers & Speelman Reference Grondelaers, Speelman, Kristiansen and Grondelaers2013). Crucially, we limited the survey to participants who were linguistically naïve, in the sense that they did not major in language-related studies; this was done to exclude participants with meta-ideological evaluations shaped by prior academic training from this first phase of a multi-stage research project (a follow-up study is currently focusing on evaluations by language professionals; see below).
From the initial sample, we removed three participants who had not completed their secondary education by the time of the experiment, and one person younger than 14. We also excluded 35 participants whose field of study was ultimately determined to be language-related contrary to what they had reported themselves (i.e. involving language prescription or ideology). Seven persons who did not (wish to) identify as either male or female, and 38 participants who reported that Dutch was not their (only) L1 were removed because their number did not enable us to include them as viable variable levels in the statistical analysis. The remaining 614 participants were categorized post hoc in three age groups: 18–24 (n = 225; M = 21.73), 25–53 (n = 230; M = 43.75), and 54–84 (n = 159; M = 62.43). A total of 380 participants were female, 234 male. A total of 340 participants came from the “central” region of Antwerp, Flemish Brabant, and Brussels, 137 from Limburg, 60 from East-Flanders, and 77 from West Flanders. A total of 80 had completed or were completing secondary education, 248 had a university college degree, and 286 a university degree.
4.5. Procedure and tasks
The experiment was designed as a Qualtrics survey, which was distributed through the social networks of ten student assistants, all majoring in general linguistics and enrolled in the University of Leuven course “Taalkundige Enquêtering en Experiment,” taught by the first author in the fall of 2022; in this course, students were taught to use convenience sampling and snowballing via social media in order to attain large but stratified respondent samples. Participation in the experiment was voluntary (without remuneration) and proceeded via the participants’ own devices at home.
All participants were given the following general instruction (translated from the Dutch original):
We are looking for a suitable speaker to record an informational video by the Flemish Government. We will play you recordings of three potential candidates. Make sure you have headphones or earphones at hand and are in a quiet surrounding. The visual content of the video is identical for all candidates, so do not pay attention to it: just assess the speakers.
After giving their consent to be included in the experiment, and allowing us to use their data for scientific research, all participants were shown the filler condition of the National Day clip to familiarize themselves with the experimental set-up. Following this filler, each participant was presented with two critical stimuli in a between-subject design. Presentation was programmed to ensure that no respondent evaluated the same speaker or the same condition twice; critical stimuli were presented in different orders to avoid context effects.
The sequence of the experiment was as follows. The filler stimulus was followed, on the same screen, by the following instruction (translated from the Dutch original):
Fill in as quickly as possible the first three adjectives that spring to mind as you listen to the speaker. In an earlier experiment, someone filled in nice, smart and stiff for this speaker – but it goes without saying that you don’t have to use these particular adjectives (we’re interested in your own impressions).
Following the initial filler task, participants were presented with the first critical stimulus; this stimulus was followed either by a free response evaluation or by scaled evaluation measures, depending on the condition. The second critical stimulus was always followed by scaled evaluation measures only. This design choice was made to prevent participants who had already been exposed to the rating scales from reproducing scale-based descriptors in subsequent free responses. Accordingly, two presentation orders were implemented: (i) stimulus 1 followed by scaled evaluations, and stimulus 2 followed by scaled evaluations; and (ii) stimulus 1 followed by free responses, and stimulus 2 followed by scaled evaluations. The reverse order (i.e. stimulus 1 followed by scaled evaluations and stimulus 2 followed by free responses) was not used. The presentation software was programmed to ensure that we obtained comparable amounts of both scaled measures and unconstrained evaluations for each speaker across the four conditions.
5. Results
In what follows, we first report the results for the scaled responses, after which we explore parallels and discrepancies with the free response answers.
5.1. Scaled responses
As discussed in section 4, the scaled measures were selected in function of four attitudinal dimensions: superiority, dynamism, integrity, and artificiality. To verify the underlying factor structure of the scales, we conducted a maximum-likelihood factor analysis with Promax rotation in R (R Core Team 2022). In a preparatory phase, the Kaiser-Meyer-Olkin measure confirmed the sampling adequacy for the analysis (KMO = 0.92), and Bartlett’s test of sphericity was significant (χ2(120) = 10268.59, p < .001), indicating that correlations between items were sufficiently large for factor analysis. The subsequent factor analysis suggests that a three-factor-solution (rather than the anticipated four-dimensional approach) is optimal for our data, as evidenced by three factors with eigenvalues greater than 1, and the scree plot showing an elbow at the third factor. These three factors collectively explain 61 percent of the original variance. Additionally, Cronbach’s alpha for each factor exceeds 0.8, demonstrating good internal consistency. The scales sophisticated, popular, contemporary, and charismatic were excluded from the final factor solution due to high uniqueness scores (>0.6) for the first three scales, and cross-loadings on multiple factors with low loading values (<0.45) for the last two scales. Factor loadings for the remaining scales are summarized in table 1. The loadings support the existence of distinct artificiality and superiority dimensions. However, the scales targeting solidarity and dynamism load identically, which suggests that these concepts are not distinct in our sample; they were therefore combined into a single dimension that will henceforward be dubbed “DynaSolidarity”. Factor scores for the three resulting dimensions were calculated by summing the standardizedFootnote 13 scores of all items loading higher than 0.4 on the specific factor (indicated in bold in table 1) and dividing the result by the number of items.
Factor loadings for the scaled measures

Table 1 Long description
A table with three columns and twelve rows. The columns are labeled Factor 1 [artificiality], Factor 2 [superiority], and Factor 3 [DynaSolidarity]. The rows are labeled with different attributes: Artificial, Contrived, Unnatural, Rehearsed, Competent, Well-off, Trustworthy, Highly educated, Friendly, Energetic, Sociable, and Empathic. Each cell contains a numerical value representing the factor loading for the corresponding attribute and factor. Notable values include high loadings for Artificial, Contrived, and Unnatural under Factor 1, and high loadings for Competent, Well-off, and Highly educated under Factor 2. Factor 3 shows high loadings for Friendly, Energetic, Sociable, and Empathic.
Loadings with an absolute value <0.1 are not printed; high loadings (>0.4) are marked in bold.
Subsequently, mixed-effects linear regression analyses were conducted on each of the three variables to examine the impact of the following fixed predictors:
-
a. Guise ([−Acc(ent)−TT, short for “tussentaal”] (= reference level), [+Acc−TT], [−Acc+TT], [+Acc+TT]);
-
b. Speaker (speaker A (= reference level), speaker B);
-
c. Regional background of the respondent (Central (= reference level), East Flanders, Limburg, West Flanders);
-
d. Respondent’s gender (female (= reference level), male);
-
e. Respondent’s age group (18–24 years old (= reference level), 25–53 years old, 54–84 years old);
-
f. Respondent’s education (college (= reference level), university college, secondary education);
-
g. Respondent’s debriefing outcome (no or incorrect understanding of the experiment (= reference level), recognition that the experiment is about some aspect of language variation, recognition that it concerns the ideological correlates of standard language variation).
All predictors were treated as factors and entered using the default treatment (dummy) coding in R, with the first level of each factor serving as the reference category.
For predictors b to g, their interactions with predictor a (guise) were included in the model to investigate how these factors impact the perception of mixed speech combining a standard accent with nonstandard tussentaal features compared to other types of speech. Additionally, a random intercept for “respondent” was added to each model. Post-hoc analyses of the Variance Inflation Factor (VIF) scores for each predictor indicated that multicollinearity was not at stake in any of the models reported here.
Superiority
The regression model for superiority shows statistically significant effects of speaker, guise, the respondents’ educational level, gender, and their awareness of the experimental goal on the final debriefing (see Appendix B for the full model summary).Footnote 14 The respondents’ age and regional descendance, however, do not significantly affect superiority perceptions. The speaker effect is straightforward: speaker B generally scores better than speaker A on superiority, irrespective of guise (estimate: 0.387, p < 0.001). The effects of gender, awareness at debriefing and education however only emerge in interaction with the effect of guise (see figure 1a–c).
Plot of linear mixed effects regression of guise and (a) respondents’ gender, (b) respondents’ awareness of the experimental goal at debriefing, and (c) respondents’ educational level on superiority scores.

Figure 1 Long description
Panel A: A line graph shows the relationship between guise and respondents’ gender. The x-axis represents guise with categories -Acc-TT, +Acc-TT, -Acc+TT, and +Acc+TT. The y-axis represents predicted values. The graph includes two lines, one for female respondents in red and one for male respondents in blue. Both lines show a similar trend, with predicted values starting high, dipping in the middle, and rising again at the end. Panel B: A line graph illustrates the relationship between guise and respondents’ awareness of the experimental goal at debriefing. The x-axis represents guise with the same categories as Panel A. The y-axis represents predicted values. The graph includes three lines: red for no or wrong idea, green for language variation, and blue for ideological implications of language variation. All lines follow a similar pattern, starting high, dipping in the middle, and rising again at the end. Panel C: A line graph depicts the relationship between guise and respondents’ educational level. The x-axis represents guise with the same categories as the previous panels. The y-axis represents predicted values. The graph includes three lines: red for university education, green for university college education, and blue for secondary education. All lines show a similar trend, starting high, dipping in the middle, and rising again at the end.
In line with previous research, our data indicate that the VRT-Dutch guise ([−Acc,−TT)] is consistently rated as more superior than the other guises. However, speech that combines a standard accent with nonstandard tussentaal features ([−Acc+TT] is not completely downgraded in superiority terms. While the stimuli with a regional accent – [+Acc−TT] and [+Acc+TT] – get negative superiority scores across the board, the predicted values for the [−Acc+TT] guise always exceed the 0-baseline, except for respondents who are fully aware of our research goal at debriefing. Interestingly, respondents who were unaware of the experimental goal rated the [−Acc+TT] fragment significantly more favourably. Gender and education had no effect on the perception of the “mixed” stimuli, but did impact the superiority ratings of “fully fledged” tussentaal ([+Acc+TT]). Specifically, women and participants without a college or university degree rated “fully fledged” tussentaal as significantly more superior.
DynaSolidarity
For the DynaSolidarity dimension, the regression model shows statistically significant effects of speaker, guise, age group and region (cf. Appendix C for the full model report).Footnote 15 Similar to the superiority dimension, speaker B is rated more favourably than speaker A throughout, independent of guise (estimate: 0.204, p = 0.027). The effects of age group and region interact with the effect of guise (see figure 2).
Plot of linear mixed effects regression of guise and (a) respondents’ region and (b) respondents’ age group on DynaSolidarity scores.

Consistent with our expectations, VRT-Dutch ([−Acc−TT]) scores lower on this dimension than on superiority, but opinions on the DynaSolidarity of VRT-Dutch relative to other guises vary significantly by participants’ regional background. With respect to regional background, West Flemish participants rate VRT-Dutch significantly higher than respondents from the central (Brabantic) or Limburgian area. Central (Brabantic) respondents prefer the [−Acc+TT] stimuli over the VRT-Dutch ones on this dimension, while respondents from other areas show no significant differences between these two guises. For the regionally accented guises, all groups rate the [+Acc−TT] stimuli lower than the nonaccented ones, but opinions on the [+Acc+TT] fragments vary: respondents from the central Brabantic area do not rate them lower in terms of DynaSolidarity than VRT-Dutch, whereas all other groups do.
Age-wise, opinions on VRT-Dutch and the accented fragments vary considerably: the oldest age group (54–84 years old) rates VRT-Dutch significantly higher than the other two age groups in terms of DynaSolidarity, and the accented fragments significantly lower than the other groups. Crucially, the fused [−Acc+TT] fragments are rated on a par with VRT-Dutch by the oldest participants, while the younger respondents prefer them to VRT-Dutch.
Artificiality
To check whether speech fusing a standard accent and nonstandard tussentaal features is perceptually (in)coherent, we asked respondent to assess the perceived artificiality of the audio stimuli on four scales. Regression analysis suggests that the artificiality of the different guises depends on both the speaker and the age of the respondent (cf. appendix D and figure 3a, b).Footnote 16
Plot of linear mixed effects of guise and (a) respondents’ age group and (b) speaker on artificiality scores.

Which fragment is deemed most artificial strongly depends on the speaker performing it. For instance, Speaker A’s accentless guises (both [−Acc−TT] and [−Acc+TT]) are considered significantly more artificial than her stimuli with a regional accent, with the fully fledged tussentaal ([+Acc+TT]) being deemed the least artificial. Interestingly, both accentless guises are deemed equally artificial; the guise mixing a nonregional accent with tussentaal-features does not elicit stronger perceptions of artificiality. This suggests that it is speaker A’s inclination to get rid of a regional accent which is deemed artificial, rather than the combination of tussentaal features with a regionally neutral accent. For speaker B, the differences between guises are smaller, with the only significant difference being that her [+Acc−TT] guise is perceived as more artificial than the two guises containing tussentaal features ([−Acc+TT] and [+Acc+TT]). On the scaled measures, as a consequence, there is little evidence for the perceptual incoherence of the combination [−Acc+TT].
Artificiality judgments are also age-dependent. For the youngest age group (18–24 years old; “Age1”), the more standard the speech is, the more artificial it is deemed to be, with accentless guises being rated the highest in artificiality: [−Acc−TT] > [−Acc+TT] > [+Acc−TT] > [+Acc+TT]. Conversely, for the oldest age group (54–84 years old, “Age3”), it is the accented guises that are judged to be the most artificial, with [+Acc−TT] being significantly more artificial than [−Acc−TT] and [−Acc+TT]. For the middle age group (25–53 years old, “Age2”) the only significant difference observed is that fully fledged tussentaal (+Acc+TT) is deemed less artificial compared to the accentless guises (both [−Acc−TT] and [−Acc+TT]). In summary, the younger the participant, the more artificial VRT-Dutch is perceived to be, and the more natural accented guises are found. For the [−Acc+TT] guise, no significant differences are observed based on age.
All in all, the scaled data reveal no clear perceptions of incoherence for the fusion of a regionally neutral accent with tussentaal features. Also, while the data affirm the continued prestige of VRT-Dutch as a superiority norm, the guises combining a neutral accent with tussentaal features are not downgraded – suggesting their potential viability as an acceptable alternative. Interestingly, in terms of DynaSolidarity, the [−Acc+TT]-guises are upgraded, especially among younger and Brabantic participants, who prefer this combination to VRT-Dutch. The scaled findings demonstrate, in other words, that speech fusing [−Acc] and [+TT] can simultaneously evoke associations of superiority and DynaSolidarity.
Still, the scaled responses do not tell us the whole story. Recall, to begin with, that while scaled measures did not return artificiality evaluations for the incoherent dialect samples in Ghyselen & Grondelaers (Reference Ghyselen, Grondelaers, Beaman and Guy2022), the open response evaluations clearly did; we cannot exclude that in this case also, open responses might reveal artificiality evaluations the closed scales do not. Neither can we exclude that the open response tool reveals other dimensions of evaluation not exposed by the closed response format. In addition, unprompted open responses allow us to put interpretative flesh on the bare skeleton of the scaled responses, because they access overlapping, but possibly different cognitive structures. A predefined labeled scale primarily requires recognizing a dimension and evaluating the investigated phenomenon in function of it. This process is cognitively less demanding than the unprompted recall required for open-ended questions which do not point the way to the dimension in function of which to evaluate, but require unsupervised retrieval of information from memory. The latter is arguably more susceptible to interference from the respondents’ beliefs and attitudes, which may plausibly lead to the activation of (more) conservative value systems and – hence – more contrastive prestige distributions (see especially Tourangeau, Rips, & Rasinski Reference Tourangeau, Rips and Rasinski2000).
5.2. Free responses
A total of 411 free response types were manually classified into semantic categories on the basis of conceptual similarity. To avoid classificatory bias, responses were categorized independently of the stimuli in return to which they were prompted by the respondents. The procedure was bottom-up to the extent that we targeted semantically homogeneous classes independently of the evaluation dimensions (superiority, dynamism, integrity, artificiality) in function of which we had sourced the scaled measures discussed in 5.1. The procedure was also cyclical, as both authors first identified semantic groups independently, and subsequently collaborated on a uniform classification procedure and on classifying difficult and doubtful cases. The 11 semantic categories that resulted from this discussion can be found in table 2.
Semantic categories (and their type and token frequencies) in free response replies

Table 2 Long description
A table categorizing semantic categories with their type and token frequencies. The table has 11 rows and 5 columns. The columns are labeled Semantic category, Subcategories, Type frequency, Token frequency, and Description. The rows are grouped under different semantic categories such as Artificiality, Clarity, Common, Dynamism, Superiority, Integrity, Euphony, Standard, Neg, Pos, Literal, and Other. Each row lists the subcategories, type frequency, token frequency, and a brief description of the semantic category. For example, under Artificiality, there are subcategories artificiality_neg and artificiality_pos with type frequencies of 16 and 4, token frequencies of 57 and 20, respectively, and descriptions pertaining to performative insecurity and unnaturalness. The table provides a detailed breakdown of the semantic categories and their frequencies in free response replies.
A crucial first observation is that only eight returns (category “literal,” 0.42 %) contained materials literally copied from the stimulus text (like genieten ‘to enjoy’, het jaar ‘the year’, hoekje ‘corner’), which signals that the absolute majority of all responses represent actual evaluations of the stimulus speakers or the stimulus speech.
Ignoring these literal repetitions, we find that the three major categories which have been recognized as pivotal evaluation dimensions in the literature on impression formation (and which served as the basis for the scaled measures discussed in section 5.1.), are well-represented in our data, viz. superiority, dynamism and personal integrity. The prime correlate of standardness, superiority, is represented by a category of adjectives indexing intelligence, politeness, and professional competence. In addition to such positive superiority, there are two classes of negative superiority evaluations, one indexing the inverse of superiority (e.g. onprofessioneel ‘unprofessional’ (n = 10)), one indexing excessive superiority (e.g. streng ‘strict’ (n = 13) or belerend ‘pedantic’ (n = 3)). Superiority, in other words, is represented in the spontaneous returns as a parameter with a positive and a negative pole.
The same goes for dynamism, which surfaces in a category of positive dynamism attributes (e.g. vlot ‘smooth/jovial’ (n = 59)), a category of negative adjectives representing absence of dynamism (e.g. saai ‘boring’ (n = 35)), and a small category of negative adjectives indexing exaggerated dynamism (e.g. arrogant ‘arrogant’ (n = 3)). The personal integrity returns in our data manifest a binary division, viz. positive integrity (e.g. vriendelijk ‘friendly’ (n = 65)) and negative integrity (e.g. koud ‘cold’ (n = 1)).
The artificiality dimension, which was addressed in the scaled evaluations in function of Research Question 2b – whether the mixed guises are perceived as (in)coherent – also emerged in the open-ended responses (n = 77), with negative returns pertaining either to the perceived unnaturalness (onnatuurlijk ‘unnatural’) and insincerity (gemaakt ‘contrived’, ingestudeerd ‘rehearsed’) of specific stimuli, and positive returns referring to their naturalness (natuurlijk ‘natural’).
Our free response data reveal other evaluation clusters which take the shape of parameters with a positive and a negative pole. The relevance of euphony – the aesthetic appreciation of speech – has repeatedly been confirmed as an important impression determinant in scaled attitude investigations (cases in point are Grondelaers, Van Hout, & Steegs Reference Grondelaers, Hout and Steegs2010, Van Bezooijen Reference van Bezooijen, Long and Preston2002), but it also shows up in positive and negative guises in our qualitative data (e.g. respectively warm (‘warm’, n = 32) and monotoon (‘monotonous’, n = 12)). A standardness dimension emerges for the most part in negative qualifications of speech as nonstandard (e.g. plat ‘broad, (n = 56)) and dialect (‘dialect’, n = 45)); positive standardness evaluations are correct (n = 4) or journaal (‘news broadcast’, n = 1)). Related to standardness is a category of positive returns indexing commonness on adjectives like familiair (‘familiar’, n = 20), normaal (‘normal’, n = 4) or vertrouwd (‘trusted’, n = 5), but also a cluster of keywords indexing clarity, pertaining to the transparency of the message (helder ‘clear’, toegankelijk ‘accessible’, begrijpelijk ‘intelligible’).
For a number of returns, we were able to determine their polarity (positive or negative), but we were unable to subcategorize them further in any of the subordinate categories just discussed. Positive cases in point include aangenaam (‘pleasant’, n = 52) and leuk (‘nice’, n = 24); negative cases include onaangenaam (‘unpleasant’, n = 14) or negatief (‘negative’, n = 5). In neither of the cases, it can be determined whether they pertain to the speaker or her speech. 11 other returns (like feminine, white) were difficult to categorize, even in terms of valence.
Table 3 cross-tabulates the absolute and relative frequencies of the evaluation categories just outlined for each of the eight guise-speaker combinations; categories with <5 tokens were excluded for reasons of statistical reliability and interpretative clarity. In order to obtain a more integrated, simultaneous view of the associations and differences in the frequency data in table 3, we performed correspondence analysis, which translates relative frequencies into spatial distances between column (sample) and row (cluster) categories, shown in the biplot in figure 4; these distances reflect how similarly the audio samples distribute their frequencies over the evaluative clusters, hence how similarly conceptualized and evaluated they are. Sample labels that are close together in the plot have analogous distributions across the other axis, viz. the evaluative clusters; a higher proximity of a sample label to a keyword cluster reflects the comparatively higher evaluative relevance of that keyword cluster for that audio sample.
Absolute and relative frequencies of the evaluation categories in the free responses for each of the eight guise–speaker combinations

Table 3 Long description
A table with 18 rows and 10 columns. The table presents absolute and relative frequencies of evaluation categories for eight guise-speaker combinations. The columns are labeled with the guise-speaker combinations, and the rows are labeled with evaluation categories. Each cell contains the absolute frequency and the relative frequency in percent. The evaluation categories include Artificility_neg, Artificility_pos, Clarity_pos, Common_pos, Dynamism_neg_exc, Dynamism_neg_lack, Dynamism_pos, Euphony_neg, Euphony_pos, Integrity_neg, Integrity_pos, Neg, Pos, Standard_neg, Standard_pos, Superiority_neg_exc, Superiority_neg_lack, and Superiority_pos. The table provides a detailed breakdown of how each category is evaluated across different guise-speaker combinations.
Correspondence biplot displaying the associations between keyword categories and audio stimuli. Keyword categories with positive valence are shown in green, those with negative valence in red, and neutral or uncategorized ones in grey.

Figure 4 Long description
A correspondence biplot displaying the associations between keyword categories and audio stimuli. The plot has two dimensions: Dim1 on the horizontal axis and Dim2 on the vertical axis. Dim1 accounts for 63.4 percent of the variance, while Dim2 accounts for 12.1 percent. The plot includes various keyword categories labeled in red and green, such as ‘artificiality_neg’, ‘clarity_pos’, ‘common_pos’, ‘integrity_pos’, ‘dynamism_pos’, ‘superiority_neg’, ‘standard_neg’, ‘euphony_neg’, and ‘euphony_pos’. These labels are scattered across the plot, indicating their associations with different audio stimuli. The plot also includes labels for different accuracy levels and test types, such as ‘Acc+TT_A’, ‘Acc+TT_B’, and ‘Acc-TT_A’. The distribution of these labels suggests patterns of association between the keyword categories and the audio stimuli.
While the x− and y− dimensions in figure 4 (respectively Dimension 1 and Dimension 2) do not have predetermined interpretations, we can make post hoc sense of them by studying patterns in the groupings of data points. The horizontal axis – which is delimited by the negative evaluations superiority_neg_lack and standard_neg on the left and their positive antonyms superiority_poss and standard_poss on the right – arguably indexes a standardness dimension, which is also supported by the antonymous qualities – on either side of the 0-divide – euphony_neg and euphony_pos, neg and pos. Consistent with the scaled evaluations, the VRT-guises are the most positively evaluated on this dimension, and while they do not cluster together, the immediate proximity of pos for −Acc−TT_A and superiority_pos for −Acc−TT_B are clear confirmations of their perceived standard status. Crucially, the free response keywords do not confirm the elevated position of the unaccented tussentaal guises on the scaled evaluations: although −Acc+TT_B arguably balances on the 0-divide, −Acc+TT_A is clearly categorized with the rejected samples.
This inferior position on the standard dimension, however, is counterbalanced by a superior status on the vertical dimension, which is somewhat more difficult to pinpoint since it is inherently multi-dimensional. If we go by the antonymous clusters dynamism_pos vs. dynamism_neg_exc and dynamism_neg_lack and integrity_pos vs. integrity_neg, we can see that we are dealing with a mixed DynaSolidarity dimension that we also found in the scaled ratings. In this case, however, the positive pole of the vertical dimension is also co-determined by positive commonness and clarity evaluations, as a result of which it delimits a conceptual space associated with both practical (rather than ideological) standardness and neo-standardness indexicalities. On this dimension and in this space, the unaccented tussentaal guises are upgraded, but the bi-plot confirms that this positive evaluation, especially that of −Acc+TT_B, is tinged with artificiality impressions on account of their proximity to the artificiality_neg cluster. If we look at the frequencies of the artificiality judgments in table 3, it will be observed that for speaker A both unaccented guises score high on artificiality (compared to the same speaker’s accented guises); consistent with the scaled responses, it seems to be speaker A’s inclination to get rid of a regional accent which is deemed artificial, rather than her combination of tussentaal features with a regionally neutral accent. After all, none of the ‘artificiality’ keywords – geforceerd ‘forced’, gekunsteld ‘contrived’, gemaakt ‘artificial’, nep ‘fake’, onnatuurlijk ’unnatural’, ingestudeerd ‘rehearsed’, overdreven ‘exaggerated’, kunstmatig ‘artificial’ – unambiguously signals that respondents sanction the juxtaposition of tussentaal features and a groomed accent; it is equally possible that the negative artificiality returns target unaccentedness as such, if only because a groomed VRT-accent is so rare in Flemish daily life.
For speaker B, however, the artificiality judgments do not pertain to the unaccented guises as a whole; as can be gleaned from both the frequency table and the correspondence biplot, the [−Acc−TT]-fragment of speaker B is deemed (much) less artificial in view of its distance from the artificiality_neg cluster. Speaker B’s [−Acc+TT]-fragment also triggered one keyword that unambiguously points to perceived incoherence: on her third return, a 49-year-old female observed – in defiance of the recommendation to return only one adjective per turn – that “Standard Dutch and colloquial language jumbled together does not come across as credible.” Hence, on the open keywords, there is some evidence that the combination of tussentaal features with a regionally neutral accent is deemed artificial, though not for both speakers. A regional accent, by contrast, is clearly associated with authenticity: the four +Acc−guises form a cluster associated with nonartificiality (artificiality_pos).
It is intriguing to notice that the evaluation of the unaccented tussentaal guises as artificial by some respondents does not exclude that they are upgraded as a common and dynamic practical standard language (we will come back to this below). A second important conclusion to be gleaned from the keyword data is that the open response returns reveal somewhat more conservative impressions than the scaled evaluations: they endorse the uncontested superiority of VRT-Dutch and the concomitant inferiority of the [−Acc+TT]-guises, but they compensate this inferiority with high dynamism associations. In this sense, the open response data are more directly reminiscent of the Kristiansen scheme’s counterbalancing of superiority and dynamism. As already indicated above, this might be attributed to the fact that the unprompted recall involved in open-ended questions requires unsupervised retrieval of information from memory. The latter process is arguably more susceptible to interference from the respondents’ beliefs and attitudes (Tourangeau et al. Reference Tourangeau, Rips and Rasinski2000), which may plausibly lead to the activation of (more) conservative value systems and – hence – more contrastive prestige distributions.
6. Discussion
Let us, next, address these results in function of the research questions outlined in Section 3.
RQ1: How perceptually coherent is speech which fuses a standard accent and nonstandard tussentaal features?
The (in)coherence evidence the present experiment furnishes remains ambiguous. On the scaled measures, artificiality perceptions targeted accentlessness rather than mixing, and only for one speaker. Against the backdrop of shifting language ideologies (see especially Grondelaers et al. Reference Grondelaers, Speelman, Lybaert and Van Gent2020), the fact that it is especially the younger listener-judges who reject accentlessness as artificial (while the oldest judges find the regional accent more artificial), lends generational depth to the observation that not mixing but accent neutrality is rejected. The free response data in table 3 and figure 4 confirmed the rejection of accentlessness for one speaker, but returned incoherence perceptions for the unaccented tussentaal guises of the other speaker. The observation that perceptions of incoherence are clearly linked to the speaker, suggests that perceptions crucially hinge on the performance of this type of language – specifically, on how convincingly a speaker is able to integrate a standard accent with nonstandard linguistic features. As noted in the methodology section, it proved challenging to find speakers capable of producing mixed guises, since speakers trained to produce regionally neutral accents typically are not used to combine these with tussentaal features. Although the audio samples we presented to participants were pretested and rated similarly in terms of regional identifiability, accent strength, perceived speaker age, agreeableness, and fluency, they plausibly varied in how artificial they were perceived to be. This leads to a crucial insight: Mixed language is not inherently downgraded as more artificial than other language varieties, but it has to be performed convincingly – which is an arguably difficult challenge. Yet, no matter whether and to what extent the mixed samples were deemed incoherent, they still command (especially dynamic) prestige associations; this brings us to the next question.
RQ2: What is the prestige status of mixed speech which fuses a standard accent and nonstandard tussentaal features?
This RQ branches into three subquestions, the first of which is whether the mutual exclusion of superiority and dynamism inherent in the Kristiansen scheme also holds for our data. The answer is both “yes” and “no,” and it varies with the data source – i.e. scaled or open responses. Like Grondelaers et al. (Reference Grondelaers, Speelman, Lybaert and Van Gent2020) and Zenner et al. (Reference Zenner, Grondelaers, Rosseel, Speelman, Esselinckx and Rombouts2021), the scaled experiment confirms that the VRT-guise [−Acc−TT] is consistently rated as more superior than the other guises; the fact that the superiority ratings are not stratified by region suggests a high level of consensus. In addition, the mixed [−Acc+TT] guise is typically upgraded in terms of DynaSolidarity, though it is only the most dynamic guise for the Brabantic and the youngest respondents. However, the fact that unaccented speech with tussentaal features is deemed highly dynamic does not entail in our data that it is also considered inferior on the superiority scales: the [−Acc+TT]-guise exceeds the superiority baseline exceeds the superiority baseline exceeds the superiority baseline for nearly all groups. A crucial finding is that it is especially respondents who are ignorant of our experimental goal who upgrade the mixed guise on superiority. The latter entails that positive superiority evaluations of tussentaal in Flanders (still) require ideological unawareness.
The unconstrained keyword responses, by contrast, bear more testimony to the Kristiansen scheme in its purest form of counterbalancing conservative prestige (VRT-Dutch, not Mixed Dutch) and dynamic prestige (Mixed Dutch, not VRT-Dutch). We have accounted for the divergence between the scaled and unconstrained responses by recourse to the respective processing of these modalities, and in particular the fact that the unprompted recall required for the latter may activate more conservative ideologies.
Our scaled findings also contain a clear answer to RQ2b: In spite of their negative press, it is not the tussentaal features, but the regional accent which garners the negative evaluations, no matter how light it is. Both accented guises are consistently downgraded on superiority, by all groups and in all conditions. The presence of tussentaal features, by contrast, does not render the samples less superior. A more or less similar picture obtains for the DynaSolidarity ratings: In spite of some regional stratification, it is the unaccented guises which are clearly the more dynamic. The correspondence analysis on the open responses does not fully replicate the dichotomy between accentedness and the tussentaal features. It confirms the systematic downgrading of the accented samples on the standardness dimension – they form a cluster on the negative pole of the dimension – but the evaluation of the tussentaal features is more stratified: the [−Acc+TT]-sample of speaker B occupies an intermediate position on the superiority dimension, and in the context of unaccentedness, the tussentaal samples are by far the most dynamic.
As a consequence, it is clear that the supraregional tussentaal features we have selected are not in themselves negatively evaluated (RQ2c): They are downgraded exclusively in the context of a regional accent. This, in turn, entails that grooming one’s accent discharges the negative evaluation of the tussentaal features. Our findings, in other words, confirm the suggestion in the introduction that the National Day video conveys a polished impression due to its accent, but that it lacks the social distance markers typically associated with fully fledged VRT-Dutch on account of the tussentaal features which evoke Flemishness, informality, and proximity.
7. Conclusion
In this article, we have reported a contextualized speaker evaluation experiment which elicited scaled and free response evaluations of Belgian Dutch produced in four conditions, viz. with or without a mild regional accent, and with or without 34 shibboleth features of tussentaal, a widely stigmatized colloquial variety of Belgian Dutch. Evaluations were contextualized by re-embedding the manipulated speech in the source video we sourced it from, a National Day clip commissioned by the Flemish government. Interestingly, the Flemish authorities are known for their insistence on an exclusionary standard language ideology which uniquely upholds the value of unaccented broadcaster Dutch and downgrades other varieties, and in particular tussentaal. What is the actual significance of the presence of tussentaal in the official communication of an establishment which unconditionally upholds the importance of standard language? Are tussentaal shibboleths not recognized/evaluated as such in the context of a groomed accent, or has tussentaal become acceptable?
This is what we found in the experiment:
-
• While the scaled and the open response evaluations do not fully converge on the question whether mixed Belgian Dutch which fuses informal tussentaal shibboleths with a posh accent is recognized as incoherent and therefore also as artificial – the scaled responses clearly show that it is not, but the open responses are more ambiguous – a major finding of this study is that potential incoherence or artificiality perceptions do not automatically lead to downgrading. This means that it is at least theoretically possible to compose a credible variety of Dutch which is at the same time formal and informal.
-
• As in all preceding investigations of Flemish language dynamics, a very conservative standard language ideology upgrades unaccented VRT-Dutch as the most superior variety, but our mixed guise of tussentaal features and a polished accent is not downgraded as inferior, and it is upgraded as dynamic; for the younger respondents, it even is the most dynamic guise.
The collected data have a number of important consequences. Empirically, they demonstrate that the relationship between VRT-Dutch and tussentaal has to be reconsidered. The evaluation of (Belgian) standard language as standard, to begin with, is primarily determined by the degree of nonregionality of the accent, not by the tussentaal features. Conversely, the tussentaal features do not, in themselves, represent negative traits: Their polarity depends on the context in which they appear. Against the backdrop of a polished accent, they arguably represent informality and proximity stylization agents. In the context of a (broader) regional accent, they index inferiority and sloppiness.
In the National Day video, tussentaal therefore is a toolbox of shibboleth traits the speaker (or rather, the clip’s author) can employ to flavor the speech. The most accurate delineation of that practice would be to call it a “style” in the sociolinguistic sense of a socially located combination of linguistic resources which do not have an intrinsic positive or negative valence (Eckert Reference Eckert2008).
Somewhat more generally, accent neutrality can be regarded as a “civilization agent” that can be employed to defuse the negative charge of colloquial features. Even more generally, a language variety is evaluated as more standard the more it is “disciplined” on the criterion which matters most according to our data, namely, accent neutrality or – wider still – deregionalization. As a consequence, the question in the title of this article – “is standard language no more than a neutral accent?” – may be formulated too strongly in its current form, but its more nuanced version – “is standard language primarily a neutral accent?” – can arguably be answered in the affirmative.
The latter represents a potential gamechanger in the quest for a practical standard of Belgian Dutch. If the formality and poshness indexicalities of VRT-Dutch make that variety inappropriate for colloquial contexts which require dynamism and informality, could accentless Dutch with tussentaal features fill that void? We believe that it could in some contexts, as it is a groomed variety which meets the standardness criteria outlined in section 2. The absence of an identifiable accent and the reliance on tussentaal features which are endogenous in the majority of the dialects in Flanders (see section 2) ensures that the uniformity criterion (2.1) is satisfied. The provenance of the mixed speech in official government communication suggests that both the formality (2.2) and the codification criteria (2.4) are respected, at least by proxy. And the dynamism and superiority indexicalities of the National Day speech confirm that it meets the prestige criterion (2.3).
A critical open question is whether and to what extent the theoretical suitability of our mixed Dutch as a dynamic standard also translates in an actual production reality. In a number of European countries, notably Italy (Berruto Reference Berruto1987), Germany (Auer & Spiekermann Reference Auer, Spiekermann, Kristiansen and Coupland2011), and Denmark (Kristiansen Reference Kristiansen2001), de-regionalized dynamic standards (or “neo-standards,” Auer Reference Auer, Cerruti, Crocco and Marzo2017) have been attested and documented, namely, “ways of speaking characterized both by supra-regionality (even globalization) and informality” (Auer Reference Auer and Stickel2018:37). In all these communities, this neo-standard is a practical reality, especially in audio-visual mass media (Auer Reference Auer and Stickel2018:40), but in Flanders, the tussentaal which is also considered as a neo-standard (Auer Reference Auer and Stickel2018:37; see also Grondelaers et al. Reference Grondelaers, Hout and Van Gent2016 ’s label “emergent standard”) is not de-regionalized because it is crucially associated with regional accentedness.
The nonaccented variety of tussentaal is specifically attested in monitored genres such as government communication (like the National Day video) and, crucially, in advertising (see above). In spontaneous speech, however, attempts at mastering Standard Dutch tend more often – as also noted by one reviewer – to yield accented Dutch without tussentaal features than the reverse configuration. This asymmetry may help account for the attitudinal appeal of accentless Dutch with tussentaal features. More specifically, accented Dutch without tussentaal features may index a speaker who aspires to use Standard Dutch but lacks full proficiency, whereas accentless Dutch with tussentaal features may index a speaker who has command of the standard variety but deliberately departs from it.
The question whether accentless speech with tussentaal features will ever become a vital spoken standard is difficult to answer since regional accent variation in Flanders is ubiquitous, and since the bottom-up standardization of tussentaal (see above) is by no means complete. The operative term in the norm debate, however, need not be absence of a regional accent, but making an audible effort to reduce one’s accent as much as possible. In this day and age, the latter certainly is a more attainable endeavor than imposing on the Flemish the VRT-Dutch that only few can speak, or wish to speak.
The present study has offered a snapshot of a complex and variable phenomenon rather than a comprehensive mapping of the entire tussentaal continuum. Future research could systematically manipulate the type and density of tussentaal features (e.g. phonological vs. lexical) to assess their relative impact on speaker evaluations across different points on the continuum. At the same time, such experimental manipulation entails a risk of producing linguistically or pragmatically incoherent stimuli – an issue we have tried to avoid by working with an attested, real-life sample. Further work should also examine the extent to which the patterns observed here generalize across different communicative contexts and respondent profiles. In particular, it would be valuable to include multilingual respondents, whose first language is not (exclusively) Belgian Dutch, in order to assess how individuals without full socialization into the historically specific and ideologically marked Flemish standard language ecology evaluate such variation. Currently, we are also investigating to what extent our findings extend to a panel of Flemish language professionals (including teachers and journalists), who may hold higher expectations with respect to standard language use. The suggested avenues for follow-up research heed the fact that tussentaal evaluation is an inherently context-sensitive phenomenon that resists straightforward operationalization, yet appears increasingly open to experimental control.
Appendix A. Transcription from original video
Tussentaal features are marked in bold; morphosyntactic tussentaal features are highlighted in grey and lexical tussentaal features in black.

Appendix B. Significant linear mixed model effects for the superiority scores

Appendix C. Significant linear mixed model effects for the DynaSolidarity scores

Appendix D. Significant linear mixed model effects for the artificiality scores

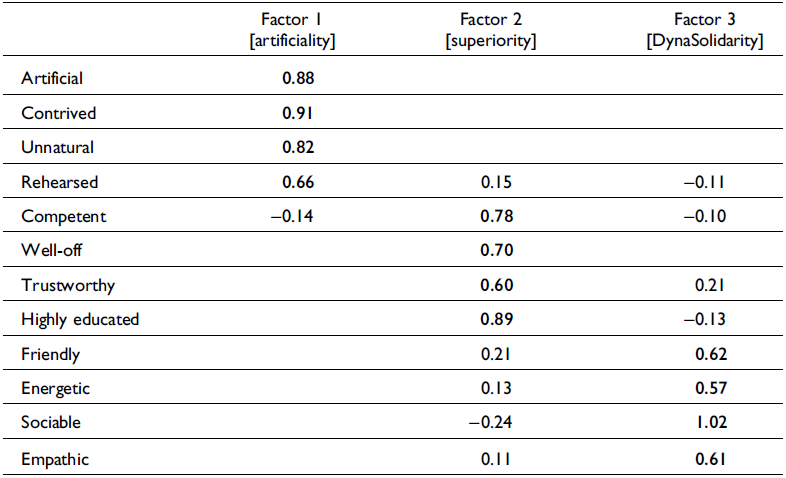


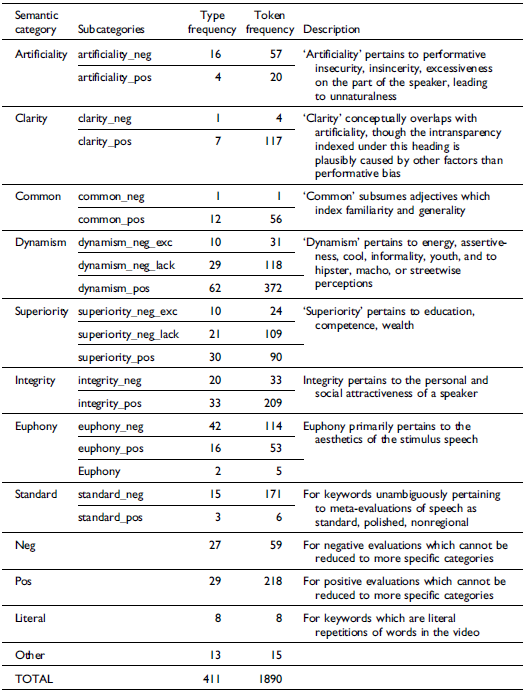
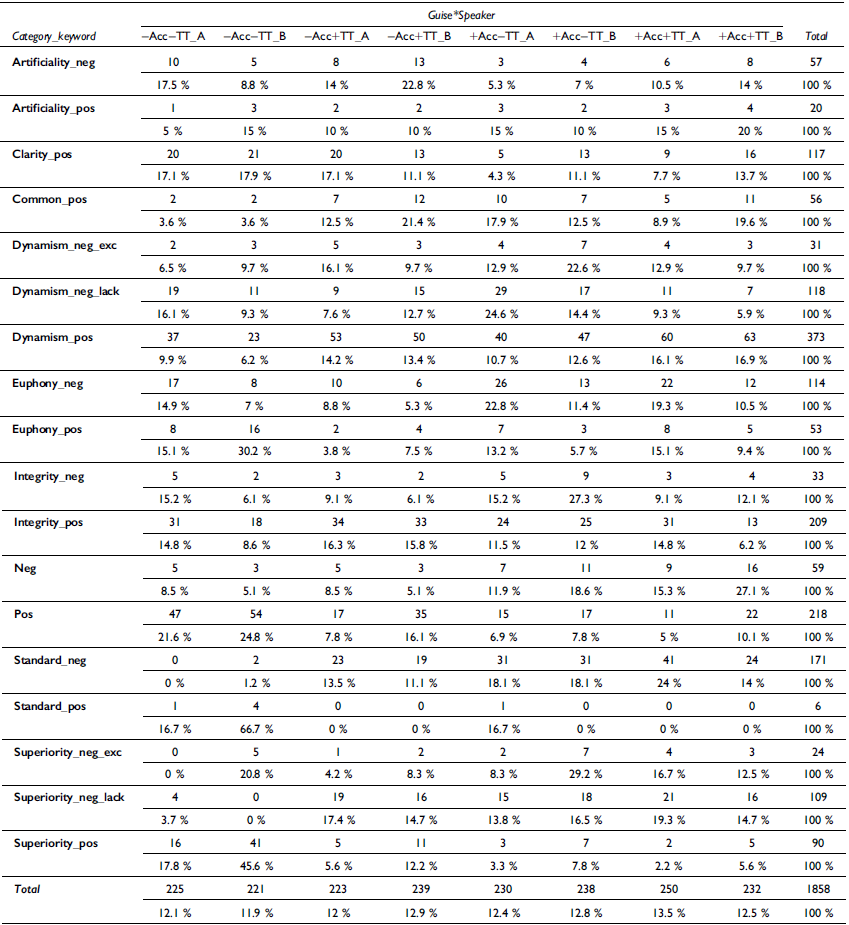


 Open access

