Implications
Drinking patterns are a potential tool for disease monitoring in pigs. Water consumption is determined by the number of visits, visit duration and intake per unit of time. A detailed understanding of pigs’ normal drinking behaviour and diurnal variation will help identify drinking behaviour outside the norm. As different factors can influence the drinking behaviour, improving our knowledge about the pigs’ normal drinking pattern will help clarify which drinking parameters we need to measure in order to, in the long term, be able to distinguish changes in the drinking pattern caused by disease from those caused by other factors.
Introduction
Water is involved in virtually all body functions and is an essential part of the nutritive and welfare requirements of pigs. Drinking behaviour often mirrors feeding behaviour as 75% of the water intake is associated with the pigs’ feed intake (Bigelow and Houpt, Reference Bigelow and Houpt1988). The water intake follows a stable diurnal pattern at a group level (Madsen and Kristensen, Reference Madsen and Kristensen2005; Villagra et al., Reference Villagra, Althaus, Lainez, Martinez and Torres2007) and systems for automatic detection of changes in the diurnal water use have been developed (Madsen and Kristensen, Reference Madsen and Kristensen2005; Madsen et al., Reference Madsen, Andersen and Kristensen2005) and are used as animal welfare monitoring tools at a batch level. Pigs’ water consumption can be affected by disease (Pijpers et al., Reference Pijpers, Schoevers, van Gogh, van Leengoed, Visser, van Miertet and Verheijden1991) and with the present development in computer technology, automatic real-time monitoring of drinking behaviour of individual pigs might potentially be used to identify individuals suffering from disease. However, pigs’ water use is also influenced by external factors such as room temperature (Larsson, Reference Larsson1997; Seddon et al., Reference Seddon, Farrow, Guy and Edwards2011), level of social competition (Turner et al., Reference Turner, Edwards and Bland1999), diet (Mroz et al., Reference Mroz, Jongbloed, Lenis and Vreman1995; Vermeer et al., Reference Vermeer, Kuijken and Spoolder2009) and the available flow of water in the drinking nipples (Vermeer et al., Reference Vermeer, Kuijken and Spoolder2009). Consequently, for drinking behaviour to be used to distinguish disease from other factors that influence it, a more detailed analysis of the drinking behaviour including more drinking variables besides the water intake is required.
In general, the outcome of animal drinking as well as feeding behaviour is determined by three variables: the number of visits to the drinker, duration of each visit and intake per unit of time (Nielsen, Reference Nielsen1999), which should be central variables in the study of individual drinking behaviour. For feeding behaviour, complex interactions exist between different external factors and the central behavioural variables. One example is that increased social competition for feed decreased the number of visits to the feeder and increased the feed intake per minute (e.g. De Haer and De Vries, Reference De Haer and De Vries1992; Nielsen et al., Reference Nielsen, Lawrence and Whittemore1995), whereas increased temperature also decreased the number of feeder visits but did not affect feed intake per minute (Quiniou et al., Reference Quiniou, Renaudeau, Dubois and Noblet2000). It is likely that there are similar complex interactions for drinking behaviour. Therefore, to optimise the probability of identifying changes in drinking behaviour and their underlying causes, several behavioural variables and their mutual interactions need to be quantified. Only a few studies have focused on the interplay between the parameters involved in drinking behaviour in pigs and then mainly on the day level. McDonald et al. (Reference McDonald, Crane, Stewart, Edwards and English1996) and Turner et al. (Reference Turner, Edwards and Bland1999) found that increased competition around the drinker reduced the number of visits and time spent drinking per pig per day, but they found no difference in water use even though the time spent drinking decreased. This suggests that the pigs were able to adapt their drinking speed to the level of competition. The time spent drinking in those studies was based on video recordings and the water flow during the drinking event was not measured.
More knowledge about the normal drinking behaviour in order to interpret changes is needed. Therefore, the aim of the present study was to record the number of visits and describe a typical visit at the water nipple with regard to water intake and duration and testing for effects of period of day and effects of increased competition for access to the drinking nipple on these drinking parameters.
This was done by comparing a pig-to-nipple ratio of 3 : 1 v. 10 : 1 in order to have baseline measurements of drinking behaviour with minimal competition to act as a benchmark v. the current welfare standard advising a minimum of one nipple drinker/10 growing pigs (Landbrugets Rådgivningscenter, 1993; Royal Society for the Prevention of Cruelty to Animals, 2012).
Material and methods
Animals and housing
In all, 52 cross-bred (Landrace×Yorkshire×Duroc) castrated male pigs of 8 to 9 weeks of age were distributed in two replicates (initial live weight replicate 1: 21.5 ±1.7 kg; replicate 2: 19.6±1.0 kg (mean±s.d.)). Each replicate consisted of 26 pigs, allocated in 4 groups, 2 of either 3 (N3) or 10 (N10) pigs per pen and nipple drinker. The pigs in each pen were selected from at least two litters. Before the experiment, all pigs were housed and managed at the experimental farm at AU-Foulum, Aarhus University, according to commercial Danish production standards. Five days before the experiment started, the pigs were weighed, mixed into experimental groups and moved to the experimental pens. Four pens (3.1×3.0 m) located in the same room were used. An area of 0.7×3.0 m of the floor was concrete slatted floor, rather than solid concrete. A covered resting area, closed on three sides (0.23 m2 per pig), and a single space feeder (0.7×0.3×0.3 m) were placed on the solid concrete floor (Supplementary Figure S1). The pigs were fed ad libitum with a commercial pelleted diet (Profil 9 AFH Exp; DLG, Copenhagen, Denmark) containing 8.3 MJ net energy/kg. Between 0800 and 0900 h, the pens were cleaned, fresh chopped straw was provided (used as enrichment material) and the hoppers of the feeder were re-filled to guarantee ad libitum access to feed. The room temperature was maintained at 19°C and regulated by negative pressure ventilation. In addition to natural daylight, the room was lit 24 h with artificial lighting to enable video recording.
Experimental design and set-up
Each pig was fitted with a uniquely coded transponder ear tag (HDX-HL; Allflex Dan-mark ApS, Lemvig, Denmark) in the right ear and kept in the experimental pens for 5 days for acclimatisation followed by 4 days of data collection.
In the pens, a standard commercial nipple drinker (Sutte-bideventil type 7; Fabrikken UNNI ApS, Vejle, Denmark) was placed in a wooden box (1.0×0.8×0.5 m) ∼0.9 m from the feeder (Supplementary Figure S1). The nipple drinker was mounted 0.53 m above floor level according to Danish recommendations with a 15º downward angle against the horizontal plane (Supplementary Figure S2). The pigs had access to the nipple drinker through a 0.3 m wide×0.41 m high opening located 0.3 m above floor level (Supplementary Figure S3). There was unrestricted access to the water. On the day of arrival, the staff ensured that all pigs found and used the nipple drinker. For individual identification, a radio frequency identification (RFID) reader (Allflex Dan-mark ApS) was placed in the left corner of the wooden box ∼5 cm from the position of the transponder-tagged ear of a drinking pig. For measuring water use, a flow meter (RS 257–149; RS Components A/S, Copenhagen, Denmark; flow range 0.25 to 6.5 l/min, ±1.0%) was attached to the supply of each nipple drinker. The flow meters were calibrated at the start and end of each replicate. Water use was logged every second and transferred to a PC. Every 2 s, the RFID reader registered whether a transponder was present at the drinking nipple or not, visits were recorded with a transponder code and a time stamp. The RFID registrations were coupled with water use via time stamps. Before each replicate, the flow rate to each nipple drinker was adjusted to the recommended flow rate for pigs between 15 and 45 kg and was recorded at the end of the replicate. The average flow rate for the four water nipples was 0.82±0.08 l/min (mean±s.d.). To quantify water wastage, the floor of the wooden boxes was funnelled and led wasted water to a jug situated under the floor of the box. The jug was accessible from outside the pen. Each day water wastage within pen was collected and the accumulated volume per pen was measured from 0800 to 1600 h. A technician ensured cleanliness of the funnel and reading the volume of water in the jug. To calculate feed consumption at the pen level, allocated feed was weighed and the remaining feed in the feeder weighed back at the end of the experimental period.
Behavioural recording
The following variables: number of visits to the drinker, amount of water used (intake inclusive of water wastage), visit duration and visit time were recorded continuously during the experimental period of 4 days. By definition a visit to the drinking nipple was recorded when a positive RFID registration and simultaneous use of water was recorded. The duration of the visit corresponded to the duration of the RFID registration of the pig in the box. The amount of water used corresponded to the volume of water flowing out during the visit, including water wastage. A visit where the time from the end of a visit to the beginning of the next visit of the same pig was <30 s was defined as an interrupted visit.
Disease recording
The general condition of the experimental pigs was assessed on an individual pig basis three times during the experimental period using a scale from 0 to 4 (‘normal’ to ‘severely ill’), along with an assessment of faeces on a scale from 0 to 6 (‘dry, lumpy’ to ‘foamy yellow’), with grade 3 (‘soft and liquid’) and higher categorised as clinical diarrhoea.
For all experimental pigs, no cases of diarrhoea were observed and the general condition was assessed as ‘normal’.
Statistical analyses
The statistical analyses were performed using the statistical software R Version 2.11.1 (R Development Core Team, 2011). The drinking behaviour variables were analysed at two levels of aggregation, a level of 8 and 24 h, respectively. The chosen 8-h periods were: from 0600 to 1400 h (P1), from 1400 to 2200 h (P2) and from 2200 to 0600 h (P3). The start of P1 was selected as the time of initiation of drinking activity in the morning, which was around 0600 h for both treatments. The start of the last period (P3) was selected as the time the drinking activity declined for the night, which was around 2200 h for both treatments. Effect of treatment on the drinking behaviour variables – total number of visits, time spent drinking, volume of water used and proportion of interrupted visits – were analysed using the linear mixed-effect model (Pinheiro et al., Reference Pinheiro, Bates, DebRoy and Sarkar2009), with group size, replicate, observation day and period as the fixed effects and pen within replicate as the random effect. Interrupted visits were analysed as the proportion of interrupted visits per pig within each time period (number of interrupted visits/total number of visits) to adjust for differences in total number of visits. If systematic effects were not significant (P>0.05), the model was reduced accordingly and the analysis was repeated. A variance components analysis was carried out at the 24-h level (Crawley, Reference Crawley2013) including pen, days within pen and pig within days within pen.
The effect of treatment on the percentage of water wasted was analysed using the linear mixed-effects model (Pinheiro et al., Reference Pinheiro, Bates, DebRoy and Sarkar2009), with group size, replicate and observation day as fixed effects and pen within replicate as a random effect. Percentage water wastage was calculated as a percentage of the water used in the same time period.
The relation between the amount of water used and the visit duration was analysed using a GLM, including treatments (N3, N10).
Results
Drinking behaviour of individual pigs over 24 h
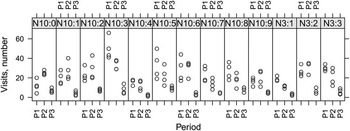
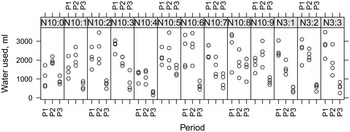
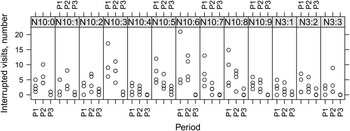
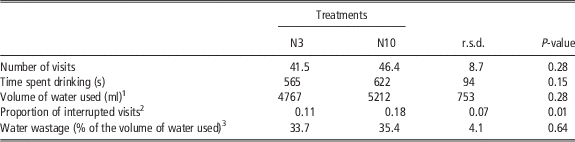
The drinking behaviour variables and water wastage for the two treatments are shown in Table 1. On average, the pigs visited the drinking nipple 44 times/day and spent 594 s drinking, with an average water use of 4.99 l/pig per day. When data were pooled over 24 h (day level) no differences were found between treatments regarding total number of visits (t6=1.2, P=0.28), time spent drinking (t6=1.7, P=0.15) or volume of water used (t6=1.2, P=0.28). For these three drinking parameters >55% of the random variation was accounted for by differences between the pigs, while 5% to 8% was accounted for by differences between days and 11% to 20% was accounted for by differences between pens (see example in Figures 1 and 2). At the day level, the proportion of interrupted visits was significantly lower in N3 than N10 (t6=4.85, P<0.01). For the proportion of interrupted visits >90% of the random variation was accounted for by difference between the pigs (Figure 3). The average visit length was 13.6±0.4 s and average water used was 115±9 ml/visit. Overall, 34.6% of the volume of water used was wasted, but treatments did not affect this (P=0.36).
Number of visits per pig per period for each of the four observation days in replicate 2, shown for each pig in pen number 1, treatment N10 and pen number 4, treatment N3. The three periods cover the hours from 0600 to 1400 h (P1), from 1400 to 2200 h (P2) and from 2200 to 0600 h (P3).

Amount of water used (ml) per pig per period for each of the 4 observation days in replicate 2, shown for each pig in pen number 1, treatment N10 and pen number 4, treatment N3. The three periods cover the hours from 0600 to 1400 h (P1), from 1400 to 2200 h (P2) and from 2200 to 0600 h (P3).

Number of interrupted visits per pig per period for each of the 4 observation days in replicate 2, shown for each pig in pen number 1, treatment N10 and pen number 4, treatment N3. The three periods cover the hours from 0600 to 1400 h (P1), from 1400 to 2200 h (P2) and from 2200 to 0600 h (P3).

Effect of housing of pigs in groups of 3 (N3) or 10 (N10) pigs per drinking nipple on the daily level of four drinking behaviour variables and water wastage (mean/pig per day)
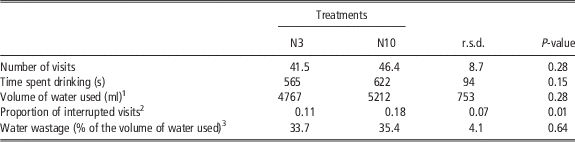
1 Use included water wastage.
2 Number of visits per day where the time from the end of a visit to the beginning of next visit of the same pig was <30 s/the pigs’ total number of visits per day.
3 Quantified between 0800 and 1600 h.
Drinking behaviour of individual pigs split into 8-h periods
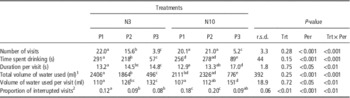
There was a significant interaction between period and treatment on drinking behaviour. The drinking behaviour variables per 8-h period level are shown in Table 2 for treatments N3 and N10.
Effect of housing of pigs in groups of 3 (N3) or 10 (N10) pigs per drinking nipple on the diurnal variation of the drinking behaviour variables

Trt=treatment; Per=period; Trt×Per=interaction between treatment and period.
Day was divided into three periods covering the hours from 0600 to 1400 h (P1), from 1400 to 2200 h (P2) and from 2200 to 0600 h (P3) (mean/pig per 8-h period).
a to dValues within a row with different superscripts differ significantly at P<0.05.
1 Use included water wastage.
2 Number of visits/8-h period where the latency from a visit until next visit of the same pig was <30 s/the pigs’ total number of visits/8-h period.
Comparison of treatments N3 and N10 within the three 8-h periods (Table 2) showed significant differences between treatments in time spent drinking and the amount of water used per 8 h for all three time periods. Time spent drinking was higher in N3 compared with N10 in P1 (t84=−2.03, P<0.05) but lower in N3 compared with N10 in P2 (t84=−3.49, P<0.01) and P3 (t84=−1.87, P<0.05). The same pattern was found for the volume of water used (Table 2). No significant differences were found between treatments in number of visits to the drinking nipple in the morning (P1; t84=−1.15, P=0.15) or in the night (P3; t84=−0.80, P=0.21). In the afternoon (P2), however, the number of visits to the drinking nipple was significantly lower for N3 than N10 (t84=−3.25, P<0.01). The proportion of interrupted visits was higher for N10 than N3 in both P1 (t84=2.48, P<0.01) and P2 (t84=4.53, P<0.001), whereas no significant effect of treatment was found in P3 (t84=0.70, P=0.24; Table 2).
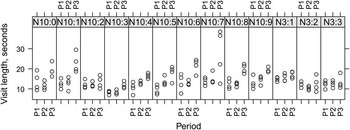
For the mean duration of a visit, there was no significant difference between treatments in P1 (t84=−0.31, P=0.37) or in P2 (t84=−1.30, P<0.10), while in P3, the mean duration of a visit was higher in N10 than in N3 (t84=−2.40, P<0.01; Table 2 and Figure 4). The same patterns were found for the average amount of water used per visit.
The average visit length for the three periods for the 4 observation days in replicate 2, shown for each pig in pen number 1, treatment N10 and pen number 4, treatment N3. The three periods cover the hours from 0600 to 1400 h (P1), from 1400 to 2200 h (P2) and from 2200 to 0600 h (P3).

Comparison of the three periods within treatment showed that, in N3 the three drinking parameters: number of visits, time spent drinking and total volume of water used differed significantly between the three 8-h periods (P<0.001; Table 2). The level per 8 h were for each of these drinking parameters highest in P1 and lowest in P3 (the night). The highest proportion of interrupted visits in N3 was also found in P1 (t84=−1.65, P<0.05), whereas no significant difference was found between P2 and P3 (t84=−0.46, P=0.30; Table 2). In N10, however, no significant difference was found in the number of visits between P1 and P2 (t84=−0.74, P=0.23), but, as in N3, the number of visits to the drinker was as expected significantly lower in P3 than in the two other periods (t84=13.4, P<0.001). In N10, there was a tendency towards an increase in time spent drinking in P2 compared with P1 (t84=−1.4, P=0.08) and in volume of water used (t84=1.6, P=0.06). Both the time spent drinking and volume of water used were lower in P3 (the night) than in the two other periods (t84=−10.7, P<0.001; t84=−9.7, P<0.001) in treatment N10 as in N3. For the proportion of interrupted visits in N10, no significant difference was found between P1 and P2 (t84=0.60, P=0.26), whereas the proportion of interrupted visits was significantly lower in P3 than in the other periods (t84=−4.1, P<0.001; Table 2).
In N3, the visit duration and the amount of water used per visit were lower in P1 than in the other two periods (t84=−1.95, P<0.05; t78=−2.28, P<0.01), but there was no significant difference between P2 and P3 for these variables (t84=−0.56, P=0.29; t78=−0.81, P=0.21). In N10, however, P3 was associated with longer visits and more water use per visit than P1 and P2 (t84=−5.6, P<0.001; t78=−5.5, P<0.001). No difference between P1 and P2 was found (t84=−0.59, P=0.29; t78=−0.68, P=0.32).
Effects of social competition on the rate of water use
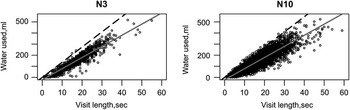
The observed amount of water used is shown in Figure 5 as a function of the visit duration. No significant effect of treatment was found (P=0.49) and the amount of water used per visit could be described by the regression line:
 $$\eqalign{{\rm Water \, used \, per \, visit}\,\left( {{\rm ml}} \right)={\minus}22.1{\plus}10.1{\times}{\rm visit \, duration}\left( {\mathop{\rm s}\nolimits} \right),\cr R^{{\rm 2}} =0.876(1)$$
The observed volume of water used (ml) per visit for treatments N3 and N10 with the regression line from equation (1) (red solid line). The black dotted line is the manually measured flow rate for the nipple drinker (0.82 l/min).

Feed consumption
The average feed consumption per pig was 1.26±0.07 and 1.35±0.10 kg/day for treatments N3 and N10, respectively, and there was no significant difference between treatments (P=0.38).
Discussion
Three behavioural parameters – number of visits, visit duration and water intake per unit of time – are central for the description of water intake. When the observations in the present study were pooled over 24 h, no effect of the level of social competition was found on number of visits, visit duration and water use per pig, as well as no effect was found on water wastage at pen level. However, the proportion of interrupted visits differed between treatments over 24 h, where pigs with the recommended minimum nipple availability showed an increased proportion of interruptions compared with pigs at a low level of competition. Splitting data into 8-h periods revealed differences between treatments and in the pattern between periods for all drinking parameters.
Pigs have a circadian activity rhythm with one or two peaks during daytime (e.g. Villagra et al., Reference Villagra, Althaus, Lainez, Martinez and Torres2007; Andersen et al., Reference Andersen, Jørgensen, Dybkjær and Jørgensen2008). In accordance, the lowest number of visits to the drinker was found at night for both treatments. The timing and curvature of the peaks in the circadian rhythm can be affected by factors such as room temperature (Vermeer et al., Reference Vermeer, Kuijken and Spoolder2009) and competition around the feeder (Nielsen et al., Reference Nielsen, Lawrence and Whittemore1995; Hyun and Ellis, Reference Hyun and Ellis2002). Dividing the current data into 8-h periods showed that N10 had more visits to the drinking nipple in the period between 1400 and 2200 h (P2) than N3. However, at the 24-h level, the difference was eliminated. Turner et al. (Reference Turner, Edwards and Bland1999) found a decreased number of visits to the drinker over a 24-h period at increased competition. One reason for the present lack of effect at the 24-h level in the present study might have been our focus on pig-to-nipple ratios up to the recommended welfare code, while Turner et al. (Reference Turner, Edwards and Bland1999) focussed on higher stocking rates on nipple drinker. Nielsen et al. (Reference Nielsen, Lawrence and Whittemore1995) reported that 24-h feeding behaviour of pigs differed between groups of 20 v. 15 or fewer individuals per feeding space, but the effects of pigs per feeder increased when data were split into periods. This might suggest that studies performed at the 24-h level risk overlooking adjustments made by the animals to adapt to the conditions, thereby postponing detection of behavioural changes.
The effect on number of visits per day found in this study corresponds to results from Turner et al. (Reference Turner, Edwards and Bland1999) based on groups of 20 pigs with two drinking nipples. Furthermore, the observed water wastage was 35%, which is comparable to other studies (Larsson, Reference Larsson1997; Li et al., Reference Li, Chénard, Lemay and Gonyou2005) and corresponds to an average water consumption of 3.3 l/pig per day. For both visits and water used there was a large variation between pigs (Figures 1 and 2). The difference in water used may be owing to differences in physiological needs or differences in water wastage, but the cause cannot be clarified based on this study, where feed intake and water losses were measured on the pen level.
In the present study, pigs spent less time drinking per day than reported by Turner et al. (Reference Turner, Edwards and Bland1999) but more than observed by McDonald et al. (Reference McDonald, Crane, Stewart, Edwards and English1996) from a system with water troughs, even though the reported amount of water used was comparable to the present results. Pigs drinking from water troughs would have the opportunity to increase water intake per unit of time, whereas pigs drinking from water nipples would be limited by the current water flow rate. The difference in visit duration between the present study (14 s/visit) and that found by Turner et al. (Reference Turner, Edwards and Bland1999; 21 to 26 s/visit) is likely because of the higher water flow rate of the nipples used in the present study. Meiszberg et al. (Reference Meiszberg, Johnson, Sadler, Carroll, Dailey and Krebs2009) showed that human observers tend to overestimate time spent at the water nipple compared with automatic water metres, thus the difference in visit duration between the studies might also be explained by different observation methods.
In pigs, increased competition has been shown to increase duration of a feeding visit (De Haer and De Vries, Reference De Haer and De Vries1992; Nielsen et al., Reference Nielsen, Lawrence and Whittemore1995). At the 24-h level neither Turner et al. (Reference Turner, Edwards and Bland1999) nor the results found in the current study, demonstrated any difference in visit duration to the drinking nipple between different levels of competition. However, when data in the present study was split into 8-h periods, the visit duration differed between the treatments. The longest visits were found during the night in N10, agreeing with data from increased feeder competition conditions (Morrow and Walker, Reference Morrow and Walker1994). Jackson et al. (Reference Jackson, Karriker, Stalder and Johnson2009) found that a period of water deprivation led to an increased number and duration of visits, thus the longer visit duration at night observed in N10 might reflect a compensatory intake. However, the average water used per pig during daytime (P1 plus P2) was not lower for the N10 treatment compared with N3. Therefore, there is no immediate reason to expect a compensatory intake at night time in N10 compared with N3. Morrow and Walker (Reference Morrow and Walker1994) suggested that the increased duration of feeder visits during the night was caused by subordinate pigs. However, it appears from the example in Figure 4 that the majority of the pigs in N10 have longer visits at night, which argues against the hypothesis that it is caused by subordinate pigs. Additional behavioural studies are needed in order to clarify the observed differences in visit duration.
At the period level, we found a decreased duration of drinking behaviour in the morning (P1) for N10 compared with N3 caused by a small decrease in number of visits and visit duration. In contrast, in the afternoon (P2) and night (P3) the duration of drinking increased in N10 compared with N3, caused by an increased number of visits in P2, while in P3 it was mainly caused by an increase in visit duration. This indicates that the pigs maintained water intake at the 24-h level by changing one or more of the behavioural variables involved in drinking, corresponding to results from feeding behaviour (Nielsen et al., Reference Nielsen, Lawrence and Whittemore1995; Hyun and Ellis, Reference Hyun and Ellis2002), and that the behavioural variables being adjusted seemed to depend on the period. However, Turner et al. (Reference Turner, Edwards and Bland1999) found no notable effect of increased competition on the diurnal pattern of drinking time.
For feeding, a decrease in the total duration of the behaviour at increased competition has been found, but the pigs maintained feed intake at the 24-h level by increasing intake per minute (Nielsen et al., Reference Nielsen, Lawrence and Whittemore1995). The situation for drinking from a water nipple is slightly different than for feeding, as the amount of water intake will be limited by flow rate, and a linear relationship between visit duration and amount of water used was found in the current study (equation (1)). Turner et al. (Reference Turner, Edwards and Bland1999) found that even though time spent drinking declined, the water consumption increased with increased competition. These authors suggested that pigs at a low level of competition spent more time touching the water nipples without actually drinking. No difference was found between treatments in the present study and the result from the present study does not support the assumptions by Turner et al. (Reference Turner, Edwards and Bland1999).
As can be seen from equation (1), ∼2 s/visit were spent without water being used. This was mainly owing to the short delay at the beginning and end of each visit between the presence (and absence) of the pig being registered via the RFID, and the start and end of drinking. In addition, the observed water flow rate was lower than the possible maximum. This was likely caused by time spent swallowing by the pig and adjustments made to the position of the nipple in the mouth. This type of equation will therefore depend on the nipple design and water flow rate used.
Increased competition for water can increase the number of visits where pigs are forced to leave the drinker (McDonald et al., Reference McDonald, Crane, Stewart, Edwards and English1996) and increase the proportion of visits where another pig has to queue (Turner et al., Reference Turner, Edwards and Bland1999). For both treatments, the proportion of interruptions in the drinking behaviour of <30 s was highest when the number of visits was highest, but visit duration and amount of water used per visit was lowest (Table 2). The proportion of interruptions differs between treatments with the highest level in N10, even when the number of visits per pig was similar for the two treatments, indicating that increased competition increases the disturbance around the drinker. However, there appears to be two possible reasons: (1) the pig was chased away before finishing drinking or (2) as 75% of the water intake happened concurrently with intake of feed (Bigelow and Houpt, Reference Bigelow and Houpt1988) the pigs went to the feeder after drinking, and might have returned to the nipple drinker if the feeder was occupied. This study involved a higher stocking density on both feed and water in N10 than N3, and the higher proportion of drinking interruptions seen in N10 might be related to increased competition for water as well as for feed, in the latter case potentially involving behaviour redirected towards the water. Although the area in N10 was 3.1 times the regulations (0.3 m2/pig for pigs in the current weight class) and the drinker was located in a corner of the pen, the disturbance around the drinker could also have been affected by a smaller area per pig in N10 compared with N3 resulting in disturbance of drinking pigs because of the reduced space available for movement by other pigs.
Despite the low level of competition in N3, differences in drinking duration and amount of water used per visit were found between the morning and the other two periods. One reason for this might be that there is no preferred drinking visit duration; instead, it depends on time of day. However, the pattern differed between treatments, but for both treatments the highest visit number and shortest visit duration were found where the proportion of interrupted visits was highest, thereby indicating disturbance around the resource.
Conclusion
In summary, groups of pigs kept at or below the recommended pig-to-nipple ratio did not differ across the 24-h period in terms of duration of drinking, volume of water used or number of visits to the nipple, whereas the proportion of interrupted visits increased with increased competition. However, on an 8-h period level, differences in one or more of the drinking behaviour variables were observed between treatments. This should be taken into account when studying porcine drinking behaviour, where 24-h means can disguise within-day adjustments made by the animals in order to adapt to the conditions.
Acknowledgements
The experiment was financially supported by grants from The Proof of Concept Board at Aarhus University and the Danish Ministry of Food, Agriculture and Fisheries (Innovations Law, the StaldTek project). The authors would like to thank Mette Lindstrøm Bech for technical assistance and Erik Luc Decker for technical support and advice.