I. INTRODUCTION
In recent years, CuInSe2 and related chalcopyrite compounds have attracted great attention in photovoltaic materials and devices.Reference Guo, Kim, Kar, Shafarman, Birkmire, Stach, Agrawal and Hillhouse1–Reference Yamazoe, Kou and Wada6 To achieve greater success and match the optimum solar absorption spectrum, it is necessary to widen the band gap of CuInSe2 with doping gallium (Ga) or sulfur (S) element. However, the cells produced by the selenization process contain gallium only toward the back of the cells because of the principal difficulty to incorporate this element homogeneously in the film during this process.Reference Kaelin, Rudmann, Kurdesau, Meyer, Zogg and Tiwari7 For photovoltaic devices, CuIn(SexS1−x)2 (CISS) thin solid film has emerged to be the best film due to its tunable band gap via changing S/(Se + S) ratio.Reference Bandyopadhyaya, Roy, Chaudhuri and Pal8 The unit cell parameters decrease when S takes place of Se element, which leads to the increase of band gap.Reference Liu, Mitzi, Yuan, Kellock, Chey and Gunawan9–Reference Sheppard and Alberts14 However, this theoretical concept of “band gap engineering” is extremely complicated. When metal alloys are exposed to Se and/or S atmosphere, this conventional two-stage growth process is often changed to the formation of two distinct and stable CuInSe2 and CuInS2 phases.Reference Sheppard, Alberts and Bekker15 Devices produced from these double-phase absorbers exhibit inferior device characteristics. To resolve this problem, the present industrial processes include a postsulfurization step,Reference Engelmann, McCandless and Birkmire16, Reference Titus, Schock, Birkmire, Shafarman and Singh17 but this method improved a little of open-circuit voltage. The coevaporation method has been utilized to prepare the single-phase quaternary CISS film.Reference Nishiwaki, Hanket and Shafarman18, Reference Walter, Menner, Ruckh, Kaser and Schock19 Using partial selenization of Cu–In alloy and then sulfurization, Alberts et al.Reference Sheppard and Alberts14, Reference Sheppard, Alberts and Botha20 got single-phase CISS thin film by sputtering. Yan et al.Reference Yan, Liu, Jiang, Li, Xie and Zhu21 applied a two-step method consisting of partly selenizing Cu–In precursors and then exposing the partly selenized films to H2S/Ar. But these methods need vacuum equipments, thus nonvacuum methods offer an attractive alternative. One fast and simple technique is via spray pyrolysis route to synthesize CISS film.Reference Shirakata, Terasako and Kariya22 Yang et al.Reference Chung, Li, Lei, Yang, Hou, Bob and Yang23 reported a low-temperature solution-processed CISS with hydrazine. 12% efficiency CISS photovoltaic device was fabricated using a hydrazine solution process.Reference Liu, Mitzi, Yuan, Kellock, Chey and Gunawan9 But these processes are either difficult to keep low material usage or detrimental. To explore the possibility of overcoming the above disadvantages, we presented a new nonvacuum method to synthesize single-phase CISS. First, the sulfides were synthesized by coprecipitation and then partly reduced under hydrogen gas. Second, the single-phase CISS films were deposited via spin coating with precursor slurry consisting of partly reduced sulfides particles and subsequent reactive annealing method under selenium atmosphere. The structure and the optical properties of the CISS films were investigated.
II. EXPERIMENTAL
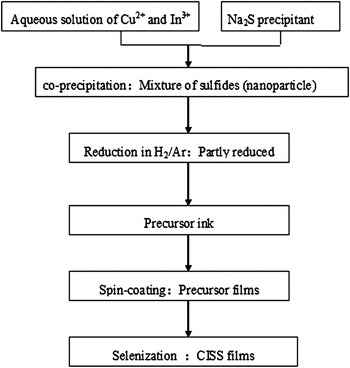
The flow diagram of CISS thin film synthesized with nonvacuum process is depicted in Fig. 1. The process contains two parts: the first part is to synthesize sulfides nanoparticle precursors and prepare precursor ink, while the other part is to synthesize CISS with postannealing process. The details of processes are described in the next paragraphs.
The flow diagram of CISS thin film with nonvacuum process.

A. Sulfides of copper (Cu) and indium (In) precursor formation
The sulfides of Cu and In were synthesized by coprecipitation. A certain amount of solutions containing polyethylene glycol 600 (AR) as dispersant and Na2S·9H2O (AR) as precipitant were dropped into a mixture of CuCl2·2H2O (AR) and InCl3·4H2O (AR) aqueous solutions placed in a three-neck flask. During dropping, the color of chlorate solutions changed from transparent to black under continuous stirring. Diluted hydrochloric acid was used to adjust the pH of solution to approximately 1.0–2.0. The reaction was maintained at 65 °C for 1 h in water bath. After the completion of washing and filtration, the precipitate was obtained. Then, the precipitate was dried in oven at 60 °C.
B. Precursor film formation and annealing process
The sulfide powder was annealed in a certain volume percentage of H2 in Ar mixture to get partly reduced powder: CuInS2and Cu–In alloys. After that, the slurry was prepared by mixing the partly reduced powder. The viscosity of slurry was adjusted by adding ethyl cellulose to be suitable for the spin coating. The partly reduced powders were deposited on glass substrates to fabricate thin layers by spin-coating process. Subsequently, the dried precursor layers were then selenized in a quasiclosed quartz chamber with two zone furnaces, which allowed separate heating of substrate and selenium. The evaporation temperature of selenium was maintained at 380 °C for 10 min. Samples 1–5 were selenized at 550, 520, 500, 480, and 450 °C for 10 min, respectively.
C. Characterization process
Phase identification was performed by x-ray diffraction analysis (TTR-III diffratometer, Rigaku, Tokyo, Japan, with Cu Kα radiation, λ=1.5406 Å). The ratio of selenium and sulfur element composition after selenization was measured by Energy dispersive x-ray spectroscopy (EDS). The Raman scattering measurements were obtained in backscattering configuration on a LABERAM-HR spectrometer (JY, Paris, France) using an Ar+laser (λ = 514.532 nm) as a light source. The optical absorption spectrum was determined by an ultraviolet–VIS absorption spectroscopy in a wave length range of 400–1500 nm.
III. RESULTS AND DISCUSSION
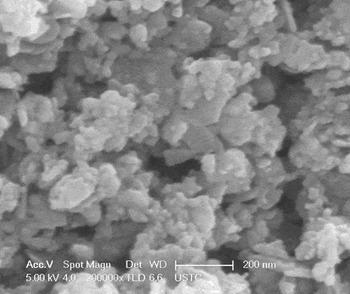
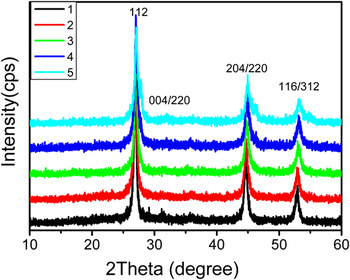
Figure 2 shows the SEM image of the Cu–In sulfides precursors produced by coprecipitation method. It can be seen that there are spherical and planar particles with nanoscale diameter, which have approximately uniform distribution of the particle size. Figure 3 shows the XRD patterns of five samples selenized at different temperatures. The prominent peaks (112), (204)/(220), and (116)/(312) indicate that the synthesized films are all chalcopyrite phases. However, the small peaks at 27.83° in sample 5, which can be indexed to CuInS2, indicate that the selenization process is partly carried on. As the annealing temperature increased up to 480 °C (sample 2) or above, the peak of CuInS2disappeared. This result suggests that the higher selenization temperature facilitates the complete incorporation of selenium vapor in precursor layer.
The SEM image of the Cu–In sulfides precursors produced by coprecipitation method.

XRD patterns of five samples selenized at different temperatures. Sample 1–5 selenized sequentially at 550, 520, 500, 480, and 450 °C, respectively.

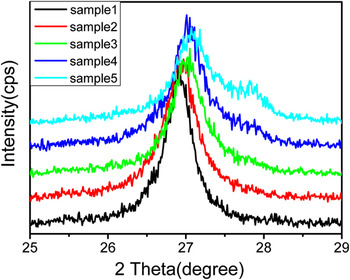
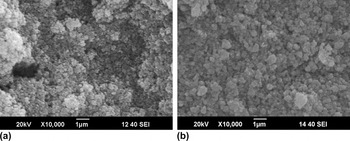
The magnified (112) peak position is depicted in Fig. 4. The full width at half maximum (FWHM) of CISS (112) peak decreased and its intensity increased as the selenization temperature increased, indicating an increase in the crystalline and grain size. In addition, the (112) reflection of CISS is symmetrical and not broadened, indicating a homogeneous single-phase quaternary alloy.Reference Sheppard, Alberts and Botha20 The precursor layer and the CISS film after the selenization at 550 °C are shown in Fig. 5. In Fig. 5(a), the film was not continuous, while the surface micrograph in Fig. 5(b) seems more uniform, dense, and better crystallinity. The photovoltaic devices are typically fabricated using a uniform absorber layer applied in solar cells to avoid the formation of undesirable shunt paths. Thus, the selenization process is in favor of obtaining CISS film with micrometer-sized uniform grain and future cell fabrication.
XRD patterns show the shift of the (112) peaks of five samples. Sample 1–5 selenized sequentially at 550, 520, 500, 480, and 450 °C, respectively.

(a) The precursor layer with reduced nanoparticle coated on the substrate and (b) the CISS film after selenization at 550 °C.

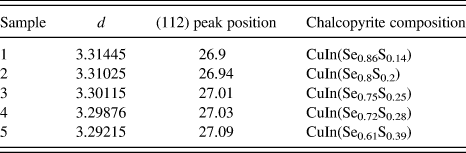
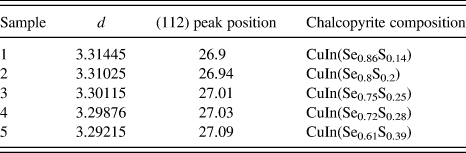
Table I shows the d value, (112) peak position, and film composition of five samples. According to the Bragg’s equation 2d sinθ = nλ, the d value is calculated from XRD data. The composition of five samples is determined by EDS. As seen in Table I, d value becomes smaller and the (112) peak position moves to higher position when selenization temperature falls down. The gradually decreasing incorporation of selenium atoms with reduced selenization temperatures induces the less lattice expansion and hence leads to the smaller d value and higher position of (112) peak. The incorporation of selenium atoms is confirmed by the EDS.
The d value, (112) peak position, and film composition of five samples.
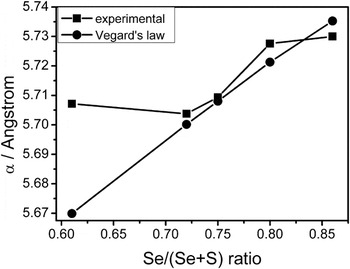
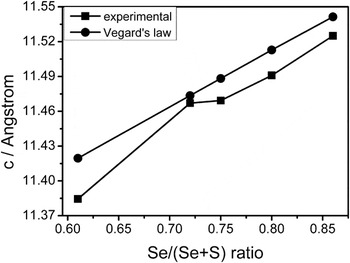
The cell parameters α and c of the CISS as a function of Se/(Se + S) ratio were also calculated from XRD data, which are shown in Figs. 6 and 7. It can be clearly seen that the cell parameters keep considerably consistent with the Vegard’s law except sample 5. The selenization process is partly carried on and thus leads to the coexistence of CuInS2and CISS phase just as what we discussed above, which may induces the wide discrepancy of cell lattices of sample 5. However, the other four samples corresponding with the Vegard’s law provide a direct experimental proof that the quaternary phase are homogeneous over a broad compositional range.Reference Wu, Wadia, Ma, Sadtler and Alivisatos4
Plot of the lattice constant α as a function of Se/(Se + S) atomic ratio of five samples.

Plot of the lattice constant c as a function of Se/(Se + S) atomic ratio of five samples.

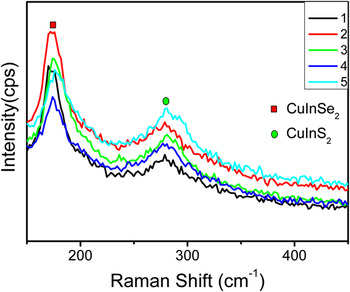
Figure 8 depicts Raman spectra of five samples selenized at different temperatures. The blueshift of the main A1 mode of CuInSe2 comparing to the relative Se–Se vibrational mode (173 cm−1) maybe due to structural defects (dislocation, twins, grain boundaries) formed in annealing process.Reference Izquierdo, Perez-Rodriguez, Calvo-Barrio, Alvarez-Garcia, Morante, Bermudez, Ramdani, Kurdi, Grand, Parissi and Kerrec24 But here, the position of the A1 Se–Se mode changing toward higher wave numbers depends on the selenization conditions,Reference Saucedo, Izquierdo-Roca, Ruiz, Parissi, BrousSillou, Grand, Jaime-Ferrer, Perez-Rodriguez, Morante and Bermudez25 despite the changing tendency is small, which probably because of the too weak change of the Se/S ratio (see Table I), and the Raman test is only for the sample’s surface. The FWHM of A1 Se–Se mode increases as the selenization temperature lowers, indicating that the crystalline quality of the CISS is poor and the changing tendency of which is correspond with selenization conditions. This result is agreed with the data of XRD.
Raman spectra of CISS thin films with different selenization temperature.

The absorption coefficient (α) can be calculated with transmittance and thickness of the film.Reference Chavhan and Sharma26 The optical band gap E ghas a relation with the absorption coefficient, i.e.:
 $$\alpha = {\raise0.7ex\hbox{A} \!\mathord{\left/ {\vphantom {A {h\nu }}}\right.\kern-\nulldelimiterspace}\!\lower0.7ex\hbox{{h\nu }}}(h\nu - E{\rm _{\rm g})^{{1 \over 2}}\quad ,$$
where A is a constant, hν is the radiation energy, and E g is the corresponding band gap.Reference Kang, Kim and Sung27 In addition, another equation about optical band gap is:
 $$E{\rm _{\rm g}} = 1240/{\rm{\lambda }}\quad,$$
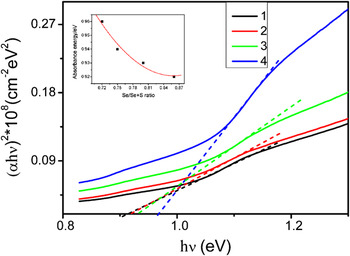
where λ is the wave length at absorption peak.Reference Xiao, Xie, Xiong, Tang and Qian28Equation (1) can be written as  $E{\rm _{\rm g}} = h\nu - ({\rm{\alpha }}h\nu )^2 /A^2 $ from which E g can be calculated. Figure 9 shows the plot of the experimental (αhν)2 against hν of four samples (sample 5 is not single-phase CISS and thus was excluded). The intersection point of the tangent and x-axis is the optical band gap. The absorption energy E g versus Se/(Se + S) ratio is shown as an inset of Fig. 9. The optical band gap does not vary linearly with Se/(Se + S) ratio but rather follows a parabolic behavior. The energy band gap decreases as Se/(Se + S) ratio increases, which changes as a smooth curve with the variation of composition. All these aspects indicate that the CISS layers from sample 1 to sample 4 are homogenous in composition. The band gap is narrow in general due to the smaller percentage of sulfur (<50%), which was caused by poor crystalline quality of CISS layers. However, the experimental optical energy band gap is lower compared to its corresponding sulfur content. The reason is probably attribute to the defects formed in selenization that lead to carrier recombination, which needs to be investigated in future. CISS as the absorber layer has adjustable band gap so as to achieve optimal spectrum, which is beneficial for improving cell conversion efficiency. After the preparation of CdS buffer layer and ZnO window layer on the absorber layer, we could fabricate a complete solar cell and test its photovoltaic performance.
Plot of (αhν)2 against hν of four samples: Samples 1–4 selenized sequentially at 550, 520, 500, and 480 °C, respectively. The inset is the plot of the absorbance energy versus Se/(Se + S) atomic ratio.

IV. CONCLUSIONS
CISS thin film is synthesized by selenization of sulfides nanoparticle precursors via a nonvacuum relatively easier spin-coating method. A single phase with homogenous composition CISS can be synthesized after proper selenization temperatures. XRD and EDS data show that the single (112) peak position changed with the variation of Se/S ratio, which proves single-phase CISS with homogenous composition. The cell lattices α and c calculated from XRD data are coordinated with the Vegard’ law. The Raman spectroscopy indicates that only the main mode of CuInSe2 and CuInS2 exist in these samples, which means that the samples are single phase. The band gap E gchanges with Se/(Se + S) follow a parabolic behavior, which proves the homogenous composition of CISS. In a word, this paper reports a low-cost nonvacuum process for synthesizing single-phase CISS films by selenization of sulfides nanoparticle precursors, which indicates a promising way for the application in solar cells.
ACKNOWLEDGMENT
The experiment is supported by Knowledge Innovation Project of The Chinese Academy of Sciences (Grant No. KJCX2-YW-M11).