

In the period from 1877 until the outbreak of World War I, Sweden, Denmark and Norway constituted a currency area – the Scandinavian Monetary Union (SMU).Footnote 1 They shared the same unit of account, the gold krone. Both full-bodied gold coins and token coins of the three countries served as legal tender and circulated freely within the union. Initially set up to preserve the traditional circulation of neighbouring coins in the border regions, the central bank cooperation was extended to a mutual settlement mechanism (1885) and later reciprocal acceptance of notes at par (1901).Footnote 2 A desire for economic integration was present under the surface of this practical approach, mirroring the predominant liberal worldview of the 1870s. For instance, the Norwegian government saw a common coinage as an instrument for ‘knitting together the three nations to a single commercial territory’.Footnote 3 In the parliamentary debate on Norwegian entry into the union a supporter argued that ‘the real objective of unity in coin had to be to bring the countries closer together’.Footnote 4 Thus, from the outset, the SMU was a combination of practical arrangements and lofty ambitions.
Over the past 15 years, the experiences of early monetary unions, including the SMU, have attracted increased attention. Influenced by the prospects of the introduction of the Euro, scholars set out to examine whether the present could be provided with a lesson from history.Footnote 5 However, no clear verdict on the SMU has emerged. Most believe that deeper monetary integration in Scandinavia had some impact, but the views with regard to scale and scope remain divided.
This article highlights the importance of the monetary union in fostering financial integration. Low transaction costs brought about by the convention and subsequent amendments were particularly important for the financial sector while they had little impact on the flows of goods and services. Thus, the argument presented here is that the real significance of the Scandinavian Monetary Union is not found in the area of trade but rather in the facilitation of a more deeply integrated Scandinavian market for short-term credits. This implies a new understanding of the monetary union. Earlier studies have touched upon the question of financial integration, but have mostly discarded the notion because of the allegedly small volumes involved. This article demonstrates that the sums involved must have been substantial and examines further the nature of the Scandinavian money market.
I
The standard point of departure for anyone interested in the SMU is still Nielsen's seminal study from 1917.Footnote 6 He highlights the importance of the supplementary agreement of 1885 that allowed the public to buy drafts on the two other countries from their domestic central bank, and made the banks keep parts of their gold reserves as interest-free deposits or credits with their partners. The result was a drastic reduction in the volume of gold flows in Scandinavia. Some figures illustrate the point: in the period 1879–84, Denmark experienced gross gold flows of 91.5 million kroner with Norway and Sweden. In the subsequent two decades there were no gold flows whatsoever between Nationalbanken (Denmark) and Riksbanken (Sweden). In the same period, the gross transfers of gold between Nationalbanken and Norges Bank (Norway) amounted to 7.1 million kroner and 7 million between Riksbanken and Norges Bank. Moreover, Nielsen claimed that the settlement mechanism and the fact that the drafts were free of surcharge resulted in a narrowing of the gold points in Scandinavia.Footnote 7
Nielsen admits that it is difficult to estimate the impact, but claims that ‘the monetary union undoubtedly played a great part in facilitating the prevailing strong trading relationship’.Footnote 8 Furthermore, he argues that the settlement mechanism had been used intensively for transfer of capital and interest rate arbitrage. The result was a ‘special Scandinavian money and capital market’. The principle of provision-free drafts was lifted in 1905 (effectively from 1910). According to Nielsen, this reflected how sensitive this market was to interest rate changes in one of the countries, and that the move was influenced by a desire on the part of the central banks to reduce the pressure on their metallic reserves.Footnote 9
As a Dane, Nielsen focuses on the effect of changing economic fortunes for Denmark after 1905. The Danish balance of trade deteriorated as Swedish exports to Denmark increased greatly while its imports stagnated. At the same time, Norway entered a period of strong economic growth fuelled by direct foreign investments. From 1905 until the outbreak of war, some 40 million kroner in gold was shipped from Copenhagen to Stockholm and Christiania. Even Norway had to send some gold to Sweden and, as a result of the increasing imbalances, Denmark and Norway introduced surcharges on drafts.Footnote 10 The result was a reduced volume of drafts and, as notes were still accepted at par, an increase in settlement by sending notes.Footnote 11 This tendency was strengthened when the Danish and Norwegian charges were raised above the so called ‘note points’, the postage cost of sending notes between the countries.Footnote 12
Nielsen also emphasises that the financial flows were limited, since all the three countries were net importers of capital, but argues that they nevertheless contributed to creating a Scandinavian market.Footnote 13 He also draws attention to the impact of foreign borrowing of one country on the capital market of the others. Public borrowing in the European market by one country led to a temporary overflow of liquidity that ‘spilled over’ to the neighbouring market. Until 1906, Denmark was a ‘transitional market’ for capital flows to Sweden and Norway. This was later reversed, as Denmark tried to extract capital from the two other countries.Footnote 14
The Scandinavian Monetary Union has often been assessed in the light of other monetary unions of the nineteenth century, notably the Latin Monetary Union (LMU). Bartel claims that ‘The Scandinavian Monetary Union was the most successful of the pre-World War I monetary unions. It lasted for over forty years and over that period demonstrated remarkable stability and effectiveness.’Footnote 15 In explaining the success of the union, Bartel points to how exchange rate stability facilitated note circulation and central bank clearing. Moreover, he attributes the success to structural similarities and the strategic positions of the three countries. They were all agricultural economies where extractive and forest industries supplemented farming. Extensive fisheries and maritime connections were also common features. Furthermore, as none of the countries were financial centres they were somewhat sheltered from the unsettling effects of massive capital flows. Arbitrage operations were limited and made monetary management easier.Footnote 16
Bergman, Gerlach and Jonung discuss the SMU in the light of present European monetary integration.Footnote 17 They estimate the effect of the monetary union on prices, money supply and exchange rates. Their conclusion is clear: ‘the empirical evidence suggests that money supplies, inflation rates and discount rates in the member countries of the Scandinavian Currency Union behaved very much as economic theory would predict’.Footnote 18 This study is flawed by failing to make a clear distinction between effects of the SMU and what could rightly be attributed to the gold standard. All the above observations are likely to occur under a fixed exchange rate system. For all Scandinavian countries, the rest of the gold standard area had greater significance with regard to both trade and capital than their neighbours; and the observed effects were very likely that of the gold standard. Jonung, in a later paper, admits that ‘it is difficult to segregate the effect the Scandinavian Monetary Union had beyond that the gold standard predisposed’.Footnote 19
Flandreau and Maurel attempt to do exactly that. Using a gravity model they estimate the impact on trade of different monetary unions under the gold standard period. For Austria-Hungary, which did not adhere to the gold standard, monetary union was associated with a three-fold increase in bilateral trade. For the LMU and the SMU, the effect of monetary union is estimated on top of the gold standard. While the LMU did not add to bilateral trade, the SMU ‘displayed a substantial trade bias’, with a combined effect of the gold standard and monetary union dummies close to the Habsburg effect. Flandreau and Maurel implicitly rank the monetary unions according to tightness, with the LMU at the bottom and Austria-Hungary at the top as a proper monetary union. The SMU is ranked in between, but closer to Austria-Hungary as a ‘quasi monetary union’ which almost eliminated exchange rate fluctuations. Thus, they argue ‘tighter monetary integration in the 19th century was associated with higher trade integration, ceteris paribus’.Footnote 20 These findings contradict Flandreau's earlier claim that ‘the important conclusion is that it is impossible to identify any Latin Union or Scandinavian Union … [trade] bias’.Footnote 21
Flandreau's study of the Austria-Hungary monetary union underlines the differing structures of the nineteenth-century currency unions. Moreover, he quite correctly emphasises the dangers of using the past monetary unions as an analytical parallel to the present European experience ‘because of deep, structural differences’. The sole exception is the experience of Austria-Hungary that enjoyed both a common central bank and was a part of a customs union, thus providing a ‘theoretical equivalent for modern EMU’. The LMU and the SMU, on the other hand, had neither a common central bank nor a customs union, and should, Flandreau argues, ‘be called “common currency areas” rather than unions in a modern sense’.Footnote 22
Henriksen and Kærgård are more ambiguous than Bartel and Bergman et al.: ‘While clearly successful as a currency union, its performance as an economic union was less convincing.’Footnote 23 They are furthermore not persuaded by Nielsen's assessment of the SMU as a vehicle for economic integration. They show that in the case of Denmark, trade with the other partners actually declined relative to total foreign trade. They also caution against using the sum of giro payments and discount-rate convergence as an indication of an emerging inter-Scandinavian money market. The lack of weekly balance sheets which could enable an examination of the immediate effects of a change in the rate in one country upon the other two makes this difficult. Furthermore, they agree with Nielsen that the sums drawn from one country to another could ‘hardly be large’ in any case.
Henriksen and Kærgård emphasise the practical nature of the union. When the union functioned at its best, it was ‘a complete system of coin, banknotes and common drawing rights’. However, in their eyes this optimal functioning of the union only lasted for four years, from 1901 to 1905. Their verdict is one of caution:
The Currency Union was a success in its own limited monetary terms. The Union, however, was only of minor importance in the total foreign relations of the member countries. Moreover, the trade between the members composed only a small part of their total trade, and this was declining during the lifetime of the Union. The monetary union was never accompanied by a tariff union as well. This stresses its partial nature – it never formed a vital part of these countries' international economic relations.Footnote 24
Talia argues that the widening of the union in 1885 to include a clearing mechanism was ‘a very distinct example of an institution created to reduce transaction costs’.Footnote 25 This kind of monetary cooperation involved a trade-off between financial efficiency and economic vulnerability.Footnote 26 By 1905, the perception of vulnerability had increased as the Riksbanken believed that the mechanism was primarily used to facilitate foreign arbitrage operations and short-term advances between private banks. The impact of the mechanism on trade had only been modest. Correspondingly, when the union between Sweden and Norway was dissolved that year, the Riksbanken used the opportunity to re-negotiate the clearing mechanism in order to make it less efficient (i.e. introduce transaction costs).Footnote 27 Analysing the trade and cheque balances of Denmark and Sweden, Talia finds that there is weak correspondence between the development of the variables both with regard to direction and overall size. From 1905 onwards, Sweden ran a trade surplus while its chequing balance remained in deficit. For a number of years the two variables even moved inversely. These findings indicate that trade was not the basis for all the flows of funds. Talia argues that it is reasonable that these flows also involved interest or exchange rate arbitrage.Footnote 28 Furthermore, he finds evidence that the clearing mechanism increased market efficiency significantly as the mean of the absolute price differential for sterling bills between Copenhagen and Stockholm decreased from nearly 5 øre for the 1879–88 pre-clearing period to 0.5 øre for the period 1889–1914.Footnote 29
Thus, the verdict on the SMU is not clear. Some studies clearly attribute to the union effects which are more reasonably understood in the light of the gold standard. It remains to be tested whether there was an even further integration with regard to the development of the money supply, inflation and interest rates in Scandinavia than was the case for the whole of the European gold standard area. Nevertheless, when it comes to inter-Scandinavian foreign exchange rates it is obvious that the settlement mechanism and reciprocal note acceptance at par effectively reduced the ‘gold points’ even further.
With respect to the debate on the relevance for current monetary unions, both Flandreau and Henriksen and Kærgård have made the valid suggestion that the union must be assessed on its own limited monetary terms. Indeed, the term ‘monetary union’ implies a kind of macroeconomic thinking and policy coordination that was quite alien before 1914. Applied with regard to the classical gold standard, the term ‘macroeconomic coordination’ is rather absurd, although it has been used in the past, notably by Charles Kindleberger.Footnote 30 The gold standard did not emerge as a result of a grand design, but from the very fact that individual countries chose gold as their external anchor. Prior to 1914, an international monetary regime was not sustained from above, but through decentralised adjustment in the market, strong common normative structures for central banking derived from economic liberalism and a generally benevolent framework.Footnote 31 The contact between the central banks beyond that which followed from managing the practicalities of the union was limited.Footnote 32
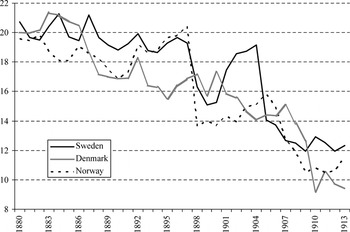
Henriksen and Kærgård rightly underline the practical side of the union. Although important for reducing transaction costs for commerce, this did not give sufficient incentives to promote trade or ‘knitting together … a single commercial territory’. They pinpoint the lack of a customs union among the three countries in understanding the failure to achieve further integration, a point also stressed by Flandreau. Although Flandreau and Maurel argue that Scandinavian monetary integration was associated – ceteris paribus – with increased trade, the relative share of intra-Scandinavian trade in fact fell significantly for all three countries in the period 1880–1913. Figure 1 displays the diminished overall importance of the two neighbours for each of the three countries.
Gross intra-Scandinavian trade as a percentage of each country's total foreign trade, 1880–1913
Source: B. R. Mitchell, International Historical Statistics: Europe, 1750–1993, 4th rev. edition (Basingstoke, 1998), computed from tables E1 and E2.

From an overall level of around 20 per cent for all three countries in 1880, intra-Scandinavian trade by the end of the period constituted only between 10 and 12 per cent of all trade. Although there is some noise in the data, notably an overestimation of exports in the Swedish data prior to 1894 and inclusion also of transition trade between Norway and Sweden in the Norwegian data until 1906, the trends are clear: during the lifetime of the SMU, the relative importance of intra-Scandinavia trade fell considerably.Footnote 33 A closer examination of the data reveals important differences that further undercut the trade bias of the SMU: Swedish imports – measured in current prices – from Norway increased by only 23 per cent from 1880–3 to 1910–13, while its overall imports increased by 155 per cent. In the same period, the nominal value of Swedish imports from Denmark actually declined by 10 per cent. On the other hand, the increase in Swedish exports to Denmark was just below the overall export growth rate while for Norway it was above. The increase in Danish–Norwegian bilateral trade was lower than the overall growth rate. The explanation for these differing trends is straightforward: Sweden developed manufacturing industries that found customers with its neighbours; Norway and Denmark did not.
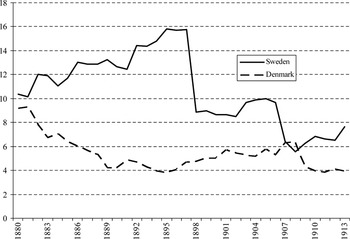
The strong trade bias found in Flandreau and Maurel's excellent study is surprising in the light of the relative decline in trade discussed above and needs some further exploration. If there exists, albeit ceteris paribus, a trade bias of this magnitude, the forces that reduced trade must have been substantial. A closer look at the Norwegian case might reveal both why Flandreau and Maurel arrived at their result and explain why this must be wrong. Figure 2 illustrates a clear pattern of relative growth in the importance of Sweden in Norway's external economic relations from 1880 until 1897, following a trend that had been visible from the late 1860s. In their model, Flandreau and Maurel operate with the variable distance. However, this is very much a static variable that does not take into account improvements in the means of communication. In 1865, the first cross-border railway line between the Norwegian capital Christiania and Sweden was opened; in 1879 an additional southbound line was established from Christiania to Sweden and finally, in 1881, a direct line linked the most important town in the middle of Norway, Trondhjem, with Sweden. In qualitative terms the distance between Norway and Sweden was much less at the onset of the 1880s than it had been fifteen years earlier and must have provided a strong impetus for trade.
Gross trade with Sweden and Denmark as a percentage of total Norwegian foreign trade, 1880–1913
Source: B. R. Mitchell, International Historical Statistics: Europe, 1750–1993, 4th rev. edition (Basingstoke, 1998), computed from tables E1 and E2.

Another variable with a strongly negative impact on trade in the model used by Flandreau and Maurel is protection, measured as a ratio of customs revenues to total trade. This might constitute a flaw in the model in the case of Norway, where two-thirds of customs revenues were raised for fiscal reasons on items like coffee, wine, liquors, sugar and tobacco. Moreover, with respect to Sweden and Norway, the model does not take into account that the two countries constituted a free-trade area between 1874 and 1897; i.e. there were no internal tariffs, but each country had the freedom to set external tariffs independently. The free-trade agreement must also have provided a strong impetus for trade in this period. However, its limited scope meant that its end was inevitable. Sweden, the more protectionist of the two, believed Norway had developed into a transit harbour for avoiding its stiffer tariffs. Allegedly, Norwegian exports to Sweden consisted partly of goods from the metaphorical ‘shirt-pin industry’; shirts were imported into Norway and re-exported to Sweden after adding a pin to qualify as Norwegian goods. In 1895, and effectively from 1897, Sweden unilaterally revoked the union. Trade between the two countries fell significantly in the aftermath, giving some credit to the Swedish claims. Registered trade fell even further after 1906 when goods in transit were no longer included in the official Norwegian trade statistics. Thus, this piece of evidence is important both for understanding the pattern of development of Swedish–Norwegian trade and as a warning against relying too strongly on aggregated trade figures to assess the depth of trade integration on the Scandinavian peninsula.
The fact that trade declined also undermines Bartel's assessment of the structural similarities as the key to increased integration. Although he overstates the case with regard to shipping and fishery, those similarities which stand up to closer scrutiny actually contributed to limit the scope for trade integration. In particular, Norway and Sweden exported many of the same articles and were in fact competitors in international markets, notably so in the case of forestry products.
II
In search of the real significance or contribution of the monetary union, one has to look in another direction. The arena of finance and capital is a promising venue in that respect. The fact that the union had some implications for financial markets is well known. The extent and scope, however, are not properly identified. A number of studies argue that the clearing mechanism of the union was used for short-term financial operations. Nielsen claimed that the mechanism fostered a ‘special Scandinavian money market’. Henriksen and Kærgård argue for caution on this point. Talia argues that the perception that the mechanism was used primarily for financial operations led the Riksbanken to discontinue the policy of drafts free of charge. However, he does not provide us with data to support his position that the flows were of such a magnitude that it led the Riksbanken to change policy. Neither does he treat financial market integration as one of the great achievements of the union but, rather, regards integration more as a governance problem. Financial integration was undoubtedly not one of the initial ambitions of the union or the clearing arrangement. Nielsen and Talia illustrate that the financial flows were regarded by Nationalbanken and Riksbanken as a governance problem. Moreover, Norges Bank complained that the lack of supervision over the international placements of the private banking sector represented a problem in the formation of monetary policy.Footnote 34 However, neither the initial ambitions, nor the ambivalence of central bankers should be given much weight in assessing the importance of the monetary union for financial integration. This integration ought to be evaluated on its own terms.
Ideally, a proper examination of the impact of the SMU for financial integration should rest on solid data where the flows of capital are unmistakably identified and the causality unambiguous. Unfortunately, no comprehensive data exist on short-term financial flows. In the absence of sufficient data the historian can either give in or try to construct an image of the past from the scattered sources available. This article uses Norwegian data to do the latter.
The first approach in the examination is a theoretical one and concerns the nature of the monetary union: why was the union established and what kind of impact would we expect? Having answered that question, the next issue is to analyse the data on Norwegian transfers through the clearing mechanism of the union, in the light of the trading relationship with the two neighbours. The findings derived from the examination are further explored in the light of qualitative sources that might illuminate the extent and nature of financial integration in the area. These approaches serve as the basis for my concluding argument.
III
The union was a product of the desire for economic integration that marked the peak of economic liberalism around 1870.Footnote 35 When the prospect of universal coinage lost ground in the aftermath of the Franco-Prussian war, the Scandinavian countries wanted to safeguard some of the benefits of monetary integration by establishing a common currency area. The benefits were clearly identified as lower transaction costs that could serve as a vehicle for trade integration. In retrospect, what kind of effects would we envisage from the union?
The convention only made coins legal tender within the union, but had little impact beyond providing for free circulation in the border regions. None of the countries had any tradition for the circulation of full-bodied coins and domestic exchange was dominated by notes. Legal tender status for gold coins led to the abandonment of re-minting, but only to a partial narrowing of the exchange rate as gold shipments were still subject to freight and insurance costs. The real breakthrough with respect to transaction costs materialised with the introduction of the clearing mechanism and the acceptance of notes at par. Thus, the initial convention was not sufficient to provide much momentum for integration.
Transaction costs influence the flows of goods, services and capital, but their impact differs according to the level and character of the costs involved. Transport costs and tariffs are clearly important for the flows of goods, but do not affect financial flows directly. The effect of abandoning the gold points between the three countries was minor compared to the value of goods, and had little impact on the profitability and competitiveness of cross-border trade. The direct train links between Norway and Sweden, the telegraph, improved steamship technology and changes in trade policy were probably much more important in that respect. However, even if we take into account these more forceful vehicles for commercial integration, the relative level of trade between the countries declined. Thus, the reduction of constraints is not sufficient to produce increased integration if the involved markets are too limited or too similar to create a natural trading unit, or at least complementary markets. Drafts between the central banks free of charge were convenient, but not decisive, for trade.
However, for financial transfers these charges were of importance. The SMU had probably no impact on the flow of long-term capital, as the existence or not of a commission in the region of a quarter or one-eighth of a percentage point had little influence on the profitability of a long-term investment. The SMU was hardly the decisive point when the Swedish Wallenberg family invested heavily in Norwegian industry. The general credibility and the absence of major foreign exchange risk expectations evident under the gold standard were more important for investor confidence. However, for short-term financial operations, the size of the commission was pivotal for profitability, independently of whether or not the source of the operation was foreign exchange arbitrage, interest rate arbitrage or merely a question of placing unemployed funds for a short duration. Thus, from a point of purely theoretical reasoning, the mechanisms of the union benefited short-term finance the most.
IV
What remains to be examined is whether the theoretical expectation fits the evidence: did the union actually foster increased financial integration? Financial integration can be measured in a number of ways. One is to examine the development of interest rates and prices of comparable financial assets across countries. Convergence over time will then give an indication of increased integration. In measuring Scandinavian financial integration this approach might be problematic. These countries can all be regarded as satellites under London. Thus, any convergence between the three countries might be in response to the gold standard regime rather than expression of any particular Scandinavian integration. Nonetheless, the development of Scandinavian interest rates will be examined below. Another measure is the extent of legal and other barriers to capital flows. During the period in question there existed no legal impediments to short-term capital flows, although Norway enacted some regulations on foreign ownership of natural resources, notably waterfalls, in the years before the war. As the earlier discussion has made clear, the settlement mechanism reduced the non-legal barriers for financial transfers considerably. However, this represents merely an opportunity. In order to examine whether this opportunity was actually exploited, the extent of financial flows under the clearing arrangements of the union will be used as a measure of financial integration. This approach has some weaknesses. One is the question of data, which will be discussed below. Another is the question of level of integration. The development of flows can say something about trend, i.e. whether the union led to increased financial integration or not. This, taken together with qualitative evidence presented in the next section, can tell us something of how the national and Scandinavian money markets worked. What this approach can not reveal is exactly how integrated the national markets became.
No coherent data for short-term financial flows exist for Scandinavia prior to 1914. However, Norwegian annual data for transfers from Norges Bank to Nationalbanken and the Riksbanken and vice versa for the period 1889–1913 are available. These include all transfers between the three banks: drafts, redemption of notes, giro payments as well as the actual flows of gold used to settle persistent imbalances under the clearing mechanism. The latter points to the fact that the reciprocal credit lines the banks extended to each other were limited, and that transfers over time had to balance. As the initial aim of the union was to promote trade, I have compared these transfers with data for Norwegian trading with Sweden and Denmark in the same period. The trade data includes all bilateral exports and imports, but not services.
The hypothesis was that the level of transfers might exceed the underlying level of trade. This discrepancy – transfers not explained by trade – would then give an indication of the extent of financial transfers.
The analysis of the data presented here clearly confirms initial expectations. For the whole period 1889–1913 transfers – both inbound and outbound – through Norges Bank amounted to 3,286 million kroner. In the same period Norwegian trade – both imports and exports – with Denmark and Sweden amounted to 1,807 million kroner. Thus, if all Scandinavian trade had been settled through the mechanism of the union, only 55 per cent of all transfers can be attributed to trade. However, some payments for trade obviously must have been settled outside the central banks, typically through bilateral clearing between trading houses, so this figure is probably lower. But as the union – at least until 1910 – was the most efficient and least costly way of transferring purchasing power across borders, these sums were probably limited. Except for the period after the reintroduction of charges on drafts they have no impact on the analysis.
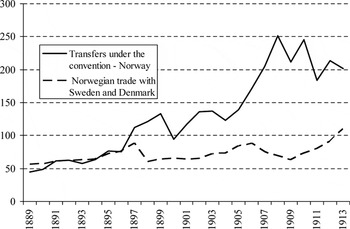
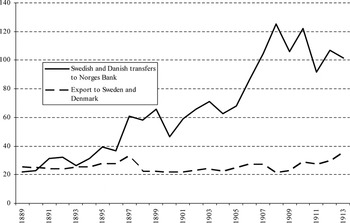
Figure 3 illustrates the development of transfers and trade. Some trends are evident. From 1896 onwards the level of transfers is constantly higher than required to cover trade. There is also a tendency for transfers to increase more rapidly than trade. Some of the residual between transfers and trade might be explained by freight services, but not by much as the earnings of the merchant navy were chiefly in sterling. The residual is thus an indication of the level of financial – predominantly short-run – movements. Here a disclaimer might be in order: the figures for transfers before and after 1909 are not comparable as there was some double counting prior to 1910. At least some of the reduction in the transfer volume that year can be explained by the elimination of this source of error.Footnote 36 However, despite this weakness in the data, the extent and development of transfers not explained by trade are clearly recognisable. These patterns also correspond nicely with our knowledge of the economy in this period. The peak in the late 1890s coincides with the real-estate boom in Christiania, a boom partly fuelled by extensive rediscounting abroad by the private banking sector. The later peak, the period after 1906, was a period characterised by massive long-term capital imports to fund the rapid Norwegian industrialisation drive. Some of these funds were clearly recycled in the Scandinavian short-term money market. After 1910 transfers unexplained by trade fell. This can be explained by the reduced profitability of the clearing mechanism for financial transfers due to the Danish and Norwegian introduction of surcharges on drafts from 1910 onwards, as well as some effect from the removing of double counting.Footnote 37
Norwegian SMU-transfers and Norwegian trade with Sweden and Denmark, 1893–1913 (m. NOK)
Source: Central Bureau of Statistics of Norway, Statistical Surveys 1948, tables 123 and 124; Norges Bank, Annual reports 1890–1914.

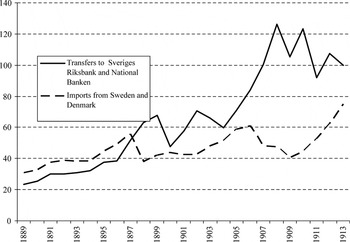
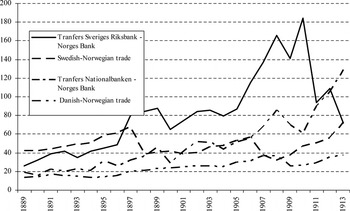
Figures 4 and 5 illustrate the development of inbound and outbound transfers compared with Norwegian exports and imports. The flows of transfers follow the same pattern with regard to development and overall size, which is unsurprising given that the clearing mechanism had to balance over time, and persistent imbalances had to be covered by gold shipments. However, there is a puzzling discrepancy between inbound and outbound transfers with regard to how much of the flows can be explained by trade. For the whole 25-year span, 70 per cent of transfers from Norges Bank were used to settle imports, while only 39 per cent of transfers to Norges Bank were used to pay for exports. Over the whole period 1897–1913, the difference totals 420 million kroner. How can we account for this? The difference seems to be persistent and structural in nature. Operations in the short-term money market are not a likely explanation, as these had to balance over time. The source for some of the difference might be long-term capital flows to Norway, particularly Swedish investments, but these hardly account for all of the discrepancy. If that had been the case, Swedish investment would have constituted 60 per cent of net capital imports in the period, which is far too high a level. A more likely explanation is foreign exchange arbitrage: Norway enjoyed a structural surplus of sterling bills due to its considerable shipping revenues. This surplus was too large to be absorbed by the domestic market and the evidence suggests that the surplus was traded in Swedish and Danish markets.Footnote 38
Norwegian transfers to Riksbanken and Nationalbanken, and Norwegian imports from Sweden and Denmark, 1889–1913 (m. NOK)
Source: Central Bureau of Statistics of Norway, Statistical Surveys 1948, tables 123 and 124; Norges Bank, Annual reports 1890–1914.

Swedish and Danish transfers to Norges Bank and Norwegian exports to Sweden and Denmark, 1889–1913 (m. kroner)
Source: Central Bureau of Statistics of Norway, Statistical Surveys 1948, tables 123 and 124; Norges Bank, Annual reports 1890–1914.

As noted above, Sweden was a more important trading partner for Norway than for Denmark. This is also reflected in the level of transfers: with the exception of 1913, the Swedish–Norwegian transfers surpassed the Danish–Norwegian transfers in every year. However, with regard to the level of transfers that cannot be explained by trade, there are some important differences between the Norwegian relationship with Denmark and Sweden respectively. Transfers to and from Denmark were constantly higher than necessary to cover trade. Moreover, both in absolute and relative terms, unexplained transfers show an even pattern of growth throughout the period.
For the relationship with Sweden, the growth pattern was more irregular – with upward peaks in the late 1890s and then again from 1906 onwards. Moreover, in the case of Sweden, transfers do not surpass trade until 1897. Does this imply that Sweden started to use the settlement mechanism for financial transfers later than Denmark? The answer is in all likelihood no. Norway was until 1897 a transit country for Swedish imports. In cases where Swedish tariff-jumpers owned the goods during the transit period, they probably settled directly with the exporters without involving the Scandinavian settlement mechanism. Thereby the need for actual payments for goods between the two countries was lower than the official trade figures suggest. The extent of transfers not explained by trade, and thus an indication of financial transfers, is probably underestimated for the free-trade area period, compatible with the large increase in unexplained transfers in the wake of the abandonment of the free-trade agreement. This reduces the impact of the startling increase in unexplained transfers after 1897 shown in Figure 6. The late 1890s, nonetheless, witnessed a marked increase in the use of the union for financial purposes. After a peak in 1906–10, the number of Swedish–Norwegian transfers fell sharply, reaching rock bottom in 1913. In the same period, the number of Danish–Norwegian transfers rose significantly. How can we explain these changing fortunes? Not by trade, which grew for both countries. A more likely explanation is the effect of the introduction of charges on drafts on the profitability of the transfer mechanism, as well as the weakening of the Danish economy.
Transfers and transfers not explained by trade, by country, 1889-1913 (m. NOK)
Source: Central Bureau of Statistics of Norway, Statistical Surveys 1948, tables 123 and 124; Norges Bank, Annual reports 1890–1914.

This examination shows that the sums transferred under the clearing mechanism markedly overshadowed the trading relationship between Norway and its neighbours. For some years, funds transferred from Sweden (1908) and Denmark (1912–13) to Norway through the mechanism were six and even seven times the underlying trade volume. Moreover, it also demonstrates that the sums involved were not negligible, as claimed by Henriksen and Kærgård. In the peak years 1907–10 the level of transfers which can be attributed to the financial sector was above 10 per cent of Norwegian GDP. Although small compared with the short-term flows of the global financial economy at the dawn of the twenty-first century, these were substantial in a contemporary perspective. The examination also testifies to the importance of transaction costs: when the clearing mechanism was made more costly, the Swedish use of it fell drastically and the difference between transfers and trade narrowed. From 1910 onwards, Sweden also became a net exporter of capital, which indicates that the liquidity problems in the short-term money market were probably smaller than in the previous period.Footnote 39 However, for Denmark the usage increased greatly in the same period and must be seen in connection with a more strained domestic money market.
V
The settlement mechanism represented an opportunity for increased financial integration. The discussion in the previous section demonstrates that this opportunity was exploited to a larger extent than recognised in earlier studies. What remains is to assess the importance and nature of financial integration, in particular the relationship with the domestic money market.
During the course of the four decades of monetary union, the Scandinavian countries did not become one integrated financial market. Differing financial structures, differing business cycles and the lack of wider institutional frameworks to support broader economic integration are aspects that help explain the limits of integration. Although the three markets clearly became more integrated, distinct national characteristics remained.
For Norway, the least populous and smallest economy in Scandinavia, financial integration was probably more important than for its neighbours. In European terms, Norway was a late developer with regard to finance. The first commercial bank was not established until 1848 and the financial hegemony of Hamburg was not broken until 1857. In the aftermath of the international financial crisis that year, and with the maturing of the financial sector, funding of commerce was gradually taken over by domestic banks. Foreign operations constituted a part of the activities of the emerging commercial banking sector from the start. Banks established correspondent relationships in the most important markets. Increasingly, foreign markets—in particular the Danish and Swedish—were used for foreign exchange arbitration motivated by both profit and a levelling of the seasonal differences in the Norwegian demand and supply of foreign currency. Gradually the relationship between the banking sectors in the three countries became more closely interwoven.
A network of contacts and lending existed between Scandinavian banks even before the establishment of the union and the subsequent adoption of the clearing mechanism. Thus, a reasonable question which ought to be addressed is the issue of reverse causation; i.e. embryonic financial integration causing institutional arrangements like the SMU-clearing mechanism, rather than the other way around.
Trade was the economic argument for both the establishment of the SMU and the subsequent clearing mechanism.Footnote 40 Except for the argument heard in the early 1870s that the union would facilitate arbitrage in non-Scandinavian currencies, financial integration arguments were not used by central bankers or legislators. That the union came to serve as a vehicle for financial integration should be regarded as an unintended consequence. Moreover, following the argument of Talia, this outcome must have been regarded as an adverse effect by central bankers. Thus, the case for reverse causation is weak. The purpose of the institutional arrangements was not financial integration. However, when the institutions were in place, economic agents swiftly realised their inherent potential.
The origin of the early Scandinavian money market was the seasonal variations in the demand for money. In all the three countries the demand had a strong recurring seasonal character that reflected both the differing levels of economic activity throughout the year and the impact of the major days of settlement. In Sweden, the seasonal variations reflected the annual harvest and the sailing season, the period when Swedish harbours were free of ice. In Norway, the northern fisheries, the annual timber market and the harvest and import season created peaks in monetary demand. Importantly, the seasonal peaks in demand differed. Thus, even before the launch of the clearing mechanism in the late 1880s, the major Norwegian banks had regularly shifted capital abroad at short notice to accommodate Swedish and Danish peaks. Most noticeable were the annually recurring transfers to Copenhagen in connection with the two major Danish settlement days, 11 June and 11 December – the latter referred to sardonically by the Danes as ‘Old Nick's birthday’.
The clearing mechanism of the SMU reduced the costs of such transfers and increased the profitability of the operation. Undoubtedly such transfers would have continued to take place even without the clearing mechanism, but the barriers would have been higher and the response thereby less elastic. To illustrate the importance of the removal of surcharges on transfers: the Norwegian money market peaked around the Midsummer Day market, just a fortnight after the Danish 11 June settlement day. Thus, capital flowed to Copenhagen from Christiania only to return shortly afterwards. At 5 per cent discount the income for 14 days of interest would be 0.19 per cent – an income that would easily have been curtailed even by a modest commission. These recurring seasonal flows were recognised by contemporaries and their impact on the money market eagerly reported by the financial press.Footnote 41
The removal of transfer costs was even more important for interest rate arbitrage than for seasonal lending. While the latter was motivated by the opportunity to earn an income on unused funds, the former was influenced by interest rate differentials, i.e. to make a profit out of higher interest rates in another market. Responding to a 0.5 per cent difference would, for example, yield only 0.04 per cent a month. With such small margins, the absence of charges on drafts must have been decisive.
Interest rate arbitrage was an important mover behind short-time credit flows in Scandinavia and recognised as such by the central bank.Footnote 42 However, higher interest rates abroad were not the sole mover for short-term capital flows in Scandinavia. Even at times when the rate was the same in two or more of the countries, capital flowed between them. How can we account for this? One explanation is that interest rates were not fine-tuned to the state of the domestic money market in the short run. The central banks did not generally change interest rates to accommodate peaks or troughs in the demand for money. Thus, the price of money did not ‘clear’ the market. Instead, the major private banks operated with cash balances or reserves that changed throughout the year with the domestic demand for money. One way of earning an income on unused funds was to shift money abroad on short notice. These funds were called home at times of increased demand and were further supplemented by lending from banks in the neighbouring countries.Footnote 43 The operations took place even at times when the interest rate was lower in the borrowing country. Thus, neighbouring markets supported domestic markets in a complementary way.
Moreover, business-cycle conditions influenced the flows of short-term capital. During a downturn, like the one Norway witnessed at the beginning of the century, unused capital accumulated in the private banks. Instead of lowering the interest rate in order to reduce the level of unused funds, banks tended to shift their resources abroad and even in some instances accepted a lower rate than the domestic one. For example, in the autumn of 1904, the financial weekly Farmand reported that the private banks had discussed lowering the discount rate but had returned a negative verdict as there was still greater demand for money in Sweden and it was thus more profitable to export unused funds.Footnote 44 To some extent it might be possible to characterise this as a sort of ‘dumping’: maintaining the price of money in the primary market by shifting surplus balances to a secondary market. Thus, for explaining financial flows, the actual rate at home was less relevant than the potential (lower) rate needed to clear the market.
In producing an elastic response to changes in demand in neighbouring countries, the SMU helped produce increased efficiency and stability in the Scandinavian money market. Nevertheless, the ability to attract foreign capital represented two problems from a monetary governance point of view. The first was reduced control over gold flows and increased risk of ‘an embarrassing situation’. As early as 1897 central bank governor Bomhoff complained that ‘the many transactions, in particular with Sweden which influences the gold reserves, are so complicated that it is very difficult to pinpoint the reason for an increase or reduction in the reserve’.Footnote 45 The second problem was that the flows entrusted the private banking sector with note-creating powers – at least in the short run. If this constituted a part of a regular seasonal adjustment, it increased market efficiency and represented no challenge. However, if the banking sector expanded its lending capacity during a business upturn by short-term borrowing, the amplification of the business-cycle movements would have unwelcome effects.
This was the case with the major real-estate bust in 1899, the Christiania crash. The boom had been fuelled by new speculative banks and the prospects of ever-increasing profits. In order to secure funds, the banks had rediscounted bills abroad at unprecedented levels. The increased activity in the short-term money market in the years up to 1899 is clearly visible in Figure 3, where the gross turnover in the clearing mechanism of the SMU increased sharply while trade actually fell. Such short-term lending abroad could not be sustained in the long run, and when the gold inflow was reversed the money market became strained. In June the boom collapsed and one of the ‘jobber’ banks immediately went into receivership, with more to follow.Footnote 46 The ability of the banking sector to create money by borrowing abroad had led to typical pro-cyclical policies that the country suffered from for years to come. Growth was sluggish until 1906 and the level of note circulation did not surpass 1899 for six years. The transfers through the SMU fell markedly for some time after the bust.
The second peak of transfers through the SMU was an altogether different story, showing both more durability and a stronger Norwegian economy. From 1906 onwards Norway entered a period of hitherto unprecedented growth centred on the industrial exploitation of hydro-electrical power. From 1905 until 1914 GDP per capita increased at an annual rate of 3 per cent, while the gross investment rate increased from 17.3 to 23.7 per cent of GDP.Footnote 47 Vis-à-vis her Scandinavian partners, this clearly changed Norway's position. As had been the case for Denmark earlier, the Norwegian long-term inflows of capital were recirculated in the Scandinavian short-term money market. This was undoubtedly the case in the strained years of 1907 and 1908. While Sweden and Denmark were hit hard by the international downturn and credit contraction, Norway passed the crisis practically unharmed. Capital imports and growth continued uninterrupted. Early in 1907, the financial weekly Farmand reassured its readers: ‘Our own money market is fortunately fairly uninfluenced by the prevailing anxiety abroad. Only small amounts of gold have flowed out and our market is so well situated that an outflow of a few millions will not render any difficulties. The private banks have large reserves abroad including placements in first-class Swedish banks.’Footnote 48 Commenting on a reduction in the gold reserves in the summer of the same year, the journal argued that the market was still not tight, as the banks still had substantial reserves abroad that they had not redrawn so far due to the good interest rates they earned there. Throughout the year, Norges Bank consistently kept a lower bank rate than its neighbours. When the rate was finally raised to 6 per cent in November 1907 it was still one percentage point lower than the Riksbanken and two percentage points lower than the Nationalbanken. The rate continued to be lower until March 1911. The period of relatively low interest rates in Norway coincided with the strongest peak in the Norwegian turnover under the convention, unexplained by trade.
The figures studied here refer to gross transfers. Reports in Farmand give a scattered impression of the size of the private banks' operations and balances abroad.Footnote 49 The operations reported could constitute up to 10 per cent of Norges Bank's foreign exchange reserves. Moreover, transfers through the settlement mechanism were recognised as the most important source for changes in the bank's domestic holdings of gold.Footnote 50 In addition to these observations, Farmand frequently referred to operations of domestic and foreign banks in explaining changes in the central bank reserve, but without indicating the sums involved. Thus, the qualitative sources also support the thesis presented here, that the importance of the SMU was the facilitation of short-term financial integration.
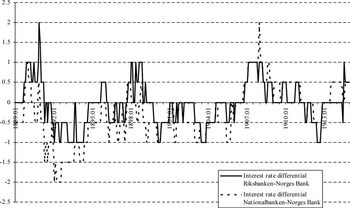
The possible pitfalls of using interest rate convergence as an indicator of financial integration were alluded to above. However, the increased level of financial transfers under the SMU arrangement was followed by interest rate convergence in Scandinavia, as displayed in Figure 7.
Bank rate differentials: Norges Bank versus Riksbanken and Nationalbanken, 1889–1913 (end of month observations)
Sources: Norwegian historical statistics 1994, table 24.22; Dank Pengehistorie, vol. III, pp. 7–9, Danmark Nationalbank (1968); Sveriges Riksbank 1668–1924, volume V, pp. 136–8 (Stockholm 1931).

With the exception of 1889–90, Norway generally kept a higher bank rate than Sweden and Denmark until 1906. For the period 1893–1906 the average Norwegian interest rate was 0.57 percentage points higher than the Danish and 0.22 points higher than the Swedish. From 1906 this image changed as Norway for a number of years kept lower rates than its neighbours, particularly Denmark. This reflects the Norwegian capital inflows, the downward trend for the Danish economy as well as the different impacts of the crisis of 1907.
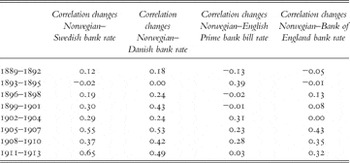
Although the interest rate differentials fell, the strongest indication of financial integration is probably the increased sensitivity to changes in the bank rate in the neighbouring countries. This can be seen in Table 1, which displays the correlation coefficients for changes in the bank rate based on end-of-month observations for 1889–1913. Norges Bank increasingly ‘shadowed’ the rate decision of the two neighbours: rate changes in Stockholm and Copenhagen were followed by a change in Christiania as well. This was also recognised at the time and in the later part of the period Farmand often commented on the strong impact of Danish and Swedish rate policy on the Norwegian money market. Moreover, examinations of bank rate changes also testify to the increased importance of the neighbouring countries in interest rate policy formation.Footnote 51 Changes in Norwegian interest rates also became more strongly correlated with the prevailing rates in the United Kingdom: however, the extent of this was more limited than with Sweden and Denmark, supporting the case for a particular Scandinavian financial integration.
Bank-rate correlations

Source: Central Bureau of Statistics of Norway, Statistical Surveys 1948.
The most important contribution of the SMU clearing mechanism was to reduce the cost of financial transfers. These lower barriers created a more elastic response to short-term changes in demand for money in Scandinavia, thereby deepening the relationship between the banking communities in the three countries. A Scandinavian money market in the sense of ‘one price for money’ was not created, but the domestic markets became more integrated with each other and a special cross-border inter-bank market was in fact established. Could this have happened without the clearing mechanism entrusted in the union? It is reasonable to expect that the three Scandinavian markets would have been more integrated in 1913 than in 1889, even without the clearing mechanism, reflecting the increased level of financial integration in general in the Atlantic economy prior to World War I. It might even be that the path dependence and common languages would have resulted in financial integration in the three countries above this trend. However, the clearing arrangement gave Scandinavian banks a competitive advantage in the neighbouring markets. Without it, elasticity would have been lower and the neighbouring countries just two of several competing sources for short-term lending or placement. Thus, in the absence of these institutions, the Scandinavian markets would not have reached the level of integration they in fact did achieve.
VI
The Scandinavian Monetary Union provided little momentum for trade integration. Neither can the Scandinavian experience be seen as providing any lesson from history for monetary unions of today. Some of the alleged effects attributed to the SMU were most likely those of the gold standard. However, the union was not without significance. Economic theory posits that arrangements such as the SMU have a potential for facilitating short-term financial flows. The Scandinavian data indeed show that the flows that cannot be attributed to trade were large, and at times substantially so.
Earlier studies have regarded the use of the clearing mechanism for financial transfers mainly as a governance problem. However, although resulting in less central bank control, the mechanism facilitated a more efficient capital market in Scandinavia, leading to interest rate convergence and support for the domestic markets. As such it might be tempting to point to Nielsen's old view of the union as a vehicle for promoting a special Scandinavian money market. This market, nevertheless, represented a continuance and a deepening of an old tradition of inter-bank loans in Scandinavia and was not a direct product of the union. However, the clearing mechanism stimulated this market, which peaked in the period 1907–10. Without lower transaction costs the degree of financial integration in Scandinavia would probably have been closer to the overall level of integration in the western hemisphere. The importance of transaction costs is also evident. When central banks introduced surcharges again around 1910, transfers fell. However, the volume, in particular the Danish–Norwegian transfers, were still large relative to trade flows. Thus, the real significance of the SMU was in fostering increased financial integration.