


Introduction
The Antarctic ice sheet surface is dominantly snow with a minimal spatial distribution of bare ice. Blue (bare) ice area (BIA) is an ice-exposed area where ablation exposes the underlying glacier ice. Blue ice areas have a light blue appearance, in sharp contrast to the vast white snow plains in Antarctica (Schytt Reference Schytt1961, Bintanja Reference Bintanja1999). In BIAs, wind scouring and sublimation remove more snow than is annually accumulated, with a result of negative surface mass balance (Bintanja & Reijmer Reference Bintanja and Reijmer2001). When the surface mass balance is close to zero, wind crust occurs. Wind crusts are often found with BIAs, and have similar spectral characteristics as BIAs (Scarchilli et al. Reference Scarchilli, Frezzotti, Grigioni, Silvestri, Agnoletto and Dolci2010).
Winther et al. (Reference Winther, Jespersen and Liston2001) classified the BIAs in Antarctica into two different types: melt-induced and wind-induced, depending on the dominant climate process. They pointed out that melt-induced BIAs are located on slopes near coastal areas where surface and near surface melt occurs, and wind-induced BIAs are distributed near mountains or on outlet glaciers where snow is eroded by constant winds year-round. Although melt-induced BIAs (Winther et al. Reference Winther, Jespersen and Liston2001) and wind crust have different origin from the traditional BIAs as defined in Bintanja (Reference Bintanja1999), all of them indicate important meteorological conditions and show distinctive spectral properties and visual appearance in comparison with surrounding snow surface. This study adopts a broad definition for BIAs and considers traditional BIA, melt-induced BIA, and wind crust as different types of BIAs. Temporal variations of BIA extent may be involved with the change in Earth's radiation budget, as BIAs have a much lower surface albedo than surrounding snow surface. Because the extent of BIAs is sensitive to various meteorological factors, including air temperature, surface temperature, snowfall event, wind speed and albedo, the spatial extent of BIAs may serve as an indicator of climate changes (e.g. Orheim & Lucchitta Reference Orheim and Lucchitta1990, Bintanja & Reijmer Reference Bintanja and Reijmer2001, Brown & Scambos Reference Brown and Scambos2004).
The Lambert Glacier-Amery Ice Shelf, located in East Antarctica, is one of the largest glacial basins on Earth, with a drainage area of 1 380 000 km2 (Fig. 1). Previous studies have reported that the Lambert Glacier-Amery Ice Shelf has the largest share of BIAs in Antarctica, accounting for about 23% of total BIAs in Antarctica (Winther et al. Reference Winther, Jespersen and Liston2001). Satellite remote sensing technique has been employed to detect and map BIAs in previous studies. Many researchers have investigated spectral characteristics of blue ice and other snow features (e.g. Bronge & Bronge Reference Bronge and Bronge1999). Various satellite remote sensing data have been employed for blue ice identification, including Landsat Multispectral Scanner (MSS) and Thematic Mapper (TM) (e.g. Orheim & Lucchitta Reference Orheim and Lucchitta1990, Bronge & Bronge Reference Bronge and Bronge1999, Bindschadler & Vornberger Reference Bindschadler and Vornberger2000, Brown & Scambos Reference Brown and Scambos2004), Advanced Very High Resolution Radiometer (AVHRR) (Bindschadler & Vornberger Reference Bindschadler and Vornberger2000, Winther et al. Reference Winther, Jespersen and Liston2001, Brown & Scambos Reference Brown and Scambos2004), and Synthetic Aperture Radar (SAR) images (e.g. Jezek et al. Reference Jezek, Drinkwater, Crawford, Bindschadler and Kwok1993, Liu et al. Reference Liu, Wang and Jezek2006). By employing 16 Landsat MSS images at 80 m resolution, McIntyre (Reference McIntyre1985) estimated that BIA in the Lambert glacial basin was 56 000 km2, which accounted for over 6% of the area of the interior drainage basin. Utilizing aerial photographs and satellite images, Swithinbank (Reference Swithinbank1991) identified 15 sites of BIAs over the Lambert Glacier-Amery Ice Shelf as potential airfield sites. Winther et al. (Reference Winther, Jespersen and Liston2001) employed 1.1 km resolution AVHRR data acquired in January 1987 and delineated the BIAs of the Lambert Glacier-Amery Ice Shelf, as part of their continental scale of BIA mapping effort. Liu et al. (Reference Liu, Wang and Jezek2006) mapped the extent of four different snow zones, including bare/blue ice over Antarctica using Radarsat SAR data and a passive microwave Special Sensor Microwave Imager (SSM/I). Their study confirmed the large distribution of blue ice in the Lambert Glacier-Amery Ice Shelf region.
Distribution of individual Landsat Enhanced Thematic Mapper Plus (ETM+) image frames utilized in this study.
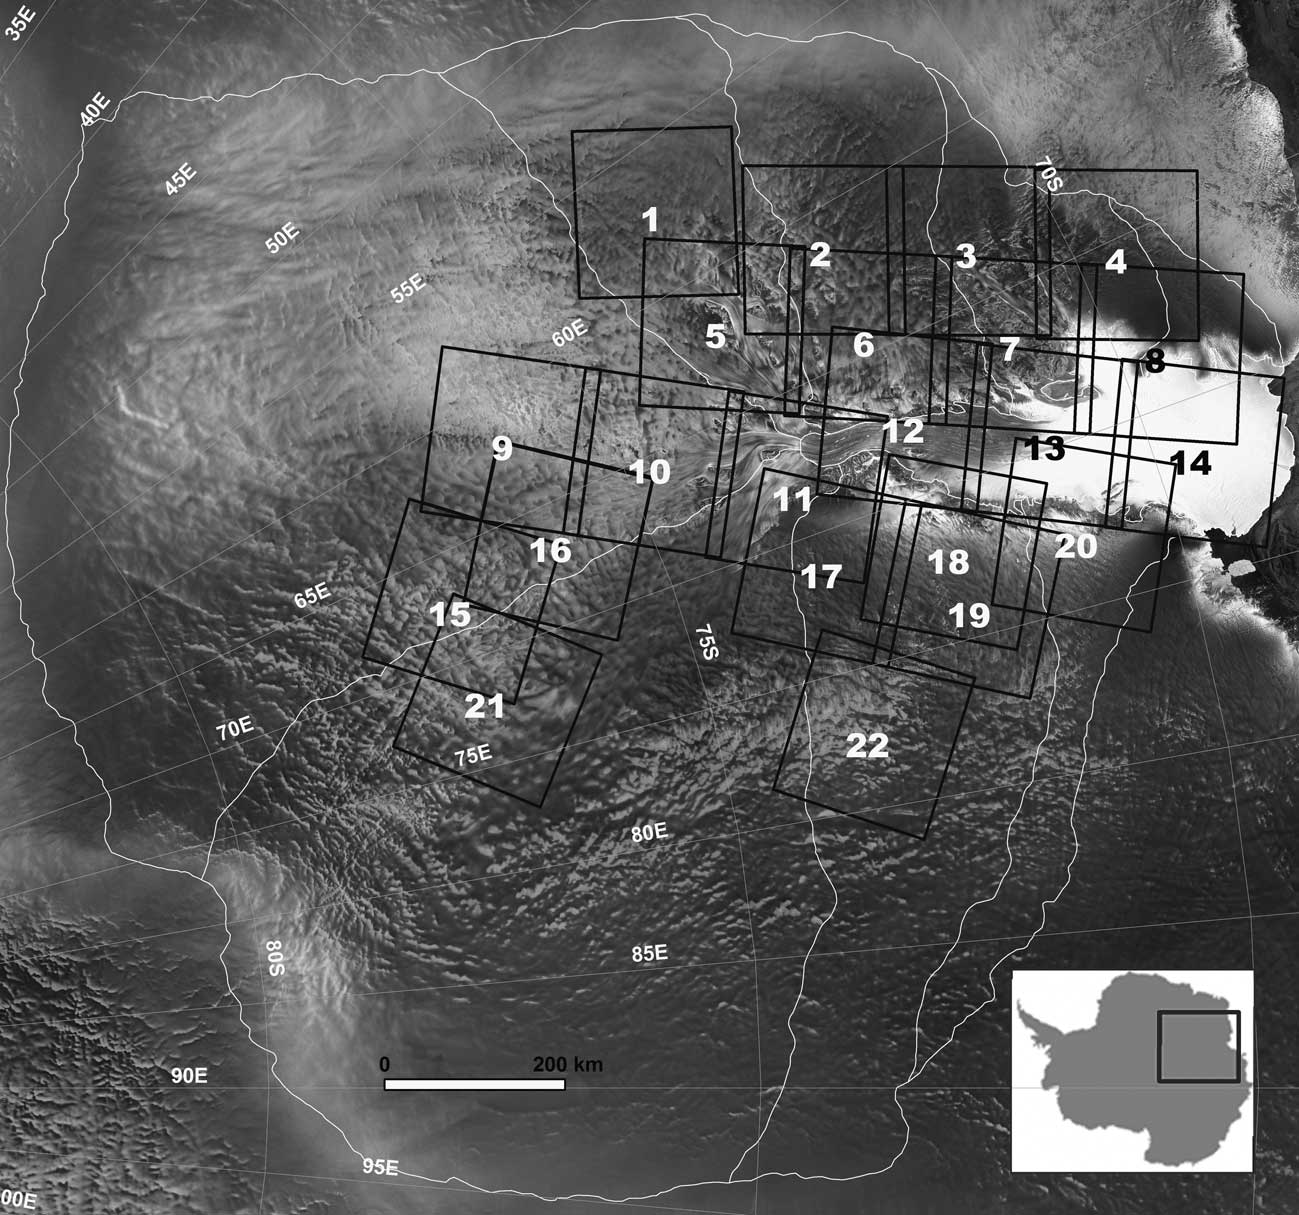
However, previous studies on the BIAs in the Lambert Glacier-Amery Ice Shelf are limited by certain inadequacies of availability in earlier remote sensing data. The image data used in McIntyre (Reference McIntyre1985) and Swithinbank (Reference Swithinbank1991) do not cover the entire Lambert-Amery basin. Advanced Very High Resolution Radiometer data used in Winther et al. (Reference Winther, Jespersen and Liston2001) have coarse spatial resolution of 1.1 km and hence the precision of the mapped BIAs is relatively low. Although the BIAs can be differentiated from snow cover on C-band SAR images (Liu et al. Reference Liu, Wang and Jezek2006), BIAs on SAR images can be confused with other low backscatter areas.
The topographical controls on the form of wind-induced BIAs are of great interest to the glaciology community (Bintanja Reference Bintanja1999). It is speculated that the higher the protruding mountain the longer the BIA in the leeward side (Bintanja Reference Bintanja1999). This speculation is based on the assumption that katabatic winds moving down-slope as a result of adiabatic warming and gravity from a high mountain would be accelerated and the wind turbulence would be also strengthened, which in turn increase surface erosion and sublimations (Bintanja Reference Bintanja1999). However, supporting empirical data is very scarce, while the topographical setting and surface geometric characteristics of BIAs have been addressed in the previous studies where they were mainly based on sparse field observations or a small sample of topographical profiles (Nishio & Annexstad Reference Nishio and Annexstad1979, Takahashi et al. Reference Takahashi, Naruse, Masayoshi and Mae1988, Van den Broeke & Bintanja Reference Van den Broeke and Bintanja1995, Bintanja Reference Bintanja1999). Moreover, no comprehensive quantitative analysis has been carried out on the topographical properties of different types of BIAs.
The aims of this research are: to develop the blue ice classification methodology, to map the spatial extent of different types of BIAs using the high spectral/spatial resolution Landsat Enhanced Thematic Mapper Plus (ETM+) data over the entire Lambert-Amery glacial basin, and to quantitatively analyse geographic and topographic characteristics of different types of BIAs for Lambert Glacier basin. The complete high-resolution blue ice distribution map derived from this paper provides the baseline information for future temporal change analysis of the BIAs in this region. Nevertheless, temporal variability of BIAs is beyond the scope of this paper.
We achieved at an improved level of detail by applying a two-step classification method to Landsat ETM+ images. In the first step, three general types of surface features are extracted from multispectral Landsat ETM+ images, including blue ice, exposed rocks, and snow. In the second step, the BIAs are further classified into three sub-types by introducing image texture information: smooth BIAs, rough BIAs and level BIAs. The blue ice patches are then treated as individual objects, and their size, geometric and shape attributes are computed and analysed. Based on the Ice, Cloud, and land Elevation Satellite (ICESat) laser altimetry data (Zwally et al. Reference Zwally, Schutz, Bentley, Bufton, Herring, Minster, Spinhirne and Thomas2003) and the Advanced Spaceborne Thermal Emission and Reflection Radiometer (ASTER) Global Digital Elevation Model (GDEM), the topographical properties of different types of BIAs are analysed. For the wind-induced smooth BIAs, the extent and shape of BIAs are examined in association with the topography of mountain ranges and nunataks and the prevailing katabatic winds.
Blue ice areas based on surface roughness
The early studies on BIAs mainly focused on blue ice fields in the wake of nunataks protruding through the ice surface. In general, the surface of such blue ice fields is generally smooth, often with ripples from wind scouring (Bintanja Reference Bintanja1999). Winther et al. (Reference Winther, Jespersen and Liston2001) referred to this type of BIA as wind-induced. In some coastal areas in Antarctica, surface melting can occur during summer seasons (Budd Reference Budd1966, Mellor &Swithinbank Reference Mellor and Swithinbank1989, Liston et al. Reference Liston, Winther, Baruland, Elvohoy and Sand1999). The bare ice related to sporadic and seasonal surface melting was denoted as melt-induced BIA by Winther et al. (Reference Winther, Jespersen and Liston2001), although some investigators do not consider them as BIAs (e.g. Bintanja Reference Bintanja1999). When intense summer melting occurs, liquid water from snowmelt may form ponds and lakes. The frozen ice on top of ponds and lakes appears in deep blue colour, due to more absorption of green and red wavelength caused by solid ice and liquid water beneath the ice. Swithinbank (Reference Swithinbank1991) considered freshwater ice resulting from intense melting events during summer at Beaver Lake as a different type from the BIAs.
Visual inspection of Landsat ETM+ images in the false colour composite (green, red, and near infrared) confirms that different types of ice areas described by previous studies can be identified and differentiated on the Landsat ETM+ images. In this research, we attempt to classify the bare/blue ice in terms of their surface roughness and local relief, which is reflected by image texture. The ice formed from the melting ponds and lakes have a level, specular surface. The pixels corresponding to pond and lake ice/seasonal ice melt (pond and lake ice hereafter) are almost uniform, resulting in homogeneous texture patches (Fig. 2c). We refer to the pond and lake ice areas as “level BIAs”. The blue ice fields in the leeward side of mountains and nunataks, valley glaciers and steep slopes commonly have smooth or rippled surface. In Landsat ETM+ imagery, the spectral values of pixels on wind-induced BIAs have relatively small range of variation, forming smooth image texture (Fig. 2a). This type of blue ice is referred to as “smooth BIAs”. The bare ice area related to seasonal melting and ice flows have a relatively rough surface, with the troughs and ridges caused by melting, ice flows, and surface crevasses caused by high strain rate of ice flow. The troughs and surface crevasses trap snow and lead to mixed pixels which contain both blue ice and snow. The ridges also induce the solar shadow effect on the Landsat ETM+ imagery. In addition, wind crusts present micro-relief with relatively smaller patches mixed with snow, forming rough surface texture. A certain level of spectral heterogeneity due to the shadow effect of reliefs and ice impurities (Warren & Wiscombe Reference Warren and Wiscombe1980, Bronge & Bronge Reference Bronge and Bronge1999) is also reflected by relatively rough texture on Landsat ETM+ imagery (Fig. 2b). This type of bare ice is referred to as “rough BIAs”.
False colour composite images (green, red, and near infrared (NIR)) for representative samples of three types of blue ice areas (BIAs) with contrast to surrounding snow and rock exposures. a. Smooth BIA, b. rough BIA, and c. level BIA.

Datasets
Since the launch of the Landsat 7 satellite with ETM+ sensor in 1999, thousands of images have been collected over the Antarctic ice sheet, except for the area located south of 82.5°S (Arvidson et al. Reference Arvidson, Gasch and Goward2001). Each Landsat ETM+ image scene contains six multispectral bands at 30 m resolution, one thermal band at 60 m resolution and one panchromatic band at 15 m resolution. The six multispectral bands are used in the classification of blue ice and other surface features, and the panchromatic band is used to derive the image texture information to further classify BIAs into sub-types. During the International Polar Year 2007–08, the United States Geological Survey, the British Antarctic Survey, and NASA made a joint effort that produced the first cloud-free, multispectral, and high-spatial-resolution image mosaic of Antarctica, known as Landsat Image Mosaic of Antarctica (LIMA) (Bindschadler et al. Reference Bindschadler, Vornberger, Fleming, Fox, Mullins, Binnie, Paulsen and Granneman2008). They selected and processed 1100 individual Landsat 7 ETM+ scenes acquired during 1999–2003 for the entire Antarctic. Both original individual Landsat ETM+ scenes and the image mosaic product are available online for the public to access (see Bindschadler et al. Reference Bindschadler, Vornberger, Fleming, Fox, Mullins, Binnie, Paulsen and Granneman2008).
Due to the large area of the Lambert Glacier basin, it is impossible to identify cloud-free Landsat ETM+ images acquired in the same season of the same year to cover the entire basin. Use of images acquired in a relatively large temporal window is inevitable in order to achieve a complete cloud-free coverage of the region for BIA detection. For this reason, we selected and utilized 22 cloud-free images from the LIMA archive over a span of about three years between December 1999 and January 2003. Previous studies suggest that seasonal and annual changes in blue ice extent may be significant (Bintanja Reference Bintanja1999, Brown & Scambos Reference Brown and Scambos2004). Short-term snow accumulation events and other meteorological and environmental conditions may be the contributing factors to the seasonal and annual changes. For the regions where multiple cloud-free images are available, we selected the image scene that contains the largest extent of blue ice. The use of the images with the maximum blue ice extent reduces the impact of short-term snowfall and also facilitates the interpretation and understanding of the relationship between BIAs, local topography, and regional surface elevations. Nevertheless, the seasonal inconsistencies exist in the image data used in our analysis. The acquisition dates for the selected cloud-free images are listed in Table I, and their locations are shown in Fig. 1. The BIAs derived from our analysis approximately represent the maximum blue ice extent between December 1999 and January 2003.
Identifications (ID) and acquisition dates of Landsat Enhanced Thematic Mapper Plus (ETM+) scenes used in this study and their ID corresponding to Fig. 1.

The Geoscience Laser Altimeter System (GLAS) mounted on the ICESat, has collected a large volume of accurate elevation measurements up to latitude 86°S since February 2003 (Zwally et al. Reference Zwally, Schutz, Bentley, Bufton, Herring, Minster, Spinhirne and Thomas2003). The ICESat laser altimetry data has the horizontal geolocation accuracy of 6 m (Schutz et al. Reference Schutz, Zwally, Shuman, Hancock and DiMarzio2005) and the relative vertical accuracy of 14 cm (Shuman et al. Reference Shuman, Zwally, Schutz, Brenner, DiMarzio, Suchdeo and Fricker2006). The ICESat laser altimetry has a footprint of 65 m, and the sampling spacing between laser spots is about 172 m along satellite orbits (Schutz et al. Reference Schutz, Zwally, Shuman, Hancock and DiMarzio2005). By utilizing the measurements acquired in the first seven operational periods from February 2003–June 2005, a 500 m elevation grid for Antarctica has been created by DiMarzio et al. (Reference DiMarzio, Brenner, Schutz, Shuman and Zwally2007). Due to the artefact problems of the data, blocky and inconsistent elevations where spacing between neighbouring cross tracks is large, Yu et al. (Reference Yu, Liu, Jezek, Warner and Wen2010) extracted the ICESat data for the Lambert Glacier-Amery Ice Shelf region and developed a digital elevation model (DEM) for the region. This study utilized ICESat DEM data in Yu et al. (Reference Yu, Liu, Jezek, Warner and Wen2010), including the basin boundaries. In addition, original ICESat laser altimetry data (V29) along satellite tracks is also extracted for the Lambert Glacier-Amery Ice Shelf region for topographic profile analysis.
Despite the high vertical accuracy, the spatial resolution of ICESat elevation measurements is limited, particularly in cross-track direction. To supplement the ICESat elevation data, the ASTER GDEM data are used for a more detailed topographic analysis of the wind-induced BIAs. The ASTER on the Terra satellite is equipped with a backward looking scanner to produce along-track stereo images. Recently, the Ministry of Economy, Trade and Industry (METI) of Japan, and NASA produced the ASTER GDEM from 1 264 118 ASTER stereo pairs (ASTER GDEM validation team 2009, http://www.ersdac.or.jp/GDEM/E/image/ASTERGDEM_ValidationSummaryReport_Ver1.pdf, accessed July 2010). The ASTER GDEM covers land surfaces between 83°N and 83°S at 30 m spatial resolution with an estimated vertical accuracy of 20 m at 95% confidence level. The GDEM tiles corresponding to BIAs are extracted from the ASTER GDEM database and used in our detailed analysis of topographical settings of wind-induced BIAs.
Methods
Unsupervised classification of surface features
The Landsat ETM+ images in the LIMA archive have gone through rigorous radiometric correction and orthorectification, and are in polar stereographic projection (Bindschadler et al. Reference Bindschadler, Vornberger, Fleming, Fox, Mullins, Binnie, Paulsen and Granneman2008). To remove seasonal solar illumination differences, we converted the digital number (DN) values of the visible and infrared bands of all selected individual Landsat ETM+ images into at-satellite reflectance using the standard calibration equations (Bindschadler et al. Reference Bindschadler, Vornberger, Fleming, Fox, Mullins, Binnie, Paulsen and Granneman2008). The spectral characteristics of different surface features were then examined based on at-satellite reflectance values of these spectral bands.
Our first step was to classify the surface features of the ice sheet into three general categories: snow, blue ice, and rock outcrop. These three surface types have distinct spectral reflectance properties (Fig. 3). The spectral reflectances of the six non-thermal Landsat ETM+ bands were statistically analysed based on sample pixels from typical blue ice, snow, shadowed snow, exposed rock, shadowed rock and ocean water sites (Table II). Due to the small areal extent of BIAs in shadows, the shadowed BIAs were not considered in the unsupervised classification stage, which were manually delineated after classification. The average reflectance values of these bands were used to make spectral curves for the four different surface types also including cases of shadow (Fig. 3). As shown by its spectral curve, blue ice strongly absorbs solar radiation in the red and infrared portion of the spectrum and reflects in the blue portion of the spectrum, which explains its bluish appearance. In comparison with blue ice, fresh snow has much higher reflectivity (and hence reduced solar radiation absorption), particularly at red and near infrared (NIR) wavelengths of the spectrum. The comparison of spectral curves of blue ice and snow indicates that the red and NIR bands have the most spectral separability to discriminate blue ice from snow. As reported in previous studies (Bronge & Bronge Reference Bronge and Bronge1999), the band ratio red/NIR is valuable for discriminating blue ice from snow (Table II). The spectral characteristics of exposed rocks are very different from snow and blue ice. Rocks have very strong absorption in the visible and NIR portion of the spectrum and hence appear very dark, compared with both blue ice and snow. However, they have a relatively higher reflectivity in the short wave infrared (SWIR) portion of the spectrum than both blue ice and snow (Fig. 3). The band ratio SWIR/NIR is useful for distinguishing exposed rocks from snow and blue ice (Table II). Ocean water reflects only a very small portion of blue wavelength radiation and absorbs the radiation in the remaining wavelengths of the spectrum (Fig. 3), and hence appears totally dark or dark blue. The ocean water is removed by the shoreline mask and not considered in our subsequent data processing and analysis.
Spectral signatures with standard deviations of blue ice areas (BIAs) at large, snow, shadowed snow, exposed rock, shadowed rock, ocean water and three types of BIAs.

Landsat ETM+ at-satellite reflectance ranges of snow, shadowed snow, rock, shadowed rock, ocean, and blue ice areas (BIAs) at large from unsupervised classification, and Landsat ETM+ at-satellite reflectance and homogeneity index ranges of training sites of smooth BIA, rough BIA, and level BIA. SD = standard deviation, NIR = near infrared, SWIR = short wave infrared.

Due to their apparent spectral differences, the blue ice and exposed rocks can be visually separated from snow background on the colour composition of Landsat ETM+ bands, particularly on the false colour composition of green, red, and NIR bands. Although the manual delineation of blue ice and exposed rock areas is possible, it would be very labour intensive and time consuming. We employed the ISODATA unsupervised classification method in the ENVI software package to process Landsat ETM+ images. The ISODATA unsupervised classification uses an iterative computational algorithm to group image pixels with similar spectral characteristics into unique natural clusters according to statistically determined criteria. Based on our spectral analysis, we included the band ratios of red/NIR and SWIR/NIR in addition to the original six visible and infrared bands as the input variables for the unsupervised classification. Thus, each pixel is characterized by eight attributes: six spectral values and two band ratio values. Our unsupervised classification resulted in 13 clusters. Each cluster consisted of pixels that have statistically similar attributes. Then, these natural spectral clusters were visually interpreted and combined into the thematic information classes of interest based on visual inspection of classification results with reference to original Landsat ETM+ image scenes. Out of the 13 clusters, we identified and labelled five clusters as snow, four clusters as BIAs, and one cluster as exposed rock. In the mountainous areas, the Landsat ETM+ images are influenced by solar shadows. Snow and rock in the solar shadows have much smaller reflectance in all bands compared with those directly illuminated by sun. The unsupervised classification is capable of separating shadowed rock from shadowed snow due to the differences of their spectral properties. We identified one cluster from unsupervised classification result as shadowed snow and two clusters as shadowed rock exposures. After the combination of unsupervised clusters, we obtained three general classes of surface features: blue ice, exposed rocks, and snow.
Classification of blue ice areas by incorporating homogeneity index
This study introduced a local homogeneity index (Anys et al. Reference Anys, Bannari, He and Morin1994) implemented in the ENVI software package to quantify the image texture. It was calculated based on pixels in a 3 × 3 window, and its value ranges between 0 and 1.0. A low homogeneity index value indicates rough texture, and a high homogeneity index value means smooth texture. Table II shows the homogeneity index values and spectral values for a sample of level, smooth and rough BIAs. The sample locations are shown in Fig. 2. The level BIA sample was taken from Beaver Lake, the smooth BIA sample from Prince Charles Mountains, and the rough BIA sample from the Lambert Glacier flow near Mount Stinear. As shown in Table II, the level BIAs have a very high homogeneity index value, indicating there is low or no texture features. Owing to the low reflectance in blue band and extremely low reflectance over longer wavelengths, the level BIAs appear in deep blue, with at-satellite reflectance of 0.411 for blue band and 0.059 for NIR band. In contrast, the smooth BIAs show light blue, with at-satellite reflectance of 0.842 for blue band and 0.460 for NIR band. The reflectance values of level BIAs are significantly lower than smooth and rough BIAs for all spectral bands, particularly in the NIR band. The smooth BIAs have a significantly higher homogeneity index value than the rough BIAs, although their spectral values are very similar (Table II).
Based on the above analysis, we used NIR band and homogeneity index to perform the second step of classification, in which the blue ice was further classified into three subtypes: level, smooth, and rough BIAs. The threshold values were determined by analysing the histograms of NIR band and homogeneity index for level, smooth and rough BIA samples. The Gaussian curve was fitted to each histogram, and the intersection point between two fitted Gaussian curves was the optimal threshold value for separating two different types of BIAs. The classification rules were: if NIR ≤ 0.1 and homogeneity index ≥ 0.5, then level BIA pixel; if NIR ≥ 0.3 and homogeneity index ≥ 0.5, then smooth BIA pixel; if NIR ≥ 0.1 and homogeneity index < 0.5, then rough BIA pixel. By using the above classification rules, the BIAs from the unsupervised classification were further classified into the three subtypes. As a result of the two step classification, the surface of the Lambert-Amery glacial basin was classified into five types: snow, exposed rock, level BIAs, smooth BIAs, and rough BIAs. To correct possible classification error and suppress random noise, a number of post-classification operations have been performed, including majority filtering, mathematical morphology operations (dilation, erosion, fill, and trim) (Soille Reference Soille1994). At a final stage, we visually inspected the numerical classification output with reference to original Landsat image scenes and manually corrected some misclassifications, including the small patches of shadowed BIAs in mountainous areas.
Accuracy assessment of classification
The classification accuracy was evaluated based on 434 checking pixels, which were selected by using a stratified random sampling scheme. The surface types for these checking pixels were determined on the basis of visual interpretation and knowledge acquired from previously published maps and papers. The manually interpreted surface types for these checking pixels were treated as virtual ground truths and compared with the classification results to form the error contingency matrix. Based on the error matrix, the overall accuracy and Kappa coefficient (Jensen Reference Jensen2004) were computed. Although a certain level of confusion between smooth BIAs and rough BIAs, the overall accuracy of the classification reaches 94.5% and the Kappa coefficient is as high as 0.94. This indicates that our classification is satisfactory and successful.
Topographic analysis of blue ice areas
The topographical properties of different types of BIAs were examined at local and regional scales. The ICESat DEM at 400 m resolution (Yu et al. Reference Yu, Liu, Jezek, Warner and Wen2010) was used to analyse the topographical characteristics in terms of surface elevation and slope at the regional scale. The surface slope was determined within a 3 × 3 pixel window, namely within 1500 m range. Then, the surface roughness of different types of BIAs were investigated through the ICESat along-track profiles at spatial resolution of 175 m. The topographical effect of mountains and nunataks on the length and extent of wind-induced BIAs was investigated in great detail using a series of topographical profiles extracted from ASTER GDEM.
The topographical profiles were extracted from 30 m ASTER GDEM along transects in prevailing katabatic wind direction. Each topographical profile starts from the windward foot, crosses the mountain ridge/peak, and then extends over the smooth BIA in the leeward side (Fig. 4). To facilitate our quantitative analysis, we extracted the elevation and relative height for each mountain ridge/peak, the angle of mountain leeward slope, BIA length in the prevailing wind direction, and the BIA surface slope (Fig. 4c).
Advanced Spaceborne Thermal Emission and Reflection Radiometer (ASTER) Global Digital Elevation Model (GDEM) based profile analysis for topographic controls of smooth blue ice areas. a. Blue ice area topographic unit of study site 16, b. elevation distribution from ASTER GDEM, and c. topographic profile and profile parameters derived from classification and ASTER GDEM.

Results and discussion
Geographical distribution and shape attributes of BIAs
Employing the two step classification method, Antarctic surface features including three types of BIAs were mapped at 30 m spatial resolution. As shown in Table III, the snow cover is dominant and accounts for 98.33% of surface area of the Lambert-Amery glacial basin. As shown in Fig. 4c, the high elevation inland areas are entirely covered by snow, and BIAs and exposed rocks are mainly distributed around the Amery Ice Shelf. Exposed rocks account for only 0.19% of the surface area of the Lambert-Amery glacial basin. The spatial extent of BIAs is estimated to be 20 421 km2, which accounts for 1.48% of the total basin area.
Areas and classification accuracy of five different surface features.

It should be noted that the cloud-free images used in this analysis span an approximately three-year period between December 1999 and January 2003, and we selected the image scene with the maximum blue ice extent for regions where multi-temporal cloud-free images are available. Therefore, the BIAs derived from this research approximately represent the maximum blue ice extent between December 1999 and January 2003. The maximum blue ice extent puts an upper bound on the total area where the surface mass balance is negative for the period of the study. The selection of maximum blue ice scenes yields a clearer correlation between formative processes associated with topography, and the relationship between blue ice zone formation and local topography and regional surface elevation can be better revealed. Due to the fact that the cloud-free image scenes were acquired in different seasons, our final blue ice map contains a certain level of seasonal “noise” and inconsistencies. Attention should be paid to the acquisition time stamp for each image scene (Fig. 1 & Table I), when our blue ice mapping result is interpreted and compared with other studies.
Our analysis focuses on the spatial distribution pattern of different types of BIAs and their geographic and topographic characteristics. Conducting a temporal analysis of BIAs based on culling and compiling time series of BIAs from the literature is beyond the scope of this paper, but simple comparison and contrast of our estimate of BIAs with some previously published results may highlight the effects of spatial resolution and sensor type of remote sensing data and the seasonality of image acquisitions. The areal size of BIAs reported by Winther et al. (Reference Winther, Jespersen and Liston2001) based on AVHRR images at 1.1 km spatial resolution is significantly larger than our estimate. Due to the coarse spatial resolution of AVHRR images, some small BIAs may have been missed and the shapes of BIAs were distorted to some degree. Although the spatial distribution of BIAs mapped by Winther et al. (Reference Winther, Jespersen and Liston2001) is in general agreement with ours, their estimate for the total area of BIAs was 41 444 km2, over two times as large as ours. The estimated area differences may be explained partly by different classification methods and possible blue ice extent changes during 15 years of time span between the AVHRR and Landsat ETM+ image acquisitions. In 1985, McIntyre used 16 MSS images to map the BIA area of 56 000 km2 for part of the Lambert Glacier-Amery Ice Shelf system, mainly for the Amery Ice Shelf and vicinities. Compared to McIntyre (Reference McIntyre1985), the estimates of Winther et al. (Reference Winther, Jespersen and Liston2001) and our estimates are significantly lower considering the scale of study area. On the one hand, this may indicate that there is a temporal change in BIA extent in the system. Indeed, the BIA patch located at the confluence region of Lambert, Mellor, and Fisher glaciers is smaller in this study than that of Winther et al. (Reference Winther, Jespersen and Liston2001). But, more study needs to be conducted to confirm a physical change. On the other hand, we speculate that the coarse resolution (1.1 km) and a smaller number of spectral bands (four) of AVHRR images could be the reasons for their overestimate of BIAs. Owing to the much higher spatial resolution (30 m) and better spectral separability (six spectral bands) of Landsat ETM+ images, we believe that our estimates for the blue ice extent and distribution represent an improvement over the result of Winther et al. (Reference Winther, Jespersen and Liston2001). Liu et al. (Reference Liu, Wang and Jezek2006) extracted blue ice zones for the entire Antarctic ice sheet based on the 1997 Radarsat SAR image mosaic at 100 m spatial resolution. The spatial extent of BIAs in the Lambert-Amery glacial basin from Liu et al. (Reference Liu, Wang and Jezek2006) is 23 629 km2, very similar to our current estimate. Nevertheless, a close comparison shows that Liu et al. (Reference Liu, Wang and Jezek2006) missed some wind-induced BIAs in the upstream areas of the glacial basin, while overestimating the spatial extent of BIAs over the ice shelf and eastern tributary edges of the ice shelf. The omission of some wind-induced BIAs in Liu et al. (Reference Liu, Wang and Jezek2006) may be attributed to the inadequate backscattering information of the single C-band SAR image for distinguishing blue ice from other low-backscattering features and the conservative classification scheme that tends to make omission errors. The overestimate of BIAs on the ice shelf may be caused by the certain level of ground penetration capability of SAR images, which detect the ice buried by a thin layer of snow. The above comparison and discussion suggests the spatial resolution, the type of sensor, the image acquisition season, and the classification algorithm may all contribute to the differences of the blue ice estimates. For a reliable analysis of long-term temporal changes of BIAs in the future, the image data acquired in the same season by similar types of sensors should be used.
Further information about surface types is derivable by treating snow cover as background, if exposed rock, level, smooth and rough BIAs are treated as features. By identifying spatially connected pixels of the same surface type, we explicitly delineate individual exposed rock patches, level BIAs, smooth BIAs, and rough BIAs as discrete objects. The geometric and shape attributes, including area, width, length, orientation, and elongatedness have been derived for all objects. Our analysis indicates that rock exposed areas, level, smooth and rough BIAs have distinctive characteristics in terms of geographical distribution and their geometric properties.
Exposed rock outcrops are mainly distributed in Prince Charles Mountains in the west of the ice shelf and in Mawson Escarpment and Clemence Massif along the east margin of the ice shelf. Some small exposed rock patches are also detected in Grove Mountains in American Highland. Almost all exposed rock patches are spatially adjacent to BIAs (Fig. 5c).
a. Landsat Image Mosaic of Antarctica (LIMA) false colour composite showing blue ice area (BIA) extent, b. three classes of surfaces features based on ISODATA unsupervised classification, and c. spatial distribution of smooth, rough and level BIAs, and rock exposures overlaid on elevation contours (m).

Among the three types of BIAs, the smooth BIAs have the largest area of 13 709 km2, which is more than twice the area of the rough BIAs (6463 km2). The level BIAs have the least ground coverage, merely 250 km2 in total area. Level BIAs are scattered on the upper and middle sections of the ice shelf and along the margins of the ice shelf near the rock exposures. The south part of Beaver Lake is the largest level BIA, with a surface area of 134 km2. The level BIAs have the smallest average patch size of 0.19 km2 (Table IV).
Patch size distribution, average and standard deviation (SD) of three blue ice area (BIA) types and rock exposures.

Smooth BIAs are widely distributed in mountainous areas, including Prince Charles Mountains, Aramis Range, Porthos Range, Mount Menzies, Goodspeed Nunataks, Mawson Escarpment, Clemence Massif, Grove Mountains and Gale Escarpment (Fig. 5a & c). Some smooth BIAs occur in the high slope valley glacial floors, including the upstream reach of Fisher Glacier and downstream reach of Charybdis Glacier, glacial floors near the grounding zones of the eastern and western sides of the ice shelf (Fig. 5a & c). Most of the smooth BIA patches are in the small–medium size with the average size of 0.42 km2. The smooth BIA patches larger than 100 km2 are mostly associated with high mountains and/or large steep glacial floor. Many smooth BIAs have an elongated shape and are oriented in the direction of katabatic winds and ice flows.
Rough BIAs are mostly situated in the downstream part of the glacier, the upper section of the ice shelf, and along the margins of the middle section of the ice shelf. The downstream portions of Lambert, Mellor, and Fisher glaciers and their confluence zone have a high flow velocity. The ice flow stripes and surface crevasses caused by high strain rate and seasonal surface melting created the largest rough BIA zone in the Lambert-Amery basin (Fig. 5a & c). Extensive wind crusts are also identified in the confluence zone, which are caused by strong wind erosion on the steep convergence area. Some rough BIA patches are identified on the western margins of the ice shelf, and near Clemence Massif (Fig. 5a & c), where the high shear strain rate of ice flow causes surface crevasses. On the eastern slope of the Amery Ice Shelf, some rough BIAs with apparent surface crevasses are surrounded by large smooth BIAs. It should be noted that the north part of Beaver Lake is identified as a rough BIA, where the ice surface is uneven and bumpy due to the ice dynamics (Fig. 5a & c). The size of rough BIAs varies from place to place (Table IV).
Topographical properties of different types of BIAs
Based on ICESat DEM (Yu et al. Reference Yu, Liu, Jezek, Warner and Wen2010) and ICESat along-track profile analysis, topographical characteristics of level, rough, and smooth BIAs are assessed. Most of the level BIAs are located in low elevation and relatively low latitude areas. The average elevation of all level BIA patches is 140 m, and more than 75% area of level BIAs have a regional surface slope lower than 1°. An ICESat along-track profile across the south part of Beaver Lake is shown in Fig. 6d. It is clear that the surface of level BIAs is flat, and many of the level BIAs occur in the vicinity of exposed rock outcrops (Fig. 5c). The rock outcrops absorb much more solar radiation than ice and snow, leading to a relatively high temperature (Bintanja Reference Bintanja1999). The low elevation at relatively low latitude and the “heat island” effect of exposed rocks contributed to the formation of melt ponds and lakes and the corresponding level BIAs (Table V).
Ice, Cloud, and land Elevation Satellite (ICESat) along-track profiles over different types of blue ice areas (BIAs). a. Transect AB over level BIA and transect CD over rough BIA in Beaver Lake, b. transect EF over rough BIA near Mount Stinear, c. transect GH across smooth BIA in Lambert Glacier floor, d. topographic profile for transect AB over level BIA, e. topographic profiles over transects CD and EF over rough BIAs, and f. topographical profile over transect GH across smooth BIA.

Elevation and slope distributions of three types of blue ice areas (BIAs).

Rough BIAs are mainly situated at the downstream ends of the glaciers and the upper section of the ice shelf, where accelerating katabatic winds effectively remove the snow from the surface. 86% of rough BIAs have an elevation ranging between 300 and 1000 m. Although having higher elevations than level BIAs, sporadic summer melting events occur (Liu et al. Reference Liu, Wang and Jezek2006), which creates local relief (Table V & Fig. 5e). The fast ice flows also make local ridges and troughs in the ice flow direction (Liu et al. Reference Liu, Yu, Zhao and Jezek2008). Fast moving glaciers (confluence zone), moving over bed topography and interacting with obstacles at the ice shelf margins (Clemence Massif and Pickering Nunatak) (Yu Reference Yu2005, Yu et al. Reference Yu, Liu, Jezek, Warner and Wen2010) causes a high level of ice deformation and the occurrences of surface crevasses. The topographical profiles in Fig. 5d show apparent local scale reliefs due to the ice dynamics, although the regional surface slope is still quite low (Table V).
Smooth BIAs are found in a large elevation range (Table V). Over 68% of smooth BIAs are located at an elevation higher than 500 m. Compared with rough BIAs and level BIAs, smooth BIAs have a much higher average elevation, hence without the occurrence of surface melting. While BIAs in general have lower friction than snow, smooth BIAs provide even more accelerations of down-slope katabatic winds since their regional surface slope is higher than other types of BIAs. Topographical profiles over smooth BIAs indicate that there is not much local relief and associated elevation variations on blue ice surface, indicating a low level of surface roughness (Figs 5f and 7c, Tables V and VI). The occurrences of smooth BIAs are believed to be related to katabatic winds, which are controlled by topographical settings (Takahashi et al. Reference Takahashi, Endoh, Azuma and Meshida1992, Bintanja Reference Bintanja1999).
Study sites for topographic profile analysis of wind-induced smooth blue ice areas (BIAs) in Lambert Glacier-Amery Ice Sheet system.

As discussed by Takahashi et al. (Reference Takahashi, Endoh, Azuma and Meshida1992) and Bintanja (Reference Bintanja1999), the wind-induced smooth BIAs can occur in three topographical settings: in the leeward side of mountains and nunataks protruding through the ice, on glacial valleys, and steep slopes without mountains protruding through the ice. On the steep slopes (Fig. 4c), the accelerated katabatic winds remove the snow cover through a divergence of snowdrift transport. On the glacial valleys (Fig. 4c), the convergence of descending katabatic winds creates the highest wind speeds, causing the net erosion of the surface and leaving bare ice. Most smooth BIAs are found in the wake of mountains protruding through the ice surface, which obstruct ice flow. Katabatic winds carry high density cold air downwards under the force of gravity, and the mountains induce strong turbulent surface wind field behind, which favour continuous erosion of snow and leave bare (blue) ice.
Topographical controls of smooth BIAs (wind-induced BIAs)
We analysed the extent of BIAs by examining a sample of 85 topographical profiles extracted from ASTER GDEMs along transects on wind-induced smooth BIAs both in Prince Charles Mountains and in Grove Mountains (Fig. 6) to figure out topographical controls on the form of smooth BIAs (wind-induced), particularly the quantitative relationship between the height of obstacle mountains and BIA extent.
The height of mountains in the sample ranges from 27–534 m, with an average of 212 m. The length of BIA changes from 570–12 480 m and its average is 2855 m. As shown in Table VI, the ratio of BIA length to mountain height varies widely, from 2.7:1–91:1. For 98% of sample topographical profiles, the length-to-height ratio is less than the low bound (50:1) of the ratio reported by Takahashi et al. (Reference Takahashi, Endoh, Azuma and Meshida1992). Based on observations of three topographical profiles in Dronning Maud Land, Takahashi et al. (Reference Takahashi, Endoh, Azuma and Meshida1992) estimated the length of BIAs to be roughly 50 to 100 times the height of the obstacle. As shown in the scatterplot (Fig. 8a), no clear quantitative relationship can be observed between BIA length and mountain height. When the profiles are organized into two groups in terms of BIA elevation, the scatterplots show distinctive differences between the two groups (Fig. 8b & c). A group of 20 BIA sites located below elevation of 1400 m shows considerable correlation (r = 0.7009) between BIA extent and obstacle height, whereas the group located higher than 1400 m elevation shows no correlation (r = 0.0625). If 16 sites at elevation range between 1200 m and 1400 m are grouped, the correlation value (r) increases up to 0.8156.
Summary of profile parameters for 85 wind-induced smooth blue ice areas (BIAs) in Lambert Glacier-Amery Ice Sheet system.

a. Scatterplots of blue ice area (BIA) extent and obstacle height for all BIA profiles, b. BIA profiles below elevation of 1400 m, and c. BIA profiles above elevation of 1400 m.

The formation of wind-induced smooth BIA is controlled by local surface topography associated with mountain ranges and nunataks where ice flow is blocked by outcrops or slowed by subglacial bedrock topography, and the surface topographical setting provides a favourable environment for adiabatic warming of large-scale katabatic flows and diabatic warming due to radiation, and eventually result in significantly higher sublimations rates (Bintanja & Reijmer Reference Bintanja and Reijmer2001, Sinisalo & Moore Reference Sinisalo and Moore2010). This sublimation effect is expected to be largest when the relative height of the mountains is larger. On the other hand, sublimation is known to decrease with decreasing temperature (Budd Reference Budd1966), and the ablation rates decrease with increasing distance from the ice sheet edge (Faure & Buchanan Reference Faure and Buchanan1991). Therefore, the ablation and sublimation decreases dramatically as the surface elevation increases (Bintanja Reference Bintanja1999). Our scatterplot implies that topographic effect of sublimation is limited to lower elevations and has strong correlation between blue ice length and relative height of mountains. But, if the elevation exceeds a certain value, the height variation of mountains has a very limited effect on BIA extent due to lower atmospheric temperature and moisture content. In fact, BIA occurrence in the Lambert Glacier-Amery Ice Sheet system is limited to areas with an elevation lower than 2100 m, while there are no BIAs in the inland areas of the glacial basin between 2100 and 4100 m elevation.
The sample profiles are also analysed in terms of six geographical regions: north, central, and west sections of Prince Charles Mountains, south Porthos Range, north Aramis Range and Grove Mountains (Fig. 6 & Table VII). There is large variation in correlation strength and the ratio of BIA length to mountain height. No clear numerical relationship between geographic distribution and BIA formation is detected.
Correlation coefficients (r) and average length-height ratios for blue ice area (BIA) groups at different geographic settings.

Conclusions
This research has confirmed and demonstrated that Landsat ETM+ imagery contains sufficient spectral information to detect and map blue ice and exposed rock outcrops from surrounding snow plains. With the 30 m multispectral Landsat ETM+ images, we have numerically delineated blue ice and exposed rock patches in the whole Lambert-Amery basin in unprecedented detail.
Our analysis shows that the overwhelming majority of the Lambert-Amery glacial basin is covered by white snow, particularly in the upstream inland areas. Blue ice and dark rock outcrops occupy only 1.67% of the surface area of the basin. Exposed rocks appear in small patches, with a total area of 2674 km2. They are scattered in Prince Charles Mountains in the west side of the shelf, in the escarpments and Groves Mountains in the east side of the ice shelf. The BIAs derived from our study amount to 20 421 km2, which is much smaller than the previous AVHHR-based estimate. The BIAs derived from this research approximately represent the maximum blue ice extent within the three-year period between December 1999 and January 2003. We believe that the detailed and accurate map for blue ice and exposed rock from our study will be a useful input to the studies of mass balance, solar radiation budget, and regional climate changes in the Lambert-Amery glacial basin.
In this research, we developed a new two stage unsupervised classification scheme for detecting different types of BIAs. By utilizing image texture information, we have successfully classified the BIAs into three categories for the first time in terms of their surface roughness: level blue ice, smooth blue ice, and rough blue ice. Level BIAs are associated with melt ponds and lakes. They are located in the vicinity of rock exposures in the margin of the ice shelf or on the ice shelf. They have low elevations and flat surface with a small size and compact shape. Rough BIAs are located in the upper section of the ice shelf and the downstream confluence zone of glaciers where sporadic seasonal melting, fast ice flows and surface crevasses have created local relief. Some rough BIAs are found in the margins of the ice shelf where the high strain rate associated with flow velocity changes also created surface crevasses. Many rough blue ice patches have a large size with an irregular shape. Rough BIAs include wind crusts, which are relatively small and located in glacial confluence zone. The analysis of ICESat and ASTER elevation data shows that rough BIAs have a low elevation, a small regional slope but a high ruggedness at local scale. The smooth BIAs occur primarily in the leeward side of mountains and nunataks where ice flow is blocked or slowed by bedrock topography, but are also found in the open glacier valleys and the steep slopes without protruding mountains. Their common characteristics include relatively high elevation, no surface melting, low surface roughness, associated with katabatic winds. Smooth BIAs in the leeward side of mountains usually have a very low surface slope, elongated shape and are oriented in katabatic wind direction. The smooth BIAs in the open glacial valleys and steep slopes can be a large size and have a relatively large regional surface slope.
Cryosphere scientists have long been interested in topographical controls on the wind-induced blue ice. However, empirical studies are very scarce. Based on a large sample of topographical profiles extracted from ASTER GDEM, we have examined the relationship between the blue ice length and the height of mountains. Our analysis show that the ratio of the blue ice length to the mountain height in Lambert-Amery glacial basin varies widely and is generally much smaller than that previously reported for the BIAs in Dronning Maud Land. Although it is speculated that a higher mountain may induce a longer BIA, the relationship is valid only for relatively low elevation regions. In general, correlation strength and BIA extent/relative mountain height ratio vary to a large extent in different geographic settings. This result indicates that the factors controlling the formation and extent of blue ice are more complicated than we previously thought.
Our complete high-resolution blue ice distribution map also provides the important baseline information for future temporal change analysis of the BIAs in the Lambert-Amery basin. Because the cloud-free image scenes in our analysis were acquired in different seasons, special attention should be given to the image acquisition time stamp for each image scene when our blue ice mapping result is used as the baseline for future temporal comparison and change analysis. It is advisable to combine SAR data with the method introduced here to draw more reliable conclusions on temporal change of BIAs.
Acknowledgements
The authors would like to thank Samuel Cantu, Noe Saenz, and Herman Jackson for their assistance in data compilation and processing. Jaehyung Yu was supported by a Research and Scholarly Activity Award from Texas A&M University. K. Jezek was partially supported by NSF CReSIS. The constructive comments of the reviewers are also gratefully acknowledged.



