Introduction
Maternal anthropometry and weight gain during pregnancy are significant determinants of birth weight. 1 , Reference Rosso 2 Relatively subtle changes during pregnancy can affect the outcomes of pregnancy and adolescence.Reference Gluckman, Hanson, Seng and Bardsley 3 Low weight gain in pregnant women without diabetes is associated with reduced foetal growth and increased risk of preterm birthReference Nohr, Vaeth and Baker 4 whereas high weight gain is associated with a greater risk of excessive foetal growthReference Dietz, Callaghan and Sharma 5 Evidence shows that maternal undernutrition (whether global or nutrient specific) and maternal overweight or obesity, are preconceptional or gestational influences that increase the likelihood of obesity during infancy and childhood. 6 , Reference Poston 7
During the 1980s, we developed in Chile an instrument that classifies mothers according to their nutritional status in early pregnancy and that allows to monitor adequacy of weight gain during gestation.Reference Mardones and Rosso 8 This instrument – the so-called Rosso and Mardones chart (RM chart) – diagnoses at any gestational age the body mass index (BMI) of mothers at risk of delivering either small or large for gestational age babies setting gestational weight gain goals proportional to the height of each individual mother. Between 1987 and 2004 the RM chart was used in the Chilean National Public Health Services, where about 70% of the country pregnant women are controlled.
The RM chart was modified by the Atalah et al. chart (AEA chart),Reference Atalah, Castillo, Castro and Aldea 9 expanding the range of normal BMI defined by the RM chart, thus reducing the proportion of pregnant women diagnosed as either underweight or obese. Since 2005 the AEA chart replaced the RM chart at national level and the percentage of mothers classified at risk dropped significantly. For example, using the RM chart the prevalence of underweight pregnant women in this national population was 14%, but in 2005, when the AEA was first used, only 7% were classified in this category. 10 Similarly, the prevalence of obesity was 32.2% in 2004 with the RM chart classification and dropped to 20.3% in 2005 with the AEA standard.Reference Araya, Padilla, Garmendia, Atalah and Uauy 11
Nutritional interventions during pregnancy are targeted according to the adequacy of maternal nutritional status in early gestation and subsequent weight gain.Reference Mardones and Rosso 8 Therefore, the use of either the RM chart or the AEA chart might influence the prediction of pregnancy outcomes. This possibility was explored in the present study by comparing the distribution of born alive newborns with birth length (BL) <50 cm and either birth weight (BW) <3000 g or >4250 g in women classified as underweight, normal, overweight and obese using the RM and AEA charts.
The RM chart is currently being used in several Latin America countries meanwhile some others are using the AEA chart.Reference Scott, Andersen and Valdez 12 Results of this study would help to decide which chart should be used in this region.
Materials and methods
Overview
Data used in this study were obtained in women who participated in a previous prospective cohort study conducted in the community health clinics and at the maternity hospital Dr Sotero del Rio, located in the South-East Public Health Service in Santiago, Chile.Reference Mardones, García-Huidobro and Ralph 13 Women were recruited from January 22, 2000 to April 24, 2004 and were included in the cohort follow-up when delivering singletons and live births. Most of them lived in Puente Alto and La Florida counties and belonged to a mixed population of low-income and middle-income families.Reference Mardones, Arnaiz and Barja 14 A total sample of 28,898 women with anthropometric and health information was recruited and from them 27,613 women were included in the study. Women with maternal height ⩽130 cm or ⩾200 cm plus the ones lacking the required initial maternal weight were excluded. A sub-sample of 11,466 healthy pregnant women was selected from the total sample as a control to ascertain the effect of maternal nutritional status on the newborns growth excluding the effect of other factors. Inclusion criteria in the subsample were: (1) free of medical and obstetrical conditions affecting foetal growth, (2) term deliveries, that is, 39–41 weeks of gestation, 15 (3) mothers 18 years and over and (4) not consumers of alcohol or drugs.
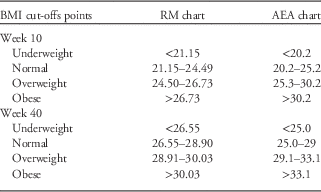
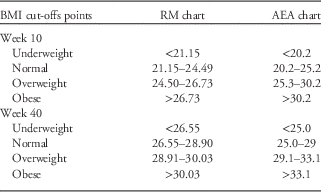
All women were nutritionally classified at the beginning of pregnancy using both the RM and AEA charts. Table 1 presents the weight/height limits for the two charts at weeks 10 and 40 of gestation. Individual weight gain recommendations of each of the two charts are proportional to each individual maternal height; the use of BMI in the two charts allows for that possibility. The RM chart has gestational age on the horizontal axis and maternal body weight, expressed as BMI, on the vertical axis. Areas of different colours are used to classify adequacy of weight for height for underweight, normal weight, overweight and obese mothers.Reference Mardones and Rosso 8 A similarly drawn figure depicts the AEA chart and, as stated before, this chart was designed by expanding the range of normal BMI defined by the RM chart.Reference Atalah, Castillo, Castro and Aldea 9
Body mass index (BMI) cut-off points of the RM chart and the AEA chart for the nutritional classification of women at the beginning and at the end of pregnancyReference Mardones and Rosso 8 , Reference Atalah, Castillo, Castro and Aldea 9
Dependent variables
BW<3000 g category was used as a proxy for small for gestational age infants, the so-called intrauterine growth retarded (IUGR). Weight-for-gestation charts and tables have been adopted elsewhere to define small for gestational age infants, usually as those below the 10th centile of a given standard.Reference Thomson 16 The majority of infants diagnosed as small for gestational age or IUGR fall within the BW<3000 g category with the highest infant mortality rate in the Americas.Reference Puffer and Serrano 17
BW higher than 4250 g was used as a proxy for macrosomic infants as suggested by recent Pan American Health Organization guidelines. 15
BL<50 cm was used as proxy for shortness at birth. The prevalence of obesity, abnormally high blood pressure, insulin resistance and lower school achievement scores have been inversely associated with BL using Chilean data.Reference Mardones, Villarroel and Karzulovic 18 – Reference Mardones, Arnaiz and Pacheco 21 The birth length <50 cm category has been shown to be at risk in those recent Chilean analyses.
Measurements at the health clinics and the maternity hospital
Maternal weight and height were measured in a standardized manner using beam scales (Condor®, Santiago, Chile) at the health clinics and the maternity hospital.Reference Mardones, García-Huidobro and Ralph 13 Pre-pregnancy weight was collected via maternal report. Both charts start classifying nutritional status at week 10 of gestation. As weight gain is modest in the first weeks of pregnancy, the comparison of the charts cannot be affected by the similar use of pre-pregnancy weight to estimate its value at 10 weeks of gestation.
Blood pressure was determined using calibrated sphygmomanometers, having the women seated and resting for at least 15 min. As part of routine care, blood samples were taken for blood group, rhesus status, glycaemia and rapid plasma reagin test for syphilis. The latter test was repeated at week 28 of gestation. Glucose intolerance was also assessed at week 28 in women with risk factors for gestational diabetes. Urine samples were obtained at recruitment for testing the sediment in all women and for testing the presence of protein in hypertensive women. The diagnosis of pre-eclampsia was based on the triad of hypertension, oedema and proteinuria, confirmed by laboratory analysis of a 24-h urine collection (over 300 mg was considered abnormal). In addition, plasma urea concentration and creatinine clearance were measured. All women found to have significant pathology were referred for appropriate care.
Gestational age was estimated according to the date of the last menstrual period and confirmed for a few cases by trans vaginal ultrasound foetal biometry during the first trimester and for all cases by trans abdominal ultrasound during the second trimester. We used either a Voluson 730 PRO (GE Healthcare, Chalfont St. Giles, UK) or an Acuson 120XP (Acuson Inc., Mountain view, CA, USA). Trained ultra-sonographers at the maternity hospital performed the scans.
Mother and infant morbidity was diagnosed and registered by attending physicians. Infants were dried and weighed on an electronic self-calibrating scale immediately after delivery either with a Tanita 1583 electronic scale (Tanita Corporation, Arlington Heights, IL, USA) accurate to 10 g, or with a Seca 345 electronic scale accurate to 20 g (Secacorp, Hamburg, Germany). Crown-heel length was measured on a custom-made neonatometer to the nearest 1 mm.
Statistical analyses
Mean values and standard deviations (s.d.) for numeric variables or number of cases and proportions for categorical variables were used to report general characteristics of women, both in the total sample and in the subsample of healthy women. Proportions of BW and BL categories with its 95% confidence intervals (CI) were obtained in both samples considered. On the cross-classification of women by both criteria, the κ statistic was calculated in order to assess agreement.Reference Landis and Koch 22 Possible differences in the proportions of the three target events, that is BL<50 cm, BW<3000 g and BW>4250 g, at each maternal nutritional category of the RM and AEA charts, were tested using a McNemar’s χ2 test; the mean values of BW and BL in those at risk newborn categories were also calculated and compared. Sensitivity and specificity values were obtained using the three target events. ‘Those categories of at risk newborns were the gold standard for these comparisons of BMI predictive instruments with different cut-off values to define obesity and underweight. Positive and negative predictive values (PPV and NPV) were also calculated. Statistically significant differences were those with P<0.05. All analyses used SPSS version 17 for Windows.
Results
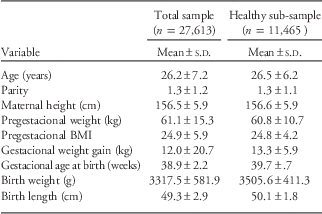
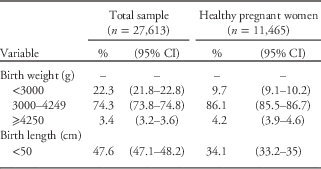
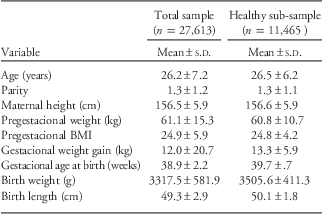
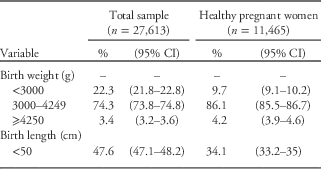
Mean values of demographic and anthropometric characteristics were similar in the total sample and the sub-sample of healthy pregnant women (Table 2). However, the healthy pregnant women sub-sample had a considerably lower percentage of BW<3000 g babies and BL<50 cm babies; the proportion of BW>4250 g was slightly higher in that group (Table 3).
Demographic and anthropometric characteristics of women and newborns in the total sample and in the subsample of healthy pregnant women
Sotero del Rio Hospital, Santiago, Chile, 2000–2004.
Frequency distribution of newborns according to birth weight categories and birth length <50 cm in the total sample and in the subsample of healthy pregnant women
Sotero del Rio Hospital, Santiago, Chile, 2000–2004.
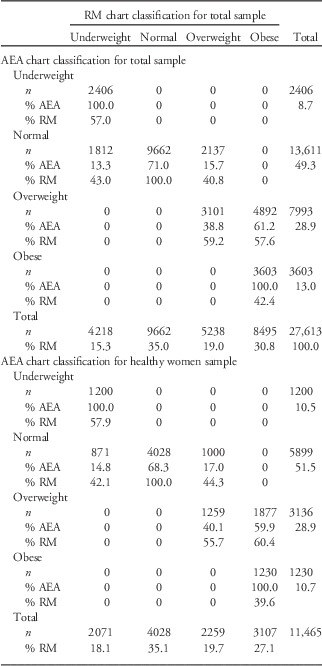
The prevalence of underweight, normal weight, overweight, and obesity was 8.7%, 49.3%, 28.9% and 13.0%, respectively, for the AEA chart, and 15.3%, 35.0%, 19.0% and 30.8% for the RM chart, respectively, at the beginning of the pregnancy (Table 4). The degree of agreement of the RM and AEA charts on the nutritional diagnosis of pregnant women in the total sample was moderate, with a κ value of 0.544. The number of women diagnosed as underweight and obese was higher for the RM chart than for the AEA chart: underweight women classified by the RM chart were 4218 subjects from whom the AEA chart classified as underweight 2406 or 57%, and obese women classified by the RM chart were 8495 subjects from whom the AEA chart classified as obese 3603 or 42.4%. For the normal and overweight maternal nutritional categories the number of women classified by the AEA chart turned out to be higher than those classified by the RM chart. For those classified as normal and overweight by the AEA chart, the proportion with the same diagnoses by the RM chart was higher than for underweight and obese women; 71% for normal women and 59.2% for overweight women. These differences of agreement between charts were also found in the subsample of healthy pregnant women showing a κ value of 0.555 (Table 4).
Frequency distribution (%) of pregnant women as diagnosed by the RM chart and the AEA chart in their nutritional classification at the beginning of pregnancyReference Mardones and Rosso 8 , Reference Atalah, Castillo, Castro and Aldea 9

κ value for agreement in total sample: κ=0.544; in healthy women sample: κ=0.555.
Total sample (n=27,613) and subsample of healthy pregnant women (n=11,465). Sotero del Rio Hospital, Santiago, Chile, 2000–2004.
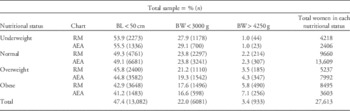
Percentages of BL<50 cm, BW<3000 g and BW>4250, were similar for the RM and the AEA charts and none of the differences were statistically significant (Table 5). This information is referred to the proportion of subjects born with an specific at risk category. For example, in the case of subjects with BL<50 cm born to underweight women as classified by the RM chart would be 53.9% (2273 newborns) and the remaining proportion being 46.1% (1945 newborns) with BL⩾50 cm. As maternal BMI increased the prevalence of newborns with BW<3000 g or BL<50 cm decreased, while the prevalence of BW>4250 g increased. Similar results were observed when mean values of BW and BL in those at risk categories were compared (data not presented).
Frequencies of newborns with birth length <50 cm, birth weight <3000 g and birth weight >4250 g, at each category of the nutritional status as diagnosed by the RM chart and the AEA chartReference Mardones and Rosso 8 , Reference Atalah, Castillo, Castro and Aldea 9 in the total sample (n=27,613)*

*McNemar’s χ2 test: P values were not significant for all comparisons.
Sotero del Rio Hospital, Santiago, Chile, 2000–2004.
The number of newborns with BL<50 cm, BW<3000 g and BW>4250 g, was higher in women classified as underweight or obese by the RM chart than those of the AEA chart (Table 5). Similar differences were found in the healthy pregnant women subsample (data not presented).
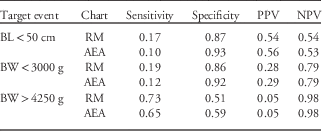
PPV and NPV were similar for the two charts in the total sample while sensitivity values were always higher for the RM chart; by contrast, specificity values were higher for the AEA chart (Table 6). Similar numbers were found in the healthy pregnant women subsample (data not presented).
Sensitivity, specificity, and positive and negative predictive values for both charts corresponding to each target event (BL<50 cm; BW<3000 g and BW>4250 g) in the total sample (n=27,613)
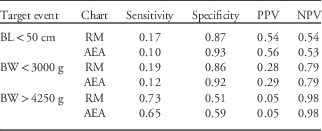
BL, birth length; BW, birth weight; PPV, positive predictive value; NPV, negative predictive value.
Sotero del Rio Hospital, Santiago, Chile, 2000–2004.
Discussion
Since the AEA chart was developed using the RM chart approach, their similarity is not surprising. However, as shown by the present results, the seemingly small differences in the definition of ‘normal’ maternal nutritional status determined considerable differences in the outcome of the pregnancies. The RM chart was more accurate than the AEA chart in terms of its capacity to identify underweight and obese women who are at risk of delivering babies with BL<50 cm, BW<3000 g and BW>4250 g. Thus, projected to the entire country population, the negative impact of applying the AEA chart could have been significant. In addition to the higher morbidity and mortality risks of the low BW and BL categories during the first year of life, long-term undesirable outcomes including increased risk of coronary heart disease, stroke, diabetes and raised blood pressure have been described. 1 , 23 , Reference Adair 24 The nutritional environment during foetal development and the first 2 years of life has been linked to childhood obesity.Reference Oken, Kleinman, Belfort, Hammitt and Gillman 25 – Reference Langley-Evans and Hall Moran 27 In addition, obesity during childhood is also associated with increased risk factors of cardiovascular disease and diabetes.Reference Langley-Evans 28 Those associations have been also reported in Chilean children.Reference Mardones, Arnaiz and Barja 14 , Reference Mardones, Arnaiz and Pacheco 21
One important conclusion of this study is that the AEA chart reduced the obesity and underweight maternal diagnoses and that a larger number of ‘nutritionally normal’ pregnant women, as classified by the AEA chart, deliver more infants at risk than both mothers classified as either underweight or obese. The RM chart, with a smaller area of ‘normal’ maternal nutritional status and proportionally larger areas for underweight and obese categories, could help to prevent more newborns at risk than the AEA chart in those categories of maternal nutritional status. Sensitivity values were higher for the RM chart confirming that view. Since the more sensitive RM chart had a much higher number of at risk BW and BL cases in the underweight and obese categories it is preferable to sacrifice the higher specificity of the AEA chart and use the former chart.
Misclassification errors were similar for both references. Given both the short term and the long-term implications of the undetected cases associated to the AEA chart it would be advisable to use the RM chart.
These conclusions have the limitation that they were obtained in an observational study. However, the comparison of the two charts was made using the same sample or sub-sample of women which had a very high number of subjects. The consistency of the results presented in this observational study supports the use of the RM chart.
The inclusion of a subsample of healthy term mothers allowed a better assessment of maternal nutritional influences on BL and BW. The proportion of underweight women diagnosed by both charts was higher in the subsample of healthy women meanwhile the proportion of obese women diagnosed by both charts was lower in the subsample of healthy women. Exclusion of main morbidities and pre-term deliveries produced this new nutritional distribution of women. Underweight during pregnancy became a more important factor in the prognosis of risky BL and BW newborns than in the total sample.
Some of the primary health care activities performed by the health personnel in the clinics may be influencing a better prognosis of foetal growth in women diagnosed as underweight and obese. Being underweight during pregnancy as defined either by the RM chart before 2005 or by the AEA chart after 2004 leads to receive a special education package to improve home diet and complementary food from the National Food Supplementation Program (NFSP). The NFSP delivers to underweight pregnant women 3 kg of powdered milk per month; other women receive just 1 kg of powdered milk. That powdered milk, so-called ‘Purita Mama’, is fortified with multi-micronutrients and omega-3 PUFAs.Reference Mardones, Urrutia and Villarroel 29
Data from two experimental studies conducted in Chile support the possibility of a positive effect of multi-micronutrient fortification of powdered milk on mildly undernourished women.Reference Mardones, Urrutia and Villarroel 29 , Reference Mardones-Santander, Rosso and Stekel 30 The presence of overweight or obese diagnoses presently leads to an educational intervention to reduce the home diet.
Both AEA and RM charts are built with BMI values during the whole pregnancy and, therefore, can guide weight gain in a proportional manner to the individual maternal height. The higher sensitivity values of the RM chart would permit to select that instrument in the Latin American region.Reference Scott, Andersen and Valdez 12 The RM chart may be also used in many developing countries around the world, because in this chart, short and tall women are recommended to gain proportionally more and less weight, respectively, than average height women.Reference Gluckman, Hanson, Seng and Bardsley 3
The Institute of Medicine guidelines have been incorporated in some developing countries around the world.Reference Scott, Andersen and Valdez 12 However, they just use preconceptional BMI and thereafter a specific range of weight gain in each nutritional category without individual consideration to maternal height; 1 , 31 they are intended to be used for women in the United States and the committee suggested that they are potentially applicable to women of other developed countries. 31 In developing countries there is a higher proportion of short women than developed countries, who in turn are prone to present intrauterine growth retardation and other morbidities at birth;Reference Adair 24 , Reference Martorell 32 , Reference Krasovec and Anderson 33 most of these women would need to gain weight proportionally to their height rather than using an absolute weight range as in the United States.Reference Gluckman, Hanson, Seng and Bardsley 3
The 2009 Institute of Medicine chart may be more appropriate for developed countries, where it could be expected that most women are rather tall and a proportional to height pregnancy weight gain would be less important; the absolute weight range for each nutritional category, as in the United States, would be suited without major problems.
The relatively high national proportions of at risk newborns in Chile are calling attention for further prevention activities; 34 among 247,357 national live births delivered in year 2011, BL<50 cm, BW<3000 g and BW>4250 g, reached 45.88%, 21.82% and 3.07%, respectively. The national distribution of those at risk cases for year 2011 was quite similar to the total sample of this study, a fact that makes possible to perform direct calculations of the national impact of using the RM chart in comparison with the AEA chart. Calculations of the population-attributable risk of obesity and chronic diseases are urgently needed to select preventive activities.Reference Garmendia, Corvalan and Uauy 35
Regarding the need of further prevention activities, an important additional observation of this study was that the added number of at risk newborns in the underweight and obese categories of each chart was lower than the at risk added numbers of newborns in the normal and overweight categories of each chart (Table 5). It means that regardless the risk stratification used, that is RM or AEA, the number of at risk newborns delivered by the group of low-risk mothers is higher than the one that comes from high-risk mothers. This is a phenomenon observed in all chronic diseases and part of the limitations of the so called ‘high-risk strategy of prevention’.Reference Rose 36 Prevention strategies with the highest cost effectiveness are the ones that don´t use risk stratification and cover the whole population. It would mean 100% coverage of important interventions, such as maternity leave, alcohol or tobacco regulations, immunizations or any other population-wide measure that could lower risk factors for specific pregnancy diseases, such as preeclampsia, preterm birth, etc. On the other hand, selected cost-effective high risk strategies are justified as a complement to population-wide ones, and risk cutoffs could vary over time according to changes in the magnitude of the target population or resources. In the case of Chile, as birth rate falls, it is suitable to prefer a more sensitive definition like the one used by the RM chart.
Acknowledgements
The authors are grateful to the physicians and midwives in charge of the clinical aspects of the present study.
Financial Support
Chilean Ministry of Health and Pontificia Universidad Catolica de Chile.
Conflicts of Interest
None.
Ethical Standards
The authors assert that all procedures contributing to this work comply with the ethical standards of the relevant national guidelines on human experimentation provided by the National Fund for Research on Science and Technology (FONDECYT) and with the Helsinki declaration of 1975, as revised in 2008, and has been approved by the Ethics Committee of the School of Medicine (Pontificia Universidad Catolica de Chile) and Dr. Sotero del Rio Public Hospital.