

Surveys conducted over the internet have become ubiquitous and reliable. However, internet surveys are generally not the probability samples that researchers prize, samples that, for many years, they got by using telephone and face-to-face designs. Nevertheless, the barriers to representativeness for internet surveys are coming down and telephone surveys are increasingly plagued by low response rates and sampling challenges (Sala and Lillini, Reference Sala and Lillini2015). We may have reached a point where internet surveys using commercial panels will satisfy the needs of academic researchers at least as well as telephone surveys (Ansolabehere and Schaffner, Reference Ansolabehere and Schaffner2014; Pasek, Reference Pasek2016). There is also the matter of cost: internet surveys are 5 to 15 times less expensive than comparable phone surveys and over 50 times less expensive than face-to-face, giving the internet mode a big advantage in terms of statistical power. Internet surveys also offer a much greater set of potential stimuli, such as images and video, easier experimentation and varied question types. So the mixed-mode 2015 Canadian Election Study (CES), which combined telephone, internet and mail modes, is now typical of election studies.Footnote 1
Election studies like the CES must optimize their design on sample size, cost and data quality. Investigators and funding agencies therefore need up-to-date evidence on these criteria. This paper's chief purpose is to compare telephone interview data (conducted by ISR-York) with web data (using online panellists purchased from Survey Sampling International (SSI)). A tangential benefit of the present study is the presentation of a significant amount of public opinion data from the CES.
Much of the literature on internet surveys goes out of date within a few years of publication. Most of the available internet-to-phone comparisons examine voluntary opt-in internet panels (see Pasek, Reference Pasek2016), which were common until recently. But the relevant comparison is now with commercial panels where the sample providers aggressively recruit respondent-panellists and provide meaningful incentives differentially so as to iteratively construct a large, diverse panel from which the most representative sample possible can be drawn. A second reason for another such study is that the comparability of the modes may be, to a large extent, particular to the phenomenon being studied. Though previous literature encompasses surveys on topics such as health and tourism, both selection effects and measurement effects may be specific to surveys on public affairs (Vannieuwenhuyze et al., Reference Vannieuwenhuyze, Loosveldt and Molenberghs2010), especially ones that aim to measure sensitive or private political attitudes and behaviour.
Pasek (Reference Pasek2016) reviews the considerations relevant to comparing survey modes. We refer the reader there for a full literature review on survey mode comparison (or see Bytzek and Bieber, Reference Bytzek and Bieber2016). There is a handful of published work that compares survey modes for surveys of political behaviour. Chang and Krosnick, with data from 2000, showed that the internet sample was “biased toward being highly engaged in and knowledgeable about the survey's topic (politics)” (2009: 641). They concluded that “the nonprobability Internet method yielded the most accurate self-reports from the most biased sample, while the probability Internet sample manifested the optimal combination of sample composition accuracy and self-report accuracy” (2009: 641). This seemed to be the state of affairs until quite recently, but the lay of the land in 2000 was quite different from what it is today given the diffusion of cellphones, the advent of smartphones, and the ubiquity and ease of web technologies.
The 2005 British Election Study used both face-to-face interviewing and an internet panel, finding little difference for understanding the determinants of vote choice (Sanders et al., Reference Sanders, Clarke, Stewart and Whiteley2007) and only slight differences in the marginal distributions of attitudes. Stephenson and Crête (Reference Stephenson and Crête2011) came to the same conclusion when comparing random-digit dialling (RDD) telephone and opt-in internet panel modes for the 2007 election in Quebec. Both studies found no mode differences with respect to hitting the actual election result. The 2009 German Longitudinal Election Study data found that the opt-in online panel did the poorest job matching the election results but produced identical conclusions about the determinants of vote choice (Bytzek and Bieber, Reference Bytzek and Bieber2016). The most informative study for our purposes used data from 2010 to compare phone, internet, and mail surveys about politics in the US. Ansolabehere and Schaffner asked: “Does survey mode still matter?” The answer was a resounding “no”: “researchers will not consistently get more accurate results, nor reach substantially different conclusions, when using one mode relative to another” (2014: 301). In fact, that study's telephone survey produced the highest total error on the marginal distributions of key variables that were benchmarked to population figures.
Plan of the Paper
The weight of the recent evidence implies minimal differences between modes, so we do not posit any theories or hypotheses about differences. Like other studies, we compare the survey modes on “each of three types of inference—point estimates, relations between variables, and trends over time” (Pasek, Reference Pasek2016: 2). We add elements that have not yet appeared in the literature: a detailed description of the quality of the web data, comparison of their performance in capturing campaign dynamics and a wider range of benchmarks to which both the web and phone data can be compared. First, we describe the surveys. Next we examine measures of data quality applied to the two modes and then compare the modes to known benchmarks. We then compare the survey modes with respect to campaign dynamics, political engagement, attitudes and correlational inferences. Finally, we give recommendations for future election studies.
Preview of the Findings
We find that:
-
1. The internet mode is so much less expensive per interview that it provides significantly greater statistical power.
-
2. There is no glaring difference on the quality of individual responses to questions.
-
3. The internet sample is slightly better than the telephone in its ability to match verified population quantities from the census and other Statistics Canada surveys.
-
4. The telephone mode suffers from a combination of:
-
a. self-selection into the sample of citizens who are more engaged with politics and generally more optimistic and open to difference, and
-
b. social desirability bias on responses to questions about disadvantaged groups.
-
-
5. There is no clear difference between modes on political attitudes more generally nor for models of vote choice.
The Surveys
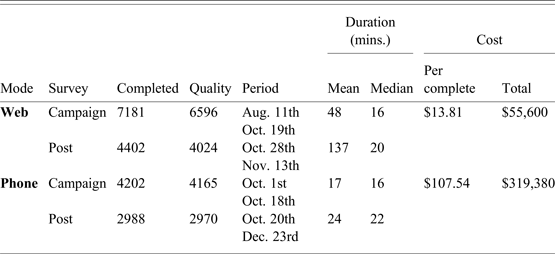
The 2015 CES was a dual-mode telephone (RDD) and internet study, with respondents sampled and recruited independently.Footnote 2 We call these the phone and web surveys. Table 1 gives descriptive information. The surveys were conducted from shortly before the start of the campaign until election day and then reinterviews took place after election day.
Survey Details

The cost per complete are calculated based on respondents who have completed both questionnaires (CPS and PES) and who passed the quality threshold.
The telephone survey has been the cornerstone of the CES since 1988, when it was first conducted from the Institute for Social Research at York University with a rolling cross-section design. The survey has been remarkably constant since. The typical design consists of a campaign period study (CPS), a post-election reinterview (PES), and then a mailback questionnaire (MBS). The number of completed interviews has typically been around 4000 (CPS), 3000 (PES) and 1300 (MBS). This relatively large sample size has been thought necessary to allow for analysis of campaign dynamics and analysis by province. The total cost in 2015 dollars has been about $90 per CPS-PES completed interview, with a total study cost between $250,000 and $400,000.
ISR uses a random-digit dialling list purchased from a leading provider. It includes cellphones, but only accidentally, and is not constructed to be representative of the proportions of land and cell lines in the “population” of telephone numbers. Interviewers use CATI terminals and place calls without a predictive dialer. This typically results in a response-rate of around 40 per cent, well above the market-research industry norm of 10 per cent and close to Statistics Canada's nearly 50 per cent RDD response rate. In 2015, the CPS response rate was 37 per cent and the PES re-interview rate was 71 per cent.
The web survey used a sample purchased from Survey Sampling International (SSI), which sent invitations out to its panel and directed them to a survey instrument implemented by the CES on the Qualtrics platform. Web respondents were invited to do the post-election survey but not a third survey equivalent to the mailback survey. SSI uses extremely complex, proprietary methods to recruit internet panellists and one-off survey respondents and to weight the sample frame for maximal representativeness. It is not possible to compute anything like a response rate, since SSI offers multiple surveys at random to respondents. Incentives vary across SSI's subpanels, but generally have a value for surveys of this length between one and four dollars. Among respondents with good data quality, the re-interview rate for the 2015 web PES was 61 per cent.
Cellphones and Landlines, Merging and Weighting
Survey researchers now confront the fact that many people cannot be reached by landline. In 2013, Statistics Canada found one in five households had no landline, rising to 60 per cent of households where all persons were under 35. Given this trend, most telephone surveys use dual-frame cellphone-and-landline lists. Unfortunately, the 2015 CES could not afford the cost of a cellphone-only sample list, so cellphones only occur randomly in the overall list. To study the consequences, we collected data on the phone respondents’ type of phone line (cellphone, landline, or VoIP), as well as the web respondents’ answers to the question: “Do you have a landline that you use to make calls?” Only 5 per cent of the phone sample did the interview via cellphone. But, far from being young and less politically engaged, they are three years older (mean = 59 years) and slightly more interested in politics on the 0–10 scale (mean = 7.5) than the others.
The SSI cellphone-only question is more useful. The proportion in the web sample without a landline is 25.6 per cent, which is probably very close to the population proportion, given that Statistics Canada estimated it at 21 per cent in 2013. In the web sample, the average age of those who do not use a landline is 9 years lower (mean = 39 years) and interest is a half-point lower (mean = 6.4) than those with a landline. We use this indicator below to try to separate selection from measurement effects and evaluate the seriousness of the problem of the phone CES not using a cellphone-only sample.
The web and phone data cannot be weighted identically due to their very different sampling methods. We can, however, apply post-stratification weights to age and gender, as well as, separately, province and household-size in the phone data. However, the phone data is significantly skewed older and the mean age remains three years too old even with weighting (See Figure A1 in the appendix). The web survey is weighted simply to provincial population proportions because its age and gender distribution is so close to the population.
Data Quality
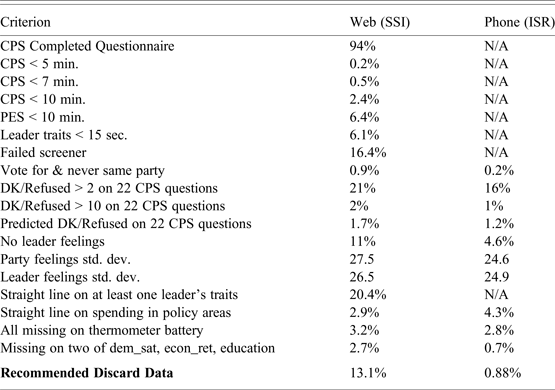
Are the web data good enough to meet academic standards for an election study? Where possible we compare modes on equivalent criteria, but since the phone is the standard, the burden of proof is on the web. Table 2 presents indicators based on a growing literature on quality in self-administered surveys. We look for respondents with high levels of non-response, who take too little time, who responded to question batteries in a “straight line,” or whose responses are contradictory or nonsensical.
Comparison of Data Quality

Percentages are based on completed questionnaires unless indicated.
We begin with time. Our judgment is that the CPS should never take less than 7 minutes and the PES never less than 10 minutes, even for a technologically adept, politically sophisticated respondent who reads quickly and has an excellent internet connection.Footnote 3 On the web, only 0.5 per cent completed the CPS in less than 7 minutes, while 6.4 per cent took less than 10 minutes for the PES. For time-on-questions, we look at leader traits presented on consecutive screens. Processing these and thinking about a response should take at least five seconds per screen, such that being under 15 seconds in total (20 in Quebec) should indicate a respondent not making a genuine attempt to answer thoughtfully. The data show that 6.1 per cent of web respondents used less than 15 seconds.Footnote 4
On non-response (“don't know,” “refuse” or skip responses) the web data compare favourably with the phone survey: a nonlinear prediction model for 22 CPS questions common across the modes gives predicted values of 1.17 for the phone and 1.65 for the web. The percentage with more than two out of 22 non-responses is similar: 21 per cent on the web and 16 per cent on the phone. Web respondents are responding to the questions.
There are significant differences between modes in a few rows of the table. The percentage who had no response on the feeling thermometers for three major party leaders (Harper, Trudeau, Mulcair (ROC) / Duceppe (QC)) was 11.4 in the web data and only 4.6 on the phone. Obviously, a live interviewer promotes responses. Yet the web data seem to fare better on differentiation in the spending items.
Looking at the data quality measures altogether, we are optimistic that web data will be as good as phone data if the sample provider uses best practices for sample selection, monitoring and incentives. We also recommend that users sweep the data and discard respondents judged not to have taken the questionnaire seriously (Berinsky et al., Reference Berinsky, Margolis and Sances2014; DeSimone et al., Reference DeSimone Justin., Harms and DeSimone2014).Footnote 5
We take a comprehensive, balanced approach to screening the data, and calculate for CES users a “discard” variable (for campaign and post-election waves separately) that allows removal of respondents who satisfied one or more of the following “failure conditions”:
-
• Incomplete: Did not get to last 5 per cent of questionnaire.
-
• Complete CPS interview less than 7 minutes.
-
• No party feeling thermometer responses.
-
• No leader feeling thermometer responses.
-
• Less than 15 seconds on the three leader trait screens.
-
• Refused or don't know or skipped on two of education, democratic satisfaction, and economic retrospection.Footnote 6
-
• Complete PES interview less than 10 minutes.
This results in a discard rate of 13.1 per cent in the web data and just under 1 per cent in the phone data.Footnote 7 In what follows, we use only the higher quality data, though it made little difference. The web data's large cost advantage makes discarding this much data unproblematic for statistical power.
Panel Attrition
Given the CES design as a pre- and post-election panel study, we also examine the reinterview rate and the extent to which selection bias is exacerbated in PES reinterviews. The phone has an 8 point advantage on reinterviews in the good quality data: 71.9 per cent (2841/3950) to 63.6 per cent (3917/6758). However, selection effects are strong and different in the two modes, pushing the phone post-election data even more in the direction of more educated, more attentive respondents. The web PES leans in the direction of older, higher income respondents. We show selection effects for education, knowledge, income, and age in the appendix (Figure A2). To illustrate, a 25-year-old respondent with only high school, no facts correct and the lowest income level has a reinterview rate predicted at 54 per cent in the phone and 39 per cent in the web, while a person with a post-graduate degree, all four facts correct, the highest income level, is predicted to be reinterviewed at 88 per cent in the phone and 78 per cent on the web. While panel selection bias seems worse on the web, the effect is driven by age, so simple weighting can correct the problem. That is not possible for the variables influencing attrition in the phone data.
Representativeness: Comparing with Benchmarks
Comparing survey modes to objective benchmarks is critical. The idea is to assess surveys’ accuracy on validated measures of population parameters (Ansolabehere and Shaffner, Reference Ansolabehere and Schaffner2014). The benchmarks are constructed from sources such Statistics Canada or Elections Canada, documented in the appendix (Table A1).
We use the weighted data to calculate point estimates and 95 per cent confidence intervals after each variable has been dichotomized (Ansolabehere and Shaffner, Reference Ansolabehere and Schaffner2014; Pasek, Reference Pasek2016). Our figures show point estimates as dots and the validated benchmarks as vertical lines.
In Figure 1 we see important differences between modes and benchmarks. Both samples over-represent people over 50 and those with a bachelor's degree, though the phone does this to a greater extent. The phone and web samples also both have a slightly higher proportion of Francophones than the population. And both modes oversample atheists and undersample those who consider religion very important. The phone has too many married respondents.
Comparing Modes with Benchmarks: Demographic and Politically Relevant Variables

Previous CES have always had fewer unemployed respondents than the StatsCan figures. The two survey modes in our data are a fair distance apart on employment-unemployment. The phone is below the benchmark by 1.5 points and the web is above it by 2.7. This is perhaps not surprising given that the SSI web panel is composed of individuals who get rewards to participate in surveys and thus the unemployed might have strong reasons to do web surveys.
Excluding turnout, the biggest difference between our samples and the benchmark is on the variable measuring volunteering, but only on the phone. A measure of volunteering appeared on the CES in a deliberate attempt to gauge representativeness on a validated measure of social and community engagement. The benchmark comes from Statistics Canada's General Social Survey of 2013, a large phone survey with a very good response rate (46%).Footnote 8 Looking at volunteering in Figure 1, we see the web hits the population target while the phone overrepresents volunteers at 14 percentage points above the benchmark value (phone: 56%, web:43%, StatCan benchmark: 42%). That is, CES phone respondents are significantly more socially engaged than the general population, even after weighting for age. Social desirability bias cannot be driving this effect, as the benchmark is also a phone survey. This must be self-selection; volunteering is driven by factors very similar to political engagement and the phone survey is much more attractive to the socially and politically engaged.
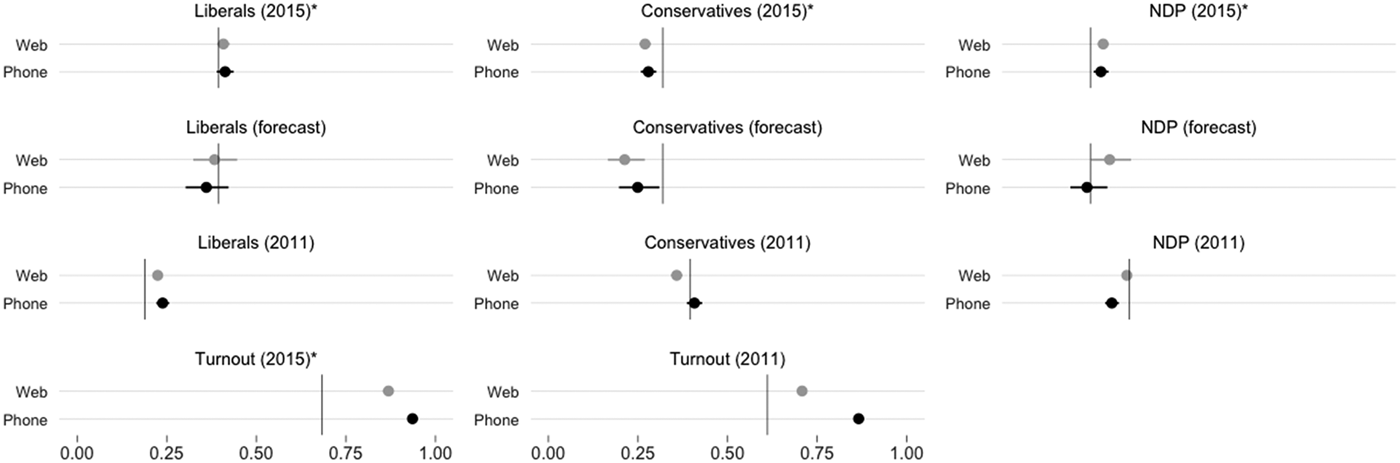
Though both samples overestimate turnout, the web does a bit better, as seen in Figure 2. The phone is 25 points too high for both 2011 and 2015 turnout, leaving very little room to study factors influencing turnout. The web is 19 points high for the immediate reporting of 2015 turnout, but only 10 points high on 2011 turnout. The social desirability bias to misreport turnout must be stronger on the phone (contra Sanders et al., Reference Sanders, Clarke, Stewart and Whiteley2007: 264).
Comparing Modes with Benchmarks: Vote, Turnout, and Vote Forecast

Finally, we see in Figure 2 that the modes are virtually indistinguishable on 2015 vote intention (labelled forecast), reported vote in 2015 (PES), and vote recall from 2011. Given the wide usage of the CES in studies of voting behaviour this is reassuring.
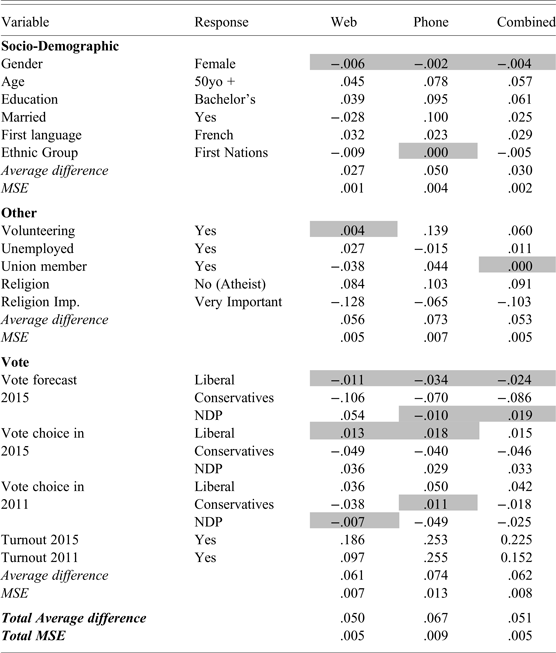
So far, we have examined each variable separately. To get a “final score,” we now consider the total error for each survey mode. Like Ansolabehere and Shaffner (Reference Ansolabehere and Schaffner2014), we calculate the average difference for each mode as well as the mean squared error (MSE). The MSE, the average squared difference between each variable and its validated benchmark, is the most common measure of total survey error (see Biemer, Reference Biemer2010; Groves and Lyberg, Reference Groves and Lyberg2010).Footnote 9 Table 3 gives the results, variable by variable and in total.
Differences between Modes and Benchmarks

The table shows differences between point estimates from the two samples and the actual value used as a benchmark. Shaded cells indicate values for which the 95% confidence interval includes the benchmark value. See appendix for benchmarks sources.
Table 3 only shows the difference between point estimates and the benchmark (see Appendix Table A.2 for the full results). Shaded cells indicate that the 95 per cent confidence interval included the benchmark value. The table also shows what happens when the web and phone data is pooled.Footnote 10 In sum, both modes offer relatively low total survey errors, though the web sample outperforms the phone. In this respect, we corroborate recent studies in political science that give the advantage to internet election studies.Footnote 11
Campaign dynamics
Do phone and web surveys capture the same campaign dynamics in vote intention and attitudes? There is no scholarly literature on this question. One major virtue of the phone is controlling sample release for a rolling cross-section design (RXS, see Johnston and Brady, Reference Johnston and Brady2002). Web samples purchased from a provider with a proprietary recruitment system require compromises from a true rolling cross-section. Often, researchers cannot get detailed information on the procedures followed by the sample provider for sample release. The CES team asked SSI to target a certain number of completed interviews per day, which required adjusting the number of invitations sent out each day, sometimes as a reaction to previous days’ number of completed interviews. Does this threaten our ability to make inferences about dynamics using the web data?
The daily sample sizes were not much different between the two modes, both averaging 100 to 150 per day. The web had a slight advantage but its daily sizes were more volatile. Even the strictly controlled telephone rolling cross-section is far from perfect, however; it takes a while for the survey to ramp up, resulting in low power in the first week of the campaign, and the end of the campaign shows as much volatility as in the web survey.
Can the web mode at least match what we can learn from the phone RXS. As Pasek argues, “probability and nonprobability samples may not reflect the same distributions of attitudes and behaviours at any given time, and, yet, they may reveal similar patterns of change over time… Yet… if aggregate changes are driven by a subset of the public rather than mass movement, trends from nonrepresentative samples could be misleading” (2016: 1).
While statistical testing is theoretically possible, graphical analysis tells us what we need to know. We show two figures depicting movement in key political variables: vote intention and feelings about the leaders, leaving feelings about the parties for the appendix. The figures cover only the period when the phone survey was in the field. The lines are produced by local regression of the (weighted) daily means. We do not present confidence bands, since both modes have very uniform and similar margins of error.
Overall, similarity across modes is the theme in these graphs. Apart from one notable divergence, they track the same forces over the campaign. Looking at vote intention first, we have something of a benchmark against which to compare our two modes. The solid lines in Figure 3 depict an aggregation of the polls, which amounts to daily samples well over one-thousand, using a variety of polling methodologies. It is widely accepted that an aggregation of polls is very likely to be very close to the true levels of support on a given day (Pickup and Johnston, Reference Pickup and Johnston2008). Indeed the polls converged very close to the popular vote results.Footnote 12
Vote Dynamics

While both modes track the movement in the polls, one key lack of correspondence is a cause for concern. The phone data show a dramatic 10-point rise in Conservative support at mid-campaign, only to fall back to the same level as the polls by campaign's end. The polls do exhibit a very slight Conservative rise that is not picked up in the web data. But the divergence from the polls and web data suggests that the phone is unrepresentative in some way for this period. In fact, it seems to sample Conservative partisans at a significantly higher rate (6–8%) over this ten-day period. Unfortunately, we cannot explain this quirk of the phone survey and note that, in view of the last eight CES studies, this is extremely atypical. We hope this quirk does not detract from the general point that both modes generally show the same dynamics.
For the other parties, the web and phone data seem to be quite similar and track the polls very well. The Liberal movement in the phone data lags the polls and the web, which is likely just the mirror image of the divergence in the Conservative share. Both modes track the severe drop in NDP support. Reassuringly, the decline in indecision shows voters making up their minds in both modes, though indecision is significantly higher overall in the phone data.
In Figure 4, showing Leader Feeling Thermometers, we see both modes picking up gains for Trudeau, a last-minute decline for Harper and Duceppe, and a modest two-stage decline for Mulcair. Again, the picture is of similar dynamics with the phone somehow producing more volatility. Our Party Feeling graph (appendix) has the same character, though movement is weaker, as it should be. One explanation for greater phone volatility is slightly smaller sample sizes.
Leader Dynamics

We have little opportunity to formally test for similar dynamics in the web and phone data series because there was little movement on most measures included in both. There was significant movement on the question asking which party would be best for the economy. We estimated various time-series models that confirm the significant movement (particularly views on the Liberals vis-à-vis the NDP) but the models did not differ significantly by survey mode. Figure A3 in the online appendix shows how close the two modes are in tracking this attitude through the campaign.
The foregoing analysis constitutes the first evidence on the comparability of phone and web survey modes for capturing campaign dynamics. We are certain that neither mode is wholly superior on this criterion. However, the advantage in daily statistical power possible from a much-lower-cost internet sample makes it the obvious choice for campaign dynamics, especially if those dynamics are thought to be found only among particular subsets of the electorate (see Fournier et al., Reference Fournier, Cutler and Soroka2012).
Political Engagement
We now examine measures of political engagement: interest in politics, attention to the campaign and political issues, knowledge, participation and media consumption. As is clear from Figure 5, the differences are not enormous but phone respondents are significantly more interested in politics and reported more attention to the campaign. The same is true on attention to issues. Respondents in both samples say they are attentive to most issues, with Health Care at the top. For all seven issues, phone respondents report greater attention, with Defence and Immigration exhibiting the widest differences and Welfare the least.
Political Interest and Attention

On political knowledge, the CES contains four factual questions.Footnote 13 The two modes split the spoils here, each one on top for two questions out of four. The mean total of facts correct is significantly higher on the phone, but once we control for age the difference is non-significant. It is possible that some web respondents looked up the correct answer on the more difficult questions, despite the fact that they are paid panellists and have no real incentive to produce correct answers. This is one area where the phone may be slightly more accurate.
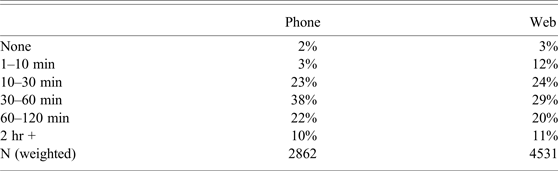
Media consumption and political participation are more tangible indicators of political engagement. Not surprisingly, phone respondents say they consume more news in general. The key question asks “On average, how many minutes or hours per day do you spend watching, reading, and listening to news?” When we code the open-ended phone responses to the web categories, we find the distributions quite close, with the exception of more web respondents in the lowest 1–10 minutes per day category (Table 4). Notably, web respondents report higher levels of reading and exchanging news over the internet.
Minutes per day reported news consumption

We can also compare modes on political participation (aside from turnout discussed above) with the caveat that these are self-reports. In this case, differences in participation across survey modes vary according to the type of participation, but phone respondents, in general, say they participate more. While web respondents are more likely to sign petitions, to be politically active on the internet, and to take part in a marches, rallies or protests, phone respondents are more likely to volunteer and to boycott products for ethical or political reasons. These differences comport with our general picture of the compositional differences between the phone and web samples.
Political Attitudes and Social Desirability Bias
The CES survey measured a wide variety of political attitudes, from values to issue opinions to orientations toward groups. In the online appendix we provide a table with the distributions of these variables by mode. To quickly summarize, we find little difference across modes in domain-specific spending preferences, except for immigration. On a range of foundational and current policy issues, differences were mostly non-significant. We do see web respondents slightly more likely to want the Senate abolished, to think government doesn't care what they think, and to think politicians are ready to lie to get elected, but these differences all but disappear when controlling for age. These opinion results are very encouraging for future studies hoping to get more respondents per dollar by using the web mode.
On economic attitudes, however, there are some notable differences. Two-thirds of web respondents say that the Canadian economy has gotten worse, 12 points higher than the phone. The groups also differ in their attribution of blame for the economy: 48 per cent of web respondents claim that the current government has made the economy worse, compared to only 27 per cent of phone respondents.
Similarly, we see a big difference on respondents’ levels of social trust. When asked the standard question (“Generally speaking would you say that most people can be trusted or that you need to be very careful when dealing with people?”), 54 per cent of phone respondents gave the trusting answer while only 31 per cent of web respondents did so. Neither the trust nor the economy differences disappear in the face of multiple socio-demographic controls. We suspect that social-psychological factors related to the difference in trust are responsible for much of the selection bias into the phone CES in the first place, and see this large attitudinal divergence as closely related to the difference in the behavioural measure of volunteering. These are important differences in sample composition that cannot be ignored.
When we turn to respondents’ feelings about groups on a 0–100 “thermometer” scale we begin to see the most important systematic pattern of differences on attitudes. Figure 6 displays the results for political parties while Figure 7 displays thermometers for different groups. There is little difference for the three major parties, little difference on Canada and the US, but large differences in feelings about marginalized or minority groups (“outgroups”).
Feeling Thermometers: Political Parties

Feeling Thermometers: Groups

The obvious suspect is a social desirability bias where respondents who feel negatively about these groups are inclined to hide their feelings to a live interviewer (Chang and Krosnick, Reference Chang and Krosnick2009; Kreuter et al., Reference Kreuter, Presser and Tourangeau2009). We therefore dig deeper into this set of questions, where the web and phone CES data would paint a different picture of Canadian public opinion. Recall that the samples differ on age, education, knowledge, and political engagement, all factors that have been shown to influence attitudes about minority and marginalized groups. Yet the fact that some feeling thermometer means are similar across modes rules out the possibility that any differences are inherent to the survey mode. Sample composition and social desirability bias on certain questions are likely jointly responsible for the differences across the two modes, so we try to disentangle the two where possible.
First, we look at questions related to immigration in Figure 8. Phone respondents are much more positive toward immigration and immigrants. The proportion of web respondents saying that Canada should admit fewer immigrants, spend less on immigrants and that immigrants take jobs from other Canadians is around 20 percentage points higher than on the phone. The fourth panel shows an even more striking difference. Asked about banning “Muslim women from covering their faces in public” a majority of the phone sample opposes this while an even bigger majority of the web sample supports it.
Immigration and Minorities

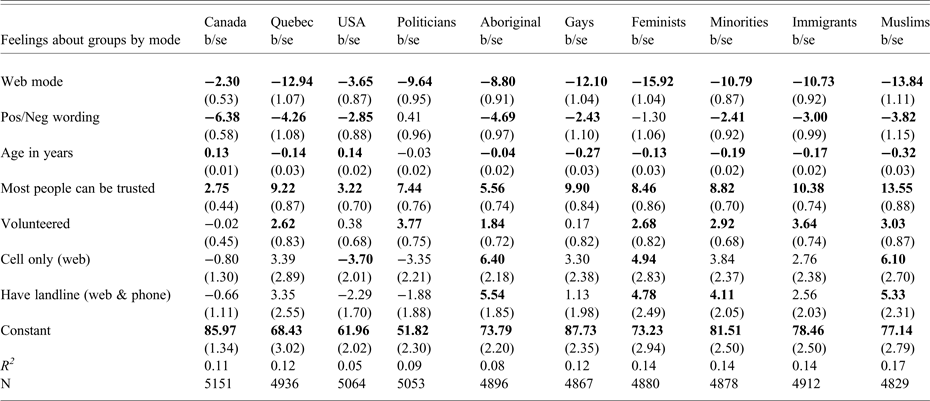
Based on the responses to feeling thermometer questions, social desirability bias seems a likely culprit, but is probably not the whole story. Our attempt to sort out the causes is a regression of each of the thermometers on the variables that differentiate the samples—age, trust, volunteering—plus an indicator for mode. We also include a measure of whether the phone survey was done on a cellphone and whether the web respondent has a landline or not.
Sample Selection or Social Desirability

Coefficients in bold are more than 1.64 times their standard error.
In the top line of Table 5 we see that the mode difference persists very strongly even controlling for the sample composition even though some of the compositional effects are quite large. The pattern of mode differences is the same as in the means shown in Figure 7: not much difference at all for Canada and the US, increasing from politicians and Aboriginals through minorities, gays and immigrants, to the biggest mode effect for Muslims and feminists. We are confident that social desirability bias is a big part of the mode difference and that the web mode measures these attitudes more accurately, as well as having more useful variance.Footnote 14 We have even more confidence because a separate model (not shown) confirms that the mode effect on the feminist thermometer is significantly weaker for women than for men.
In sum, while the phone and web groups give similar responses on many attitudes, there are very large differences in the marginal distributions on some critically important variables for our understanding of Canadian public opinion. These differences must be considered as scholars design multi-mode election studies. They might even call into question some of the findings from previous telephone studies.
Inference about Vote Choice
In sister studies, researchers have looked for differences in inferences in regression models across modes (Ansolabehere and Schaffner, Reference Ansolabehere and Schaffner2014; Bytzek and Bieber, Reference Bytzek and Bieber2016; Sanders et al., Reference Sanders, Clarke, Stewart and Whiteley2007). The general conclusion has been that differences are rare. Obviously, the range of possible behaviours and the unlimited possible models explaining those behaviours make analyses illustrative rather than determinative. Bearing this in mind, we estimate a vote choice model for 2015 in both modes.
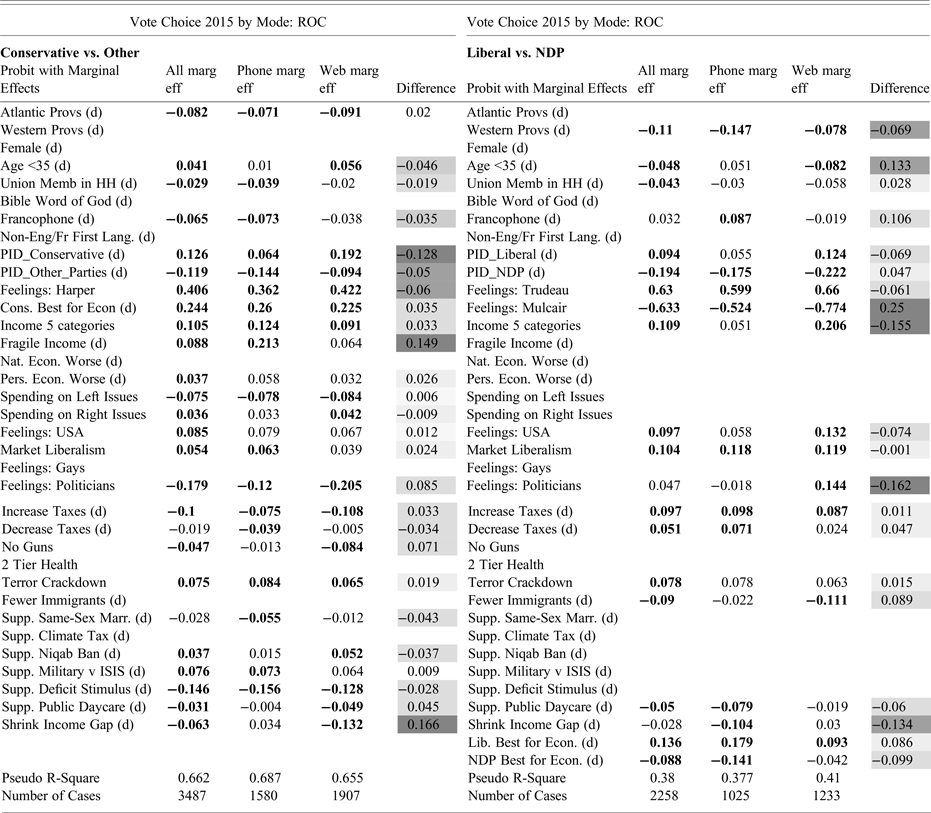
The challenge here is that vote choice models in multi-party Canada typically involve a huge number of coefficients. The most recent CES vote choice model (Fournier et al., Reference Fournier, Cutler, Soroka, Stolle and Bélanger2013) included thirty independent variables per party. To be comprehensive we would have to compare literally hundreds of coefficients across modes, parties, and variables. Here, then, we simplify by estimating a model like the one Fournier and colleagues (2013) used for the 2011 election, do so only for the rest of Canada (ROC) without Quebec, and omit the Green party choice.Footnote 15 We simplify further by estimating logit models that follow the decision structure most voters would have used: one for the choice between the Conservatives and the other parties (an approval model), and one for choice between the NDP and Liberals.Footnote 16 We do not mean to ignore important choices; we merely present part of the choice to examine the differences across survey modes.
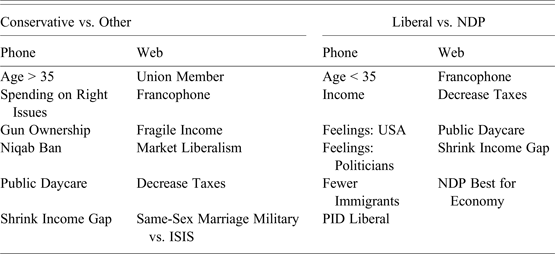
Table 6 presents the two estimations in two panels, with 35 coefficients for the Conservative choice and 37 for the NDP-Liberal choice. The panels’ left columns show results from the modes pooled together. Of the 72 estimated coefficients, 54 show a significant effect in one or both modes. Of these, 22 are significantly different from zero in only one of the modes. This is a wider divergence across modes than has been found by other researchers. And the pattern of differences defies characterization. Table 7 shows what each mode would have missed: effects indistinguishable from zero in one mode but significant in the other mode or the pooled data. Notably, the most sensitive salient issues in the campaign—the face-veil ban and immigration—appear unimportant if we only use a phone sample. This is a very serious shortcoming—damning for the phone mode—and it is likely due to the bias discussed above.
Vote Choice

Estimated by Probit. Marginal effects (probabilities) shown when all other variables at means.
Bold indicates p < 0.1 (d) is Dummy variable
Difference column shaded darker the larger are the differences between modes.
Blank cells indicate insignificant coefficients in all three columns (modes). Blank variable labels indicate variable not included in estimation.
Effects “Missed” by Mode

No judgment can be made as to the superiority of one mode or the other for modelling vote choice. The R2 statistics are very similar.Footnote 17 We cannot even say that one has certain tendencies. Clearly, both will produce interesting conclusions about vote choice, but even with these large samples researchers using each mode would tell different stories about what mattered and which were winning and losing strategies. This is troubling indeed. If a story must be told, we advise suggest pooling the data and letting the chips fall where they may.
The model presented here reflects common practice. But perhaps we should estimate simpler models (Achen, Reference Achen2005). Just to be sure, we estimated a significantly smaller model with 19 and 17 variables respectively. Twenty-one of the 36 were significant in one or the other or the pooled data but again, 9 of these 21 were only significant in one mode or the other. The divergence seems to be built into the differences in sample composition and mode-specific measurement.
Assessment: Statistical Power per Dollar
Given the significant difference in cost between the two modes, the advantages of the web over the phone in terms of statistical power are clear. The fact that the web enables larger sample sizes at a lower cost is especially important for finding the sorts of effects that election scholars are often interested in. Questions about campaign dynamics usually involve effects that are relatively small and found in specific subgroups, making statistical power paramount. For instance, if one were to ask “Did feelings toward Gilles Duceppe change significantly over the course of the campaign among Francophones in Quebec?” the answer would vary by mode because the web has twice the sample size of the phone.Footnote 18
To better illustrate the difference in power and cost, we go back to the 2011 election, where two campaign events were said to have had an impact on feelings toward leaders in Quebec and ultimately on the outcome of the election (Fournier et al., Reference Fournier, Cutler, Soroka, Stolle and Bélanger2013). The first event is Jack Layton's appearance on the Quebec talk show “Tout le monde en parle,” while the second is BQ's leader Gilles Duceppe appearing with Parti Québécois leader Pauline Marois at a PQ convention. According to Fournier and colleagues, the effect of the former was quite large while Duceppe appearing with Marois had a relatively small negative effect. This is simply an example of cases where we would need different minimum sample sizes to detect these effects reliably.
Figure 9 shows a post-hoc power analysis of these two campaign dynamics. The two panels of this figure can be read as an answer to the question: Assuming that the effects found in the 2011 sample are the “true” effects, how much does it cost to find a statistically significant effect? To do this, we use the results from 2011 to produce 500 simulations at different sample sizes (from N = 100 to N = 8000) and calculate the proportion of these 500 simulations that find a statistically significant difference in feeling thermometers before and after each event for each of these sample sizes. A power of .8—finding a statistically significant difference 80 per cent of the time—is often considered the threshold for a sufficient statistical power. The sample sizes are then multiplied by the cost per complete from 2015 (web: $13.81, phone: $107.54) to form the x-axis.
Power and Cost

Even for an effect as big as the Layton one, the cost of achieving a power of .8 is about $48,000 for the phone but only $6,000 for the web. For the much smaller Duceppe-Marois effect the cost for the same power would be $247,000 using the phone and $33,000 with a web sample. In other words, even for large effects, the difference in cost is so important that it becomes difficult to justify having a phone sample from a cost perspective.
Discussion
We have highlighted differences between the phone and web modes of the CES 2015 and this leaves us perhaps slightly at odds with the relatively few and minor differences found in comparable studies in other countries. We do not want to leave the impression that the differences are insurmountable, that either mode is to be abandoned entirely, that something has changed to produce larger differences than a few years ago, or that Canada is a special case. In fact, there are a great many commonalities across the two modes. It is impossible to say which is more representative, which better tracks campaign dynamics, which provides better estimates of engagement, knowledge and sophistication among Canadian voters, which paints a clearer picture of political attitudes, and which allows a richer or more accurate understanding of voter choice. This is probably a good situation, as it means researchers can use a mixed-mode design to address shortcomings in either mode (Dillman et al., Reference Dillman, Smyth and Christian2014). We imagine, however, that the cost consideration will be dominant and election study teams will not be able to justify paying for the additional confidence provided by a large-enough telephone sample. Our findings support the conclusion that internet mode should now be the default for election studies. And our findings should embolden researchers who are using online-only studies of recent Canadian elections, such as the Local Parliament Project (Loewen and Rubenson, Reference Loewen and Rubenson2015).
Reviewing the findings, some important themes stand out. First, the internet mode is ten times less expensive per completed interview. As we have shown, the implications for statistical power, particularly among subgroups, are obvious. Moreover, the internet mode allows researchers to conduct more experimentation, to present richer stimuli and to examine a greater diversity of topics by running a core questionnaire with different add-on modules at random. The much lower cost and access to large panels would also allow targeted, incentivized interviewing of populations that are impossible to study with a telephone survey of 4000: Aboriginal people, youth, the unemployed or new Canadians, for example. We do not wish to be read as saying that the research community should accept the same CES for much less money. Instead, scholars should be thinking of the tremendous opportunities for small-group analysis, subtle campaign effects, powerful experimentation, and a longer interview period pre- and post-campaign that would all be possible for a cost similar to that of recent years (for instance, $300,000).
Second, it is clear that the telephone's day as the gold standard for election studies has passed. The phone data quality is still high, but even the very good response rate is falling, cellphones were omitted from the sampling frame, and the interview length is problematic. The relatively good data quality comes at the cost of representativeness: the phone mode suffers from massive self-selection effects. It over-represents politically engaged, socially integrated, optimistic, altruistic people. Answering the phone and spending 20 minutes, twice, answering questions about one's attitudes is now an unusually pro-social act.
On the other side of the ledger, questions about the quality and representativeness of commercial opt-in panels are diminishing. Firms like SSI are concerned about, and take action toward, respondents who fail to take the surveys seriously and genuinely. In these panel providers’ technical documentation they refer to behaviour of this sort as “fraud” and remove panellists immediately if it is detected. Indeed, the incentivization of participation may well, in combination with aggressive recruiting and maintenance, result in a more representative sample with more-than-acceptable data quality. That our vote model was not obviously superior in the phone data, and was in one important way worse, shows that most internet panellists respond in a serious, honest way.
The concern only a few years ago was that opt-in panels produced a sample that was younger, better educated, more male, and more affluent (Ansolabehere and Schaffner, Reference Ansolabehere and Schaffner2014: 228; Shin et al., Reference Shin, Johnson and Rao2012: 217). In the 2015 CES it is the telephone mode that is too educated, too affluent, too socially integrated, and too politically sophisticated to be representative of the population. Notably, the CES had never adequately captured the unemployed and other disadvantaged populations; the internet mode now offers better representation of these citizens.
One possibility with the 2015 CES is to pool the web and phone data. If researchers accept both modes as valid measurement instruments there is no reason not to pool them. Some might argue that this throws the representativeness of the probability-sample phone study out the window, but we believe it is already long gone. Adding the web data actually pulls the phone data back close to the population benchmarks in most cases. For dynamics, pooling boosts daily statistical power. For inference, the pooled vote model looks more appealing to us, though who can really say which is closer to the true population model of vote choice?
The present study is the first to compare phone and web surveys for the purposes of understanding opinion dynamics, particularly over a short period like an election campaign. The RXS design continues to be central to the ethos of the community around the CES. We found that the internet sample was just as good on dynamics and if anything tracked the polls better than the phone survey. We require further analysis to learn whether the greater daily volatility in the phone mode comes from greater daily variance in representativeness or a sample that is much more attentive to the campaign. In the future, significantly larger daily samples from the internet mode could well improve understanding of campaign events and effects, as it has already done in other countries.
There is a great deal more work to be done to analyze these data from the 2015 CES. With the present paper and subsequent analyses it will be possible to provide a recommendation that maximizes the understanding scholars and the public can derive from election study surveys at a reasonable, sustainable cost. Given what we know right now, though, we are certain that future Canadian Election Studies will use the internet as their core survey mode.
Supplementary materials
To view supplementary material for this article, please visit https://doi.org/10.1017/S0008423917000610.