Introduction
Clay–organic interaction is arguably as vital to sustaining life as is photosynthesis (Jacks, Reference Jacks1973). Photosynthesis produces biomass for human beings and animals, while the clay–organic interaction (in soil) stabilizes organic matter (OM) against rapid microbial decomposition as indicated by a mean residence time of 4830 ± 1730 y for soil OM (Shi et al., Reference Shi, Allison, He, Levine, Hoyt, Beem-Miller, Zhu, Wieder, Trumbore and Randerson2020). Clay–organic complex formation lies behind the ability of soils to deliver ecosystem services that sustain life on the Earth (FAO, 2015). These services include, but are not limited to: (1) holding water in soil-aggregate pores and buffering its distribution on the Earth’s surface; (2) adsorbing nutrients and regulating their availability to plants; (3) filtering out chemical and biological contaminants; (4) sequestering and releasing carbon; and (5) holding and preserving genetic information (e.g. microbes) (Yuan, Reference Yuan2004).
Research on clay–organic interactions dates back to the 1950s (Martin et al., Reference Martin, Martin, Page, Raney and De Ment1955). The literature up to the early 1970s was reviewed by Greenland (Reference Greenland1965a, Reference Greenland1965b), Mortland (Reference Mortland1970), and Theng (Reference Theng1974). In 1990 the International Society of Soil Science established the Working Group MO, and in 2004 the International Union of Soil Sciences established Division 2.5 to promote research on clay–organic interactions. Since then, eight International Symposia have been held on the Interactions of Soil Minerals with Organic Components and Microorganisms (ISMOM) in various countries. Several proceedings have been published, covering various topics from environmental pollution and remediation to carbon sequestration and soil health. More recently, biochar has served as the organic moiety in the formation of clay–organic complexes for environmental applications (Wang et al., Reference Wang, Gu, Tan, Liu, Zhou, Hu, Cai, Xu, Zhang and Liu2019; Ramola et al., Reference Ramola, Belwal, Li, Wang, Lu, Yang and Zhou2020).
In parallel with fundamental research on clay–organic interactions in soils and sediments, organo-clays have found applications in a variety of industries (Nahin, Reference Nahin1961; Theng, Reference Theng1974, Reference Theng2012, Reference Theng2018; Guo et al., Reference Guo, Liu, Gates and Zhou2020). Organo-clays are produced typically by intercalating cationic surfactants, notably quaternary ammonium compounds, through ion exchange with the inorganic counterions of expanding phyllosilicates, such as montmorillonite. As a result, the initially hydrophilic clay mineral is converted to a hydrophobic organo-clay that can be incorporated into a wide range and variety of industrial and personal consumer products, such as paints, stains, specialty coatings, adhesives, and sealants, as well as lubricating greases, drilling fluids, and cosmetics (De Paiva et al., Reference De Paiva, Morales and Diaz2008). The type and quantity of surfactants used, together with the operational conditions for producing organo-clays, can be tailored to enhance such properties as thermal stability (Hedley et al., Reference Hedley, Yuan and Theng2007) and sorption capacity (Zhu et al., Reference Zhu, Zhou, Zhu, Xi, We and He2015), or lessen other properties, such as toxicity (Guégan, Reference Guégan2019) and swellability (Yu et al., Reference Yu, Zhu, Tong, Wu and Zhou2017).
Being good adsorbents of uncharged nonpolar organic compounds (Theng, Reference Theng1974; Zhao et al., Reference Zhao, Choo, Bhatt, Burns and Bate2017), organo-clays have enjoyed applications in the remediation of air, water, and soil (Yuan et al., Reference Yuan, Theng, Churchman and Gates2013; Biswas et al., Reference Biswas, Warr, Hilder, Goswami, Rahman, Churchman, Vasilev, Pan and Naidu2019) contaminated by hydrocarbons (Jaynes & Vance, Reference Jaynes and Vance1999), pesticides and herbicides (Brixie & Boyd, Reference Brixie and Boyd1994; Park et al., Reference Park, Ayoko and Frost2011), and pharmaceuticals (De Oliveira et al., Reference De Oliveira, Fernandez, Fougere, Destandau, Boussafir, Sohmiya, Sugahara and Guégan2018). Organo-clays have also been used in slow-release formulations of pesticides (Trigo et al., Reference Trigo, Celis, Hermosin and Cornejo2009) and other agrochemicals (Yuan, Reference Yuan2014) as well as in mitigating their environmental impacts.
A milestone in materials science was the synthesis in the late 1980s of the nylon 6-clay hybrid by scientists at Toyota Central R&D Laboratories, Japan (Kojima et al., Reference Kojima, Usuki, Kawasumi, Okada, Kurauchi and Kamigaito1993). Such hybrid materials, referred to as ‘polymer-clay nanocomposites’ (PCN), commonly contain <10 wt.% clay. However, because the clay nanoparticles are dispersed throughout the polymer matrix, PCN show superior thermo-mechanical, gas-barrier, and fire-retardant properties as compared to the corresponding pristine polymers. PCN have been incorporated successfully in automotive parts, sports gear, and packaging materials. These novel polymer-clay nanocomposites can also serve potentially as carriers of controlled-release drugs, antibiotics, and energy. For more details on the synthesis, properties, and applications of PCN, the books written or edited by Theng (Reference Theng2012), Bergaya et al. (Reference Bergaya, Detellier, Lambert, Lagaly, Bergaya and Lagaly2013), and Jlassi et al. (Reference Jlassi, Chehimi and Thomas2017) may be consulted.
Hydrothermal carbonization is a chemical process of converting wet biomass into hydrochar (and energy) using elevated temperatures and pressures (Wang et al., Reference Wang, Zhai, Zhu, Li and Zeng2018; Liu et al., Reference Liu, Zhang, Jin, Shuang, Sheng and Zhang2019). In other words, it imitates in a short period (hours to days) the natural coal-forming process that occurs over a geological timescale. After surface modification and activation, the hydrochar produced can serve potentially as an adsorbent of environmental pollutants (Hammud et al., Reference Hammud, Kumar, Maryam, Shafee, Fawaz and Holail2019; Zhang et al., Reference Zhang, Wang, Cai, Wilson and Lee2020). Being abundant, inexpensive, and non-hazardous, biomass is an environmentally friendly substitute for synthetic surfactants used in forming clay–organic complexes. However, limited information is available about the effect of clay-mineral type on hydrochar formation (Li et al., Reference Li, Shen, Huang, Li and Ye2014). Furthermore, the processes and mechanisms involved in the formation of clay–hydrochar complexes are not well understood.
The above summary of the literature aims to: (1) help students to appreciate the historical contributions of clay science to advancing research in agriculture, environmental protection, and functional materials; and (2) encourage clay scientists to collaborate in achieving such globally important goals as sustainable development, the Paris Agreement, and IPCC’s target of carbon neutrality by mid-21st century.
The technical part of the current paper tests the hypothesis that montmorillonite promotes the formation of nano-sized hydrochar particles from glucose obtained by hydrothermal carbonization and that multiple mechanisms are involved in the adsorption of Cr to Mnt-hydrochar nanocomposites (CMnt). Unlike toxic synthetic surfactants, glucose is a benign, eco-friendly, and natural compound.
Materials and Methods
Materials
The raw montmorillonite (Mnt), provided by Zhejiang Fenghong New Material Co., Ltd. (Anji, Zhengjiang, China), was ground and passed through a 200-mesh sieve (75 μm) before use. All reagents, including glucose and potassium dichromate (K2Cr2O7), were of analytical grade, purchased from Sinopharm Chemical Reagent Co., Ltd. (Shanghai, China). Ultrapure Milli-Q water was used throughout.
Preparation of Hydrochar-montmorillonite Nanocomposites (CMnt)
In a typical procedure, 1 g of montmorillonite was dispersed in 75 mL of glucose solution with magnetic stirring for 2 h at room temperature. Aliquots of the homogeneous dispersion were transferred into Teflon-lined stainless-steel autoclaves (100 mL), sealed, and placed in an oven. Previous studies indicated that a hydrothermal time of 12 h was critical for carbon-nanoparticle formation, while an increase in reaction temperature to 200°C increased the rate of carbonization (Wu et al., Reference Wu, Zhou, Tong, Yu and Wang2014; Liu et al., Reference Liu, Yang, Xu, Chen, Yao, Zuo, Kong and Fu2015). On that basis, a hydrothermal time of 16 h and a temperature of 200°C were selected. The effect of montmorillonite on the formation of hydrochar was assessed using the following weight ratios of glucose/montmorillonite: 1.35, 2.70, 4.05, 5.40, 6.75, and 8.10, corresponding to glucose concentrations of 0.1, 0.2, 0.3, 0.4, 0.5, and 0.6 mol L−1, respectively. The resultant black composites were named by adding the molar glucose concentration at the front of the rest of the name; i.e. 0.1CMnt, 0.2CMnt, 0.3CMnt, 0.4CMnt, 0.5CMnt, and 0.6CMnt. For comparison, a hydrochar (denoted as 0.5C) was prepared using a glucose solution (0.5 mol L−1) under the same conditions but in the absence of montmorillonite. The CMnt samples were separated by centrifugation, washed, and dried at 60°C for 12 h.
Materials Characterization
The point of zero charge (pHPZC), determined by the pH drift method (Kosmulski, Reference Kosmulski2016), was used to assess the ionization of functional groups in CMnt and their interaction with metal species in solution (Fiol & Villaescusa, Reference Fiol and Villaescusa2009). Elemental analysis was conducted using an Elementar Vario Micro cube analyzer (Hesse, Germany). FTIR spectra (from 4000 to 600 cm−1) were obtained using a Thermo Scientific Nicolet iS5 spectrometer (Waltham, Massachusetts, USA) with a resolution of 4 cm−1. N2adsorption-desorption isotherms at 77 K were obtained on a Micromeritics ASAP2020M+C surface area analyzer (Norcross, Georgia, USA). The specific surface area of the composites was obtained by applying the BET equation, while the pore-size distribution was evaluated using the DFT method. Thermogravimetric (TG) analysis was conducted in an N2 atmosphere from 25 to 850°C at a heating rate of 5°C min−1 using a Mettler 5MP/PF7548/MET/400W thermal analyzer (Zurich, Switzerland). Scanning electron microscopy (SEM) was performed with a Hitachi S-4800 instrument (Tokyo, Japan) equipped with an HORIBA EX-350 energy dispersive X-ray microanalyzer (EDX) (Kyoto, Japan).
Adsorption of Cr(VI)
The adsorption of Cr(VI) by CMnt was determined in duplicate using a batch technique. Briefly, 25 mg of CMnt was placed in a 50 mL polypropylene centrifuge tube containing 20 mL of K2Cr2O7 aqueous solutions with various initial concentrations (10.4–468 mg Cr L−1), adjusted to pH 2 and pH 8. After shaking at 25°C for 48 h, the tubes were centrifuged and the suspensions filtered. The Cr(VI) concentration in the filtrate was determined by the diphenylcarbazide method using a Thermo Scientific GENESYS 10S UV-Vis spectrophotometer (Waltham, Massachusetts, USA) at 540 nm. The pellets were then freeze dried for further analysis.
The Freundlich isotherm model (Eq. 1) and Langmuir isotherm model (Eq. 2) were used to simulate Cr(VI) adsorption to CMnt.

where kF (mg1–n g–1 L–n ) is the Freundlich constant related to adsorption capacity and n is an empirical parameter signifying the degree of heterogeneity of binding sites.

where Q max (mg g−1) denotes the maximum adsorption capacity, Q eq (mg g −1 ) is Cr adsorption at equilibrium, C eq (mg L −1) is Cr concentration at equilibrium, and the parameter kL (L mg−1) is the Langmuir constant related to the binding affinity and free energy of adsorption.
X-ray Photoelectron Spectroscopy (XPS) Analysis
The surface elemental composition and chemical oxidation state of CMnt were measured by XPS (Thermo Fisher ESCALAB 250 xi, Waltham, Massachusetts, USA), using a monochromatic AlKα X-ray source (hν = 1486.6 eV). The XPS spectra were recorded with a pass energy of 1350 eV (step = 1 eV) for survey scans and 25.00 eV (step = 0.05 eV) for individual high-resolution spectra of O (1s) and Cr (2p).
XPSPEAK software (Version 4.1) and XPS spectral fitting were used to identify and quantify the retention of Cr(VI) and Cr(III) by CMnt. The C(1s) peak (284.8 eV) was used as an internal standard to calibrate the energy scale, while the peaks were deconvoluted using Gaussian-Lorentzian peak shapes (50%) and a Shirley background (Aronniemi et al., Reference Aronniemi, Sainio and Lahtinen2005). Spectral fittings were performed using a full-width-at-half-maximum(FWHM) of 1.5, with a chi-square value of <1 indicating a good fit.
Results and Discussion
Montmorillonite Promotes Hydrochar Formation
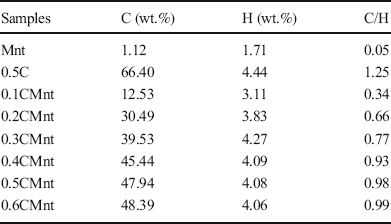
The elemental compositions (C and H) of Mnt, hydrochar, and CMnt are presented in Table 1. The Mnt sample contained 1.12 wt.% carbon (probably from associated carbonates) and 1.71 wt.% hydrogen. The carbon content of CMnt increased with an increase in initial glucose concentration, particularly from 0.1 to 0.5 mol L−1. At the same time, the C/H atomic ratio increased, suggesting enhanced condensation of the hydrochars. Thus, a glucose concentration of 0.5 mol L−1, giving a weight ratio of glucose to Mnt of 6.75:1, was apparently crucial. Above this concentration, the carbonization reaction slowed down because the clay surface was close to being fully covered by hydrochar. By comparison, a carbon content of 35.22 wt.% was reported by Wang et al. (Reference Wang, Wang, Sun, Sun and Zheng2017) for a glucose-illite composite formed by hydrothermal carbonization, while carbon contents of 24.67 and 31.63 wt.% for a cellulose-sepiolite composite were measured by Wu et al. (Reference Wu, Zhang, Liu, Zhang and Chung2017). The relatively large carbon contents of CMnt, measured in the current study, implied that Mnt is a superior template for hydrochar formation.
C and H contents and their atomic ratios of parent Mnt, 0.5C, and CMnt prepared at various concentrations of glucose

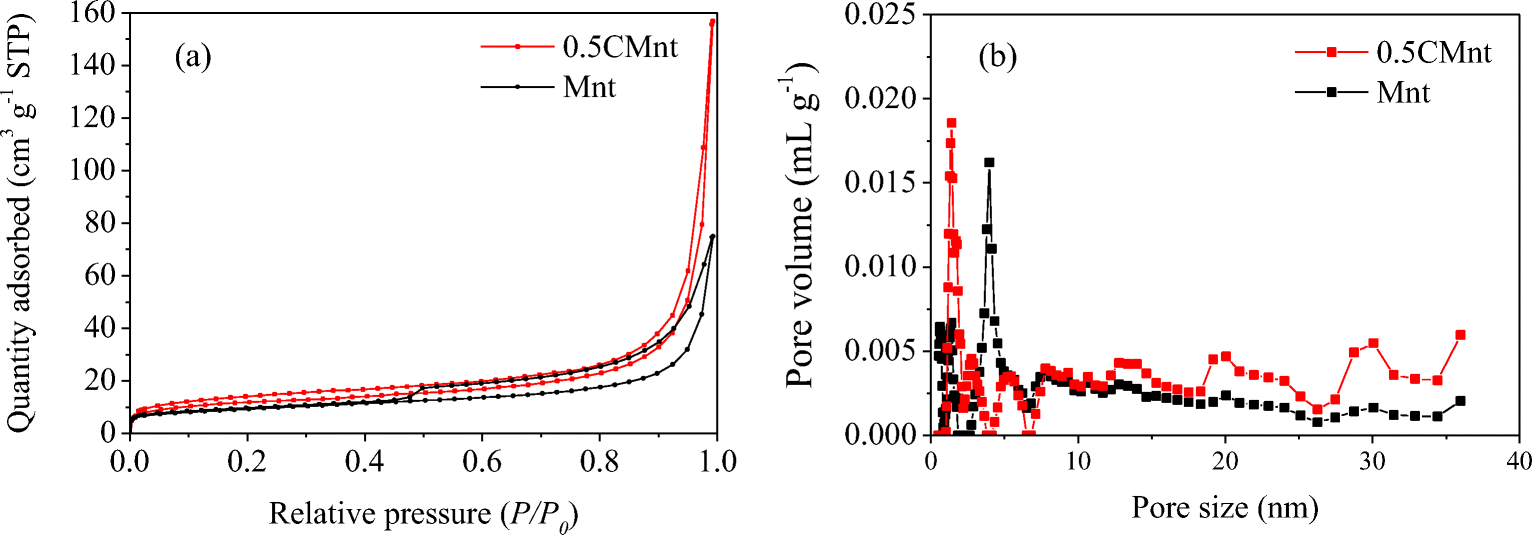
A weight ratio of glucose to montmorillonite of 6.75:1 was chosen to assess the positive role of montmorillonite in hydrochar formation. The N2adsorption-desorption isotherms of both 0.5CMnt and Mnt (Fig. 1a) were of type IV with an H3-type hysteresis loop. This observation indicates that the samples consisted of superposed platy particles with slit-shaped micropores and mesopores (Sarkar et al., Reference Sarkar, Liu, McClure, Sundaramurthy, Srinivasan and Naidu2015; Tong et al., Reference Tong, Wu, Adebajo, Jin, Yu, Ji and Zhou2018). However, the adsorption and desorption values for 0.5CMnt, at the same relative pressure, were greater than those for pristine Mnt because the composite material was more porous. Indeed, the pores of 0.5CMnt ranged from 0.5 to 30 nm, with a peak near 1.4 nm, whereas the average pore size of Mnt was 4.0 nm (Fig. 1b).
N2adsorption-desorption isotherms of montmorillonite (Mnt) and its complex with hydrochar (0.5CMnt)

Also noteworthy is that the specific surface area of 36.0 m2 g−1 for 0.5CMnt was appreciably larger than that measured for Mnt (28.0 m2 g−1). On the other hand, previous studies indicated that the pore volume and specific surface area of carbon-clay nanocomposites were smaller than the values measured for the corresponding pristine clay minerals (Liu et al., Reference Liu, Yang, Xu, Chen, Yao, Zuo, Kong and Fu2015; Wu et al., Reference Wu, Zhang, Liu, Zhang and Chung2017; Zhang et al., Reference Zhang, Liu and Liu2018). This observation was ascribed to the blocking of micropores by amorphous carbon formed during hydrothermal carbonization.
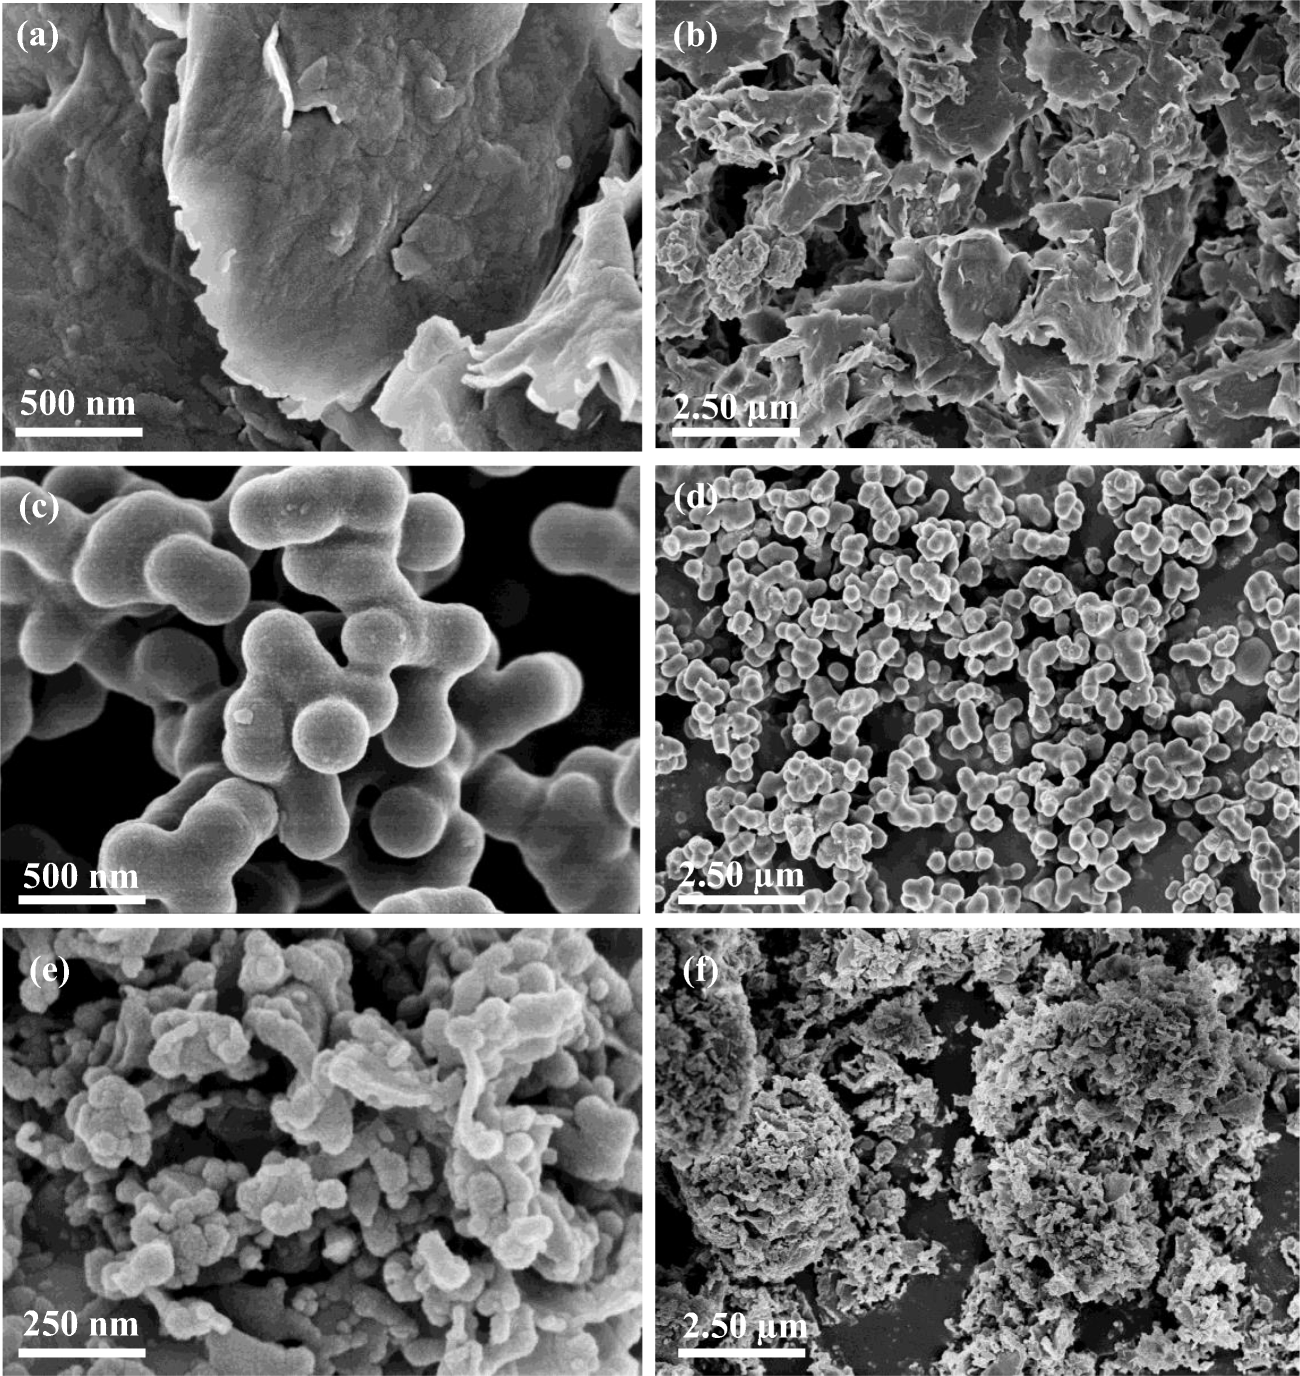
Scanning electron microscopy images of CMnt and its components (Fig. 2) show that the nanocomposite has a more open microporous structure than the original montmorillonite. Carbon-rich particles with a diameter of ~80 nm cover much of the Mnt surface (Fig. 2e, f).
SEM images of a, b Mnt; c, d 0.5C; and e, f 0.5CMnt

As reported by Wei et al. (Reference Wei, Tu, Yuan, Bi, Xiao, Theng, Wang and Ok2019), Mnt particles tend to exfoliate during the hydrothermal process. The resultant increase in surface area is conducive to carbon deposition on external clay-particle surfaces as well as within micropores. Figure 2c, d shows that the 0.5C material consists of nanosize (~250 nm) spherical particles that are appreciably larger than their counterparts in CMnt. In accord with Wu et al. (Reference Wu, Zhou, Tong, Yu and Wang2014, Reference Wu, Zhang, Liu, Zhang and Chung2017), the presence of clay minerals is conducive to reducing the size of carbon nanoparticles formed during the hydrothermal process.
Mechanisms Involved in the Formation of Hydrochar-montmorillonite Nanocomposites
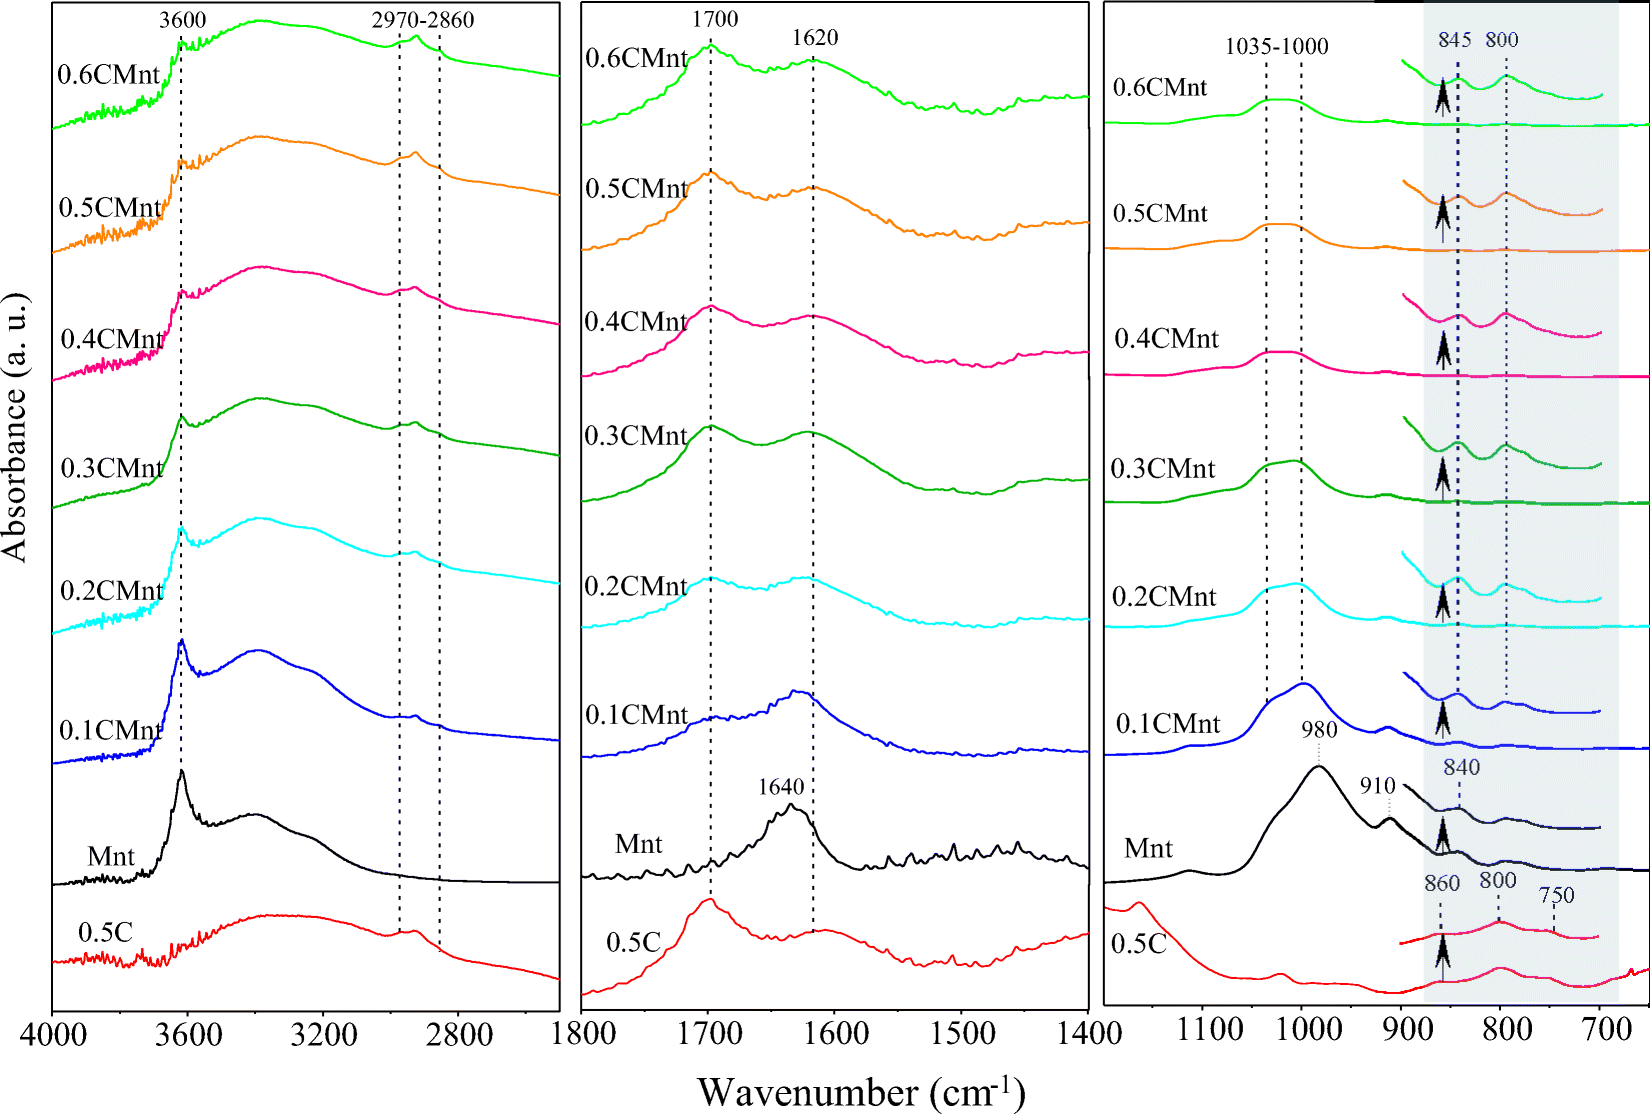
The FTIR spectra of Mnt, 0.5C, and CMnt, formed at six different glucose concentrations (Fig. 3), revealed the structural evolution of glucose-derived carbon on the Mnt surface. The peak at 3600 cm−1 in the spectrum of Mnt is assigned to Al–O–H vibration, while the peaks at 1035–1010 and 980 cm−1 are due to Si–O stretching vibrations (Tong et al., Reference Tong, Wu, Adebajo, Jin, Yu, Ji and Zhou2018). Following Yang et al. (Reference Yang, Jiang, Yang, Xu, Miao and Li2017), the peaks at 3400 and 1640 cm−1 are attributed to OH-bending of water coordinated to exchangeable cations, while the shoulder at 910 cm−1 is due to hydroxyl vibration of Mnt. The various peaks for Mnt are still discernible in the spectrum of CMnt, but their intensities are significantly reduced. The FTIR spectra of both 0.5C and CMnt show peaks due to CH3 and CH2 bending (2790 and 2860 cm−1), carbonyl C=O in quinone, ester, or carboxyl (1700 cm−1), C–O stretching in hydroxyl, ester, or ether (1460–1000 cm−1), and aromatic C–Hout-of-plane bending (900–750 cm−1) (Wei et al., Reference Wei, Tu, Yuan, Zhou, Wang and Lu2020). The intensity of these peaks increases with the concentration of glucose added, reflecting the enhanced formation of hydrochar-montmorillonite nanocomposites.
FTIR spectra of the 0.5C, parent Mnt, and CMnt prepared at various concentrations of glucose

CMnt may be regarded as a chemical composite rather than a physical mixture of hydrochar and Mnt. Thus, the OH peaks of Mnt near 3400 cm−1 weakened progressively following the formation of CMnt in the increased presence of glucose. Moreover, a new peak appeared near 1000 cm−1 due to Si–O stretching, indicating that the glucose-derived char was chemically bound to Mnt.
The presence of Mnt also induced changes in the chemical properties of the hydrochar. First, the concentration of poorly substituted aromatic structures increased. Thus, three out-of-planeC–H deformation peaks (900–700 cm−1) appeared in the FTIR spectrum of 0.5C. These peaks may be assigned to aromatic structures with isolated hydrogen (1H, 860 cm−1), two adjacent hydrogens per ring (2H, 800 cm−1), and four adjacent aromatic hydrogens (4H, 750 cm−1) (Yen et al., Reference Yen, Wu and Chilingar1984). The peak at 750 cm−1 was absent from the spectra of CMnt. On the other hand, the peak at 800 cm−1 in the spectra of CMnt increased in intensity with an increase in initial glucose concentration. Aromatic substitution decreases as the number of adjacent hydrogens per aromatic ring increases (Wu et al., Reference Wu, Zhou, Tong, Yu and Wang2014). Thus, the observed spectral changes indicate that Mnt promoted the formation of hydrochar with aromatic structures of low substitution. Results from the current investigation further suggest that aromatic substitution in the hydrochar structure decreases with an increase in initial glucose concentration.
Removal of Cr(VI) by Hydrochar-montmorillonite Nanocomposites
By influencing the speciation of metal ions in solution, and the ionization of functional groups on a sorbent (Kosmulski, Reference Kosmulski2016), pH is a controlling factor in heavy-metal sorption. Cr(VI) occurs as an anion over a wide range of pH, notably as CrO4 2− at pH ≥ 6.0 and as HCrO4 − at pH < 6.0 (Li et al., Reference Li, Shen, Huang, Li and Ye2014). All the CMnt had low pHPZC values (3.0−5.5). Specifically, the pHPZC value of 0.5CMnt was 3.07, indicating that at pH 2 its surface is positively charged, capable of sorbing chromate(VI) anions. On the other hand, at pH 8 its surface is negatively charged, and hence would attract Cr(III) cations. Preliminary experiments indicated that CMnt could sorb more Cr(VI) at pH 2 than at pH 8 (Wei et al., Reference Wei, Tu, Yuan, Bi, Xiao, Theng, Wang and Ok2019).
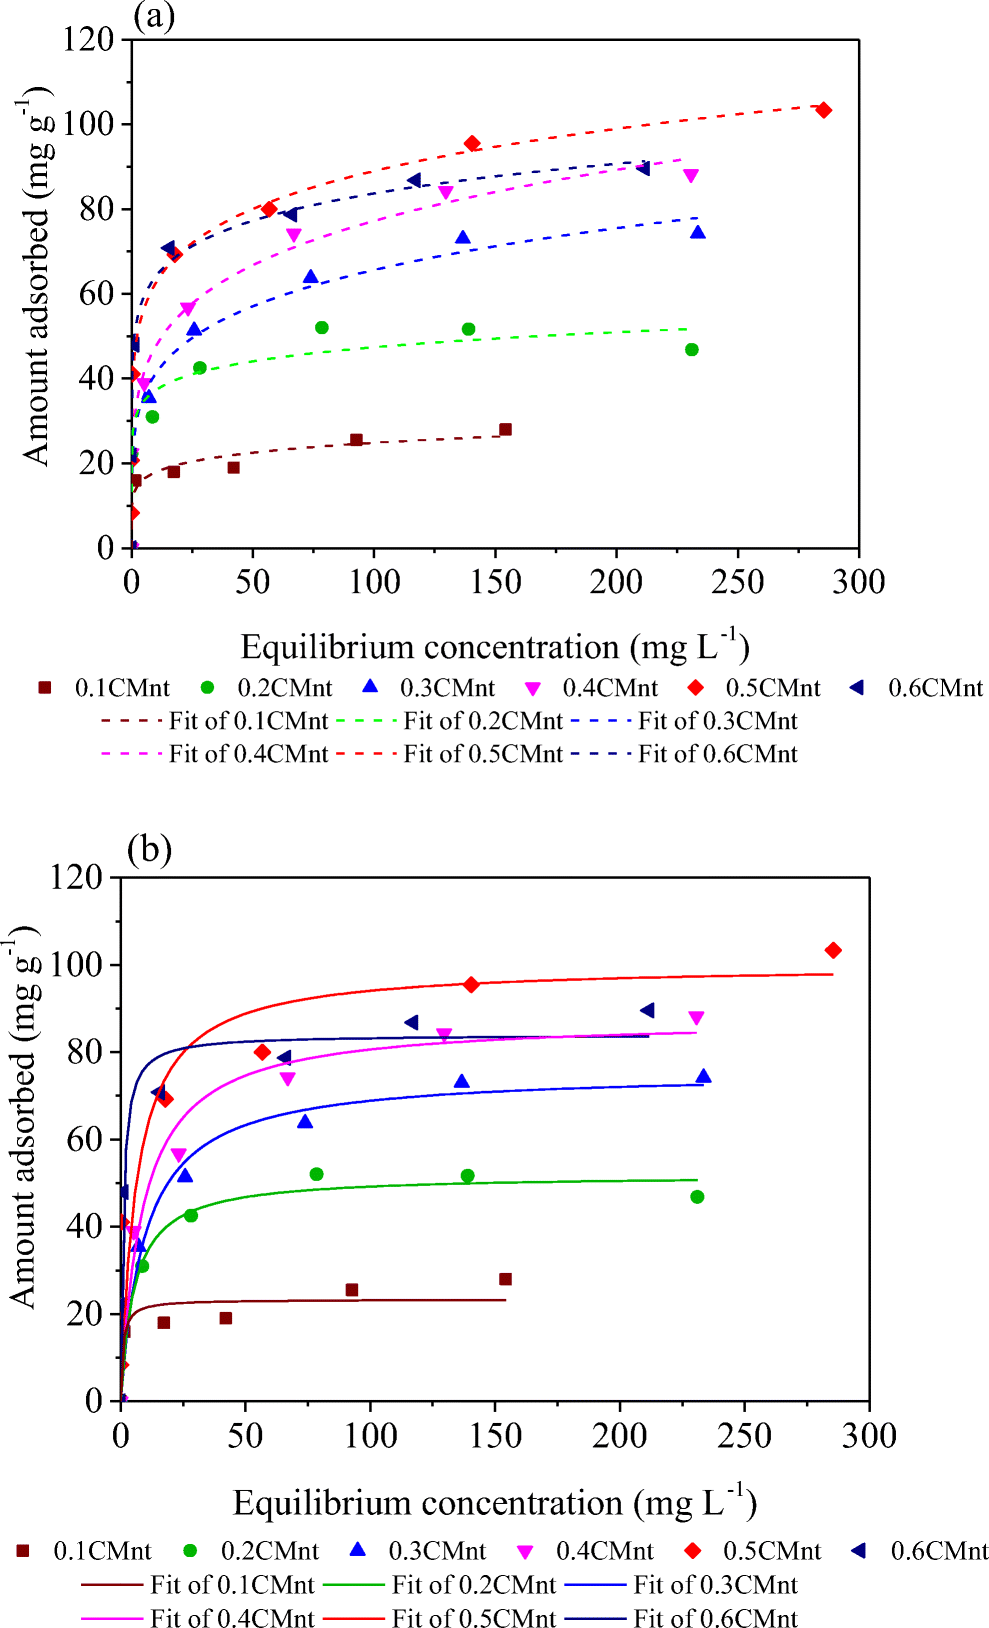
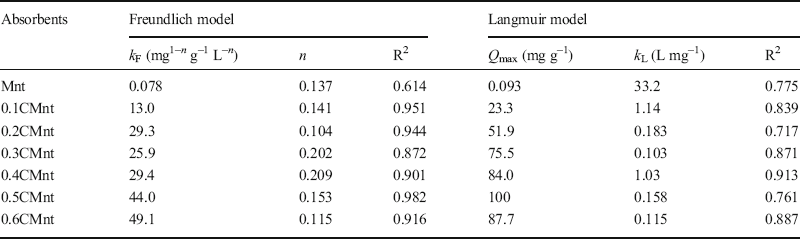
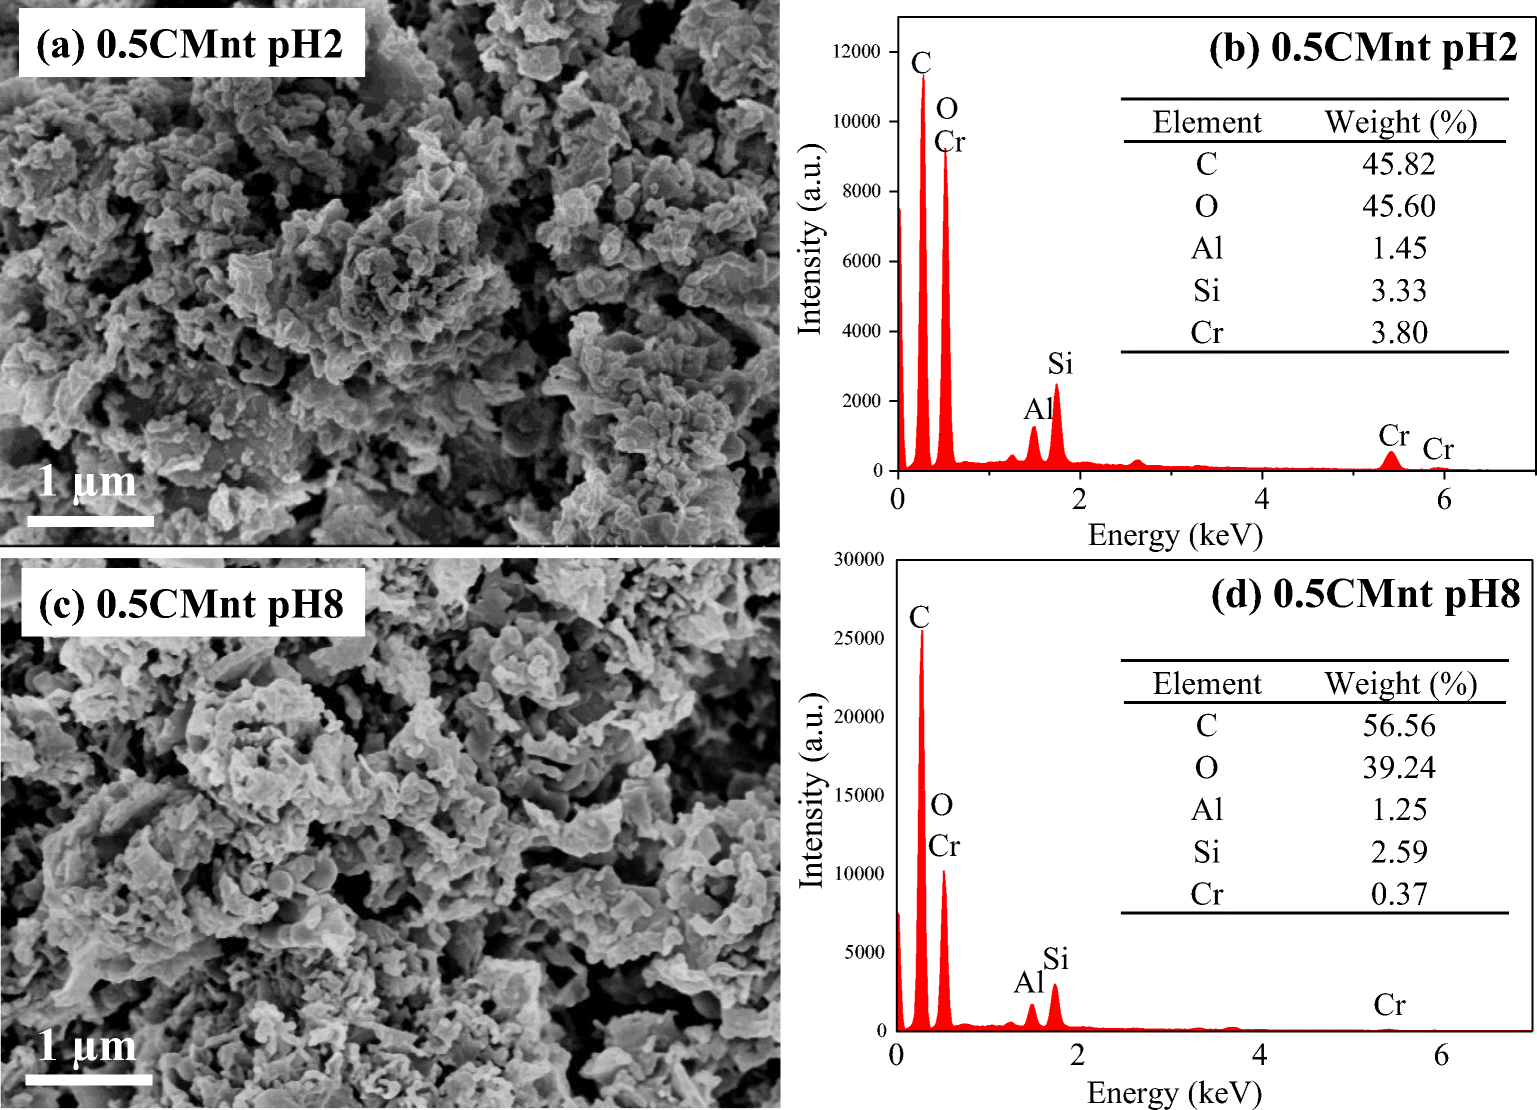
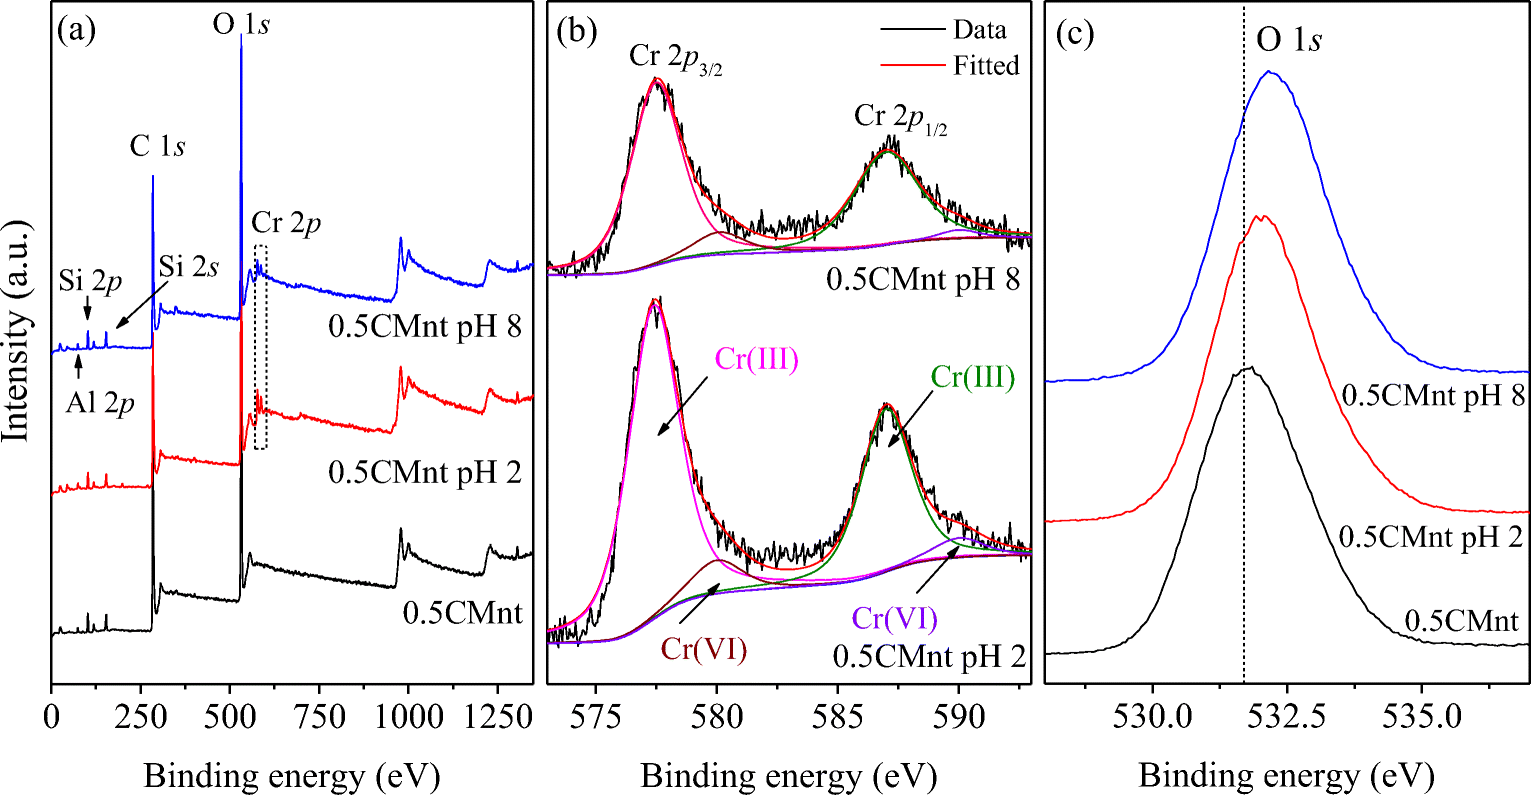
The Cr adsorption isotherm at pH 2 was fitted into the Freundlich and Langmuir models (Fig. 4), giving the fitting parameters as listed in Table 2. The Freundlich model (R2 = 0.872−0.982) gave a better fit than the Langmuir model (R2 = 0.717−0.913), suggesting that Cr was sorbed to heterogeneous sites in CMnt. Among the CMnt prepared with various glucose/Mnt ratios, the 0.5CMnt had the highest Cr(VI) sorption capacity (up to 100 mg g−1). The lower Cr(VI) sorption capacity of the 0.6CMnt was probably related to the formation of large carbon spheres at high glucose concentrations. In line with the adsorption results, SEM-EDX showed that more Cr was adsorbed by 0.5CMnt at pH 2 than at pH 8 (Fig. 5). Similarly, the wide-scan XPS spectra of CMnt, before and after loading with Cr (Fig. 6a), showed that the distinct peaks of Cr (2p) for adsorbed Cr were more prominent at pH 2 than at pH 8. These results indicated that CMnt obtained at a high glucose/Mnt weight ratio had a large capacity for sorbing Cr(VI). At low pH conditions, especially at pH < pHPZC, CMnt was very effective at removing Cr(VI).
a Freundlich and b Langmuir isotherms as models for Cr(VI) adsorption onto CMnt at pH 2

Freundlich and Langmuir isotherm parameters for Cr(VI) adsorption at pH 2

SEM images and EDX data of 0.5CMnt after Cr(VI) adsorption at a, b pH 2 and c, d pH 8

XPS spectra of 0.5CMnt before and after Cr(VI) adsorption at pH 2 and pH 8. a Survey spectra; b high resolution Cr 2p spectra; and c high resolution O 1s spectra

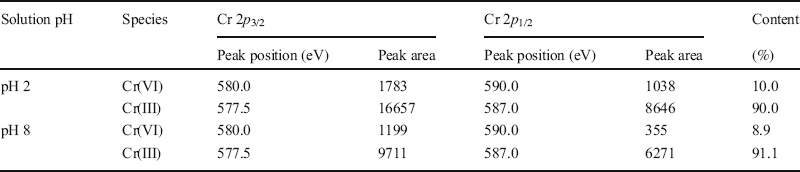
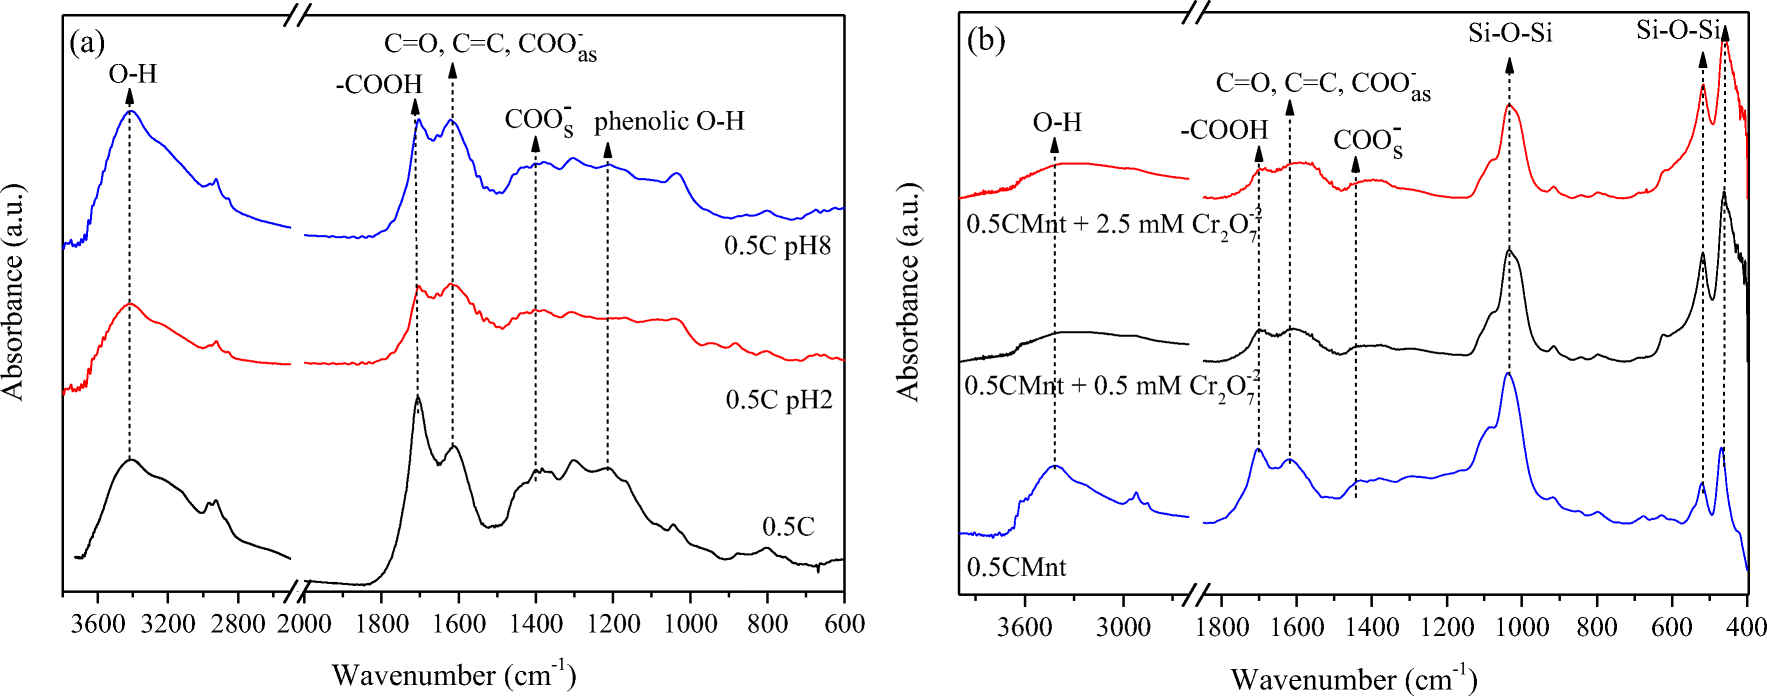
The XPS spectra provided insight into the valency of Cr species on the CMnt surface. Deconvolution of the Cr(III) and Cr(VI) 2p 3/2 and 2p 1/2 peaks in the Cr (2p) spectra (Fig. 6b, Table 3) showed the co-existence of Cr(III) and Cr(VI) on the CMnt surface with trivalent chromium being predominant, due to reduction of adsorbed Cr(VI) to Cr(III). The FTIR spectrum of 0.5C showed that the peaks at 1210 cm−1 and 1700 cm−1 weakened after Cr adsorption, indicating that phenolic O−H and –COOH groups were consumed during the reduction of Cr(VI) (Fig. 7a). Under acidic conditions Cr(VI) anions appeared to first adsorb to the positively charged CMnt surface, and then were reduced by electron-donating constituents, notably phenolic and carboxylic groups of the hydrochar component in CMnt (Jiang et al., Reference Jiang, Gong, Gao, Sun, Liu, Oturan and Oturan2019; Wei et al., Reference Wei, Tu, Yuan, Bi, Xiao, Theng, Wang and Ok2019). Fe2+ released from the Mnt framework could also take part in the reduction process (Joe-Wong et al., Reference Joe-Wong, Brown and Maher2017). Because the CMnt surface was negatively charged under alkaline conditions, the Cr(VI) anions might be reduced indirectly by the reductive components (Wei et al., Reference Wei, Tu, Yuan, Bi, Xiao, Theng, Wang and Ok2019).
Cr 2p peaks for 0.5CMnt before and after Cr(VI) adsorption at pH 2 and pH 8

FTIR spectra of a 0.5C before and after Cr(VI) adsorption at pH 2 and pH 8, and b 0.5CMnt after Cr(VI) adsorption at various Cr2O7 2– concentrations

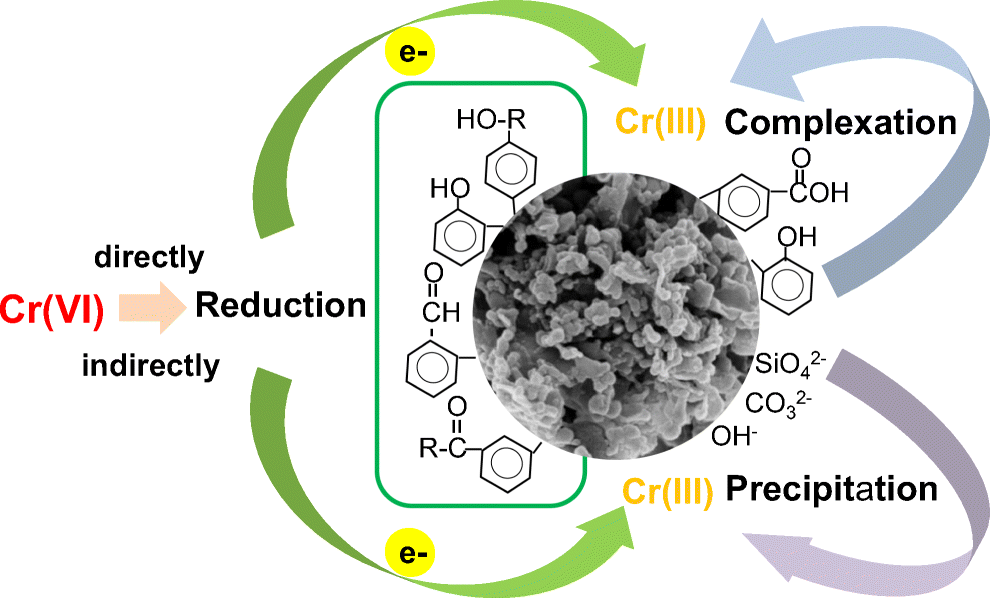
Moreover, the O (1s) binding energies for Cr-loaded CMnt were greater than the values measured for CMnt (Fig. 6c). This observation was consistent with the formation of a coordination complex between Cr(III) and oxygen-containing functional groups (e.g. carboxyls) in CMnt (Chen et al., Reference Chen, An, Sun, Gao and Qian2018; Wei et al., Reference Wei, Tu, Yuan, Bi, Xiao, Theng, Wang and Ok2019). Moreover, solution pH changed from 2.0 at the start of the adsorption experiment to 3.4−3.7 at the end, and from 8.0 to 6.1−6.8 as adsorption progressed. As a result, the surface charge of CMnt became increasingly negative, and hence capable of binding Cr(III) by electrostatic attraction. Cr(III) could also precipitate out as Cr(OH)3 when pH conditions changed from slightly acidic to alkaline. Following Wei et al. (Reference Wei, Tu, Yuan, Bi, Xiao, Theng, Wang and Ok2019), the adsorption of Cr by CMnt may be ascribed to the synergistic operation of a redox reaction, complexation, electrostatic attraction, and precipitation.
Conclusions
Research on clay–organic nanocomposites is evolving toward producing low-cost and environmentally benign materials with specific and desirable properties. The synthesis of hydrochar-montmorillonite nanocomposites (CMnt) by hydrothermal carbonization of glucose in the presence of montmorillonite (Mnt) is an example of obtaining fit-for-purpose materials using biomass from photosynthesis instead of synthetic surfactants or humic substances. Mnt promotes the formation of nanosize (~80 nm) hydrochars with aromatic structures with low hydrogen substitution and high stability. FTIR spectroscopy indicates the formation of a chemical bond between Mnt and hydrochar. At pH 2, CMnt loaded with various amounts of glucose have a high affinity for toxic Cr(VI), showing a maximum adsorption capacity of 23.3–100 mg/g. XPS spectroscopy shows the predominant presence (> 90%) of less toxic Cr(III) species over highly toxic Cr(VI) on CMnt surfaces. Multiple mechanisms are involved in the removal of Cr by CMnt from aqueous solutions (Fig. 8), indicating the versatility of CMnt as a sorbent of environmental contaminants.
Likely mechanisms of Cr(VI) adsorption on to CMnt

Acknowledgments
The Science and Technology Agency of Guangdong Province, China (Grant No. 2020B121201014), Guangdong Technology and Equipment Research Centre for Soil and Water Pollution Control, and the National Natural Science Foundation of China (Grant No. 41977139) are acknowledged for financial support.
Funding
Funding sources are as stated in the Acknowledgments.
Declarations
Conflict of Interest
The authors declare that they have no conflict of interest.