


In 1668, the court of Shah Safi II (r. 1666–94) convened a gathering of the empire's elites in Isfahan as a series of crises spread through the Safavid Empire (1501–1722). Since his coronation two years earlier, severe problems had arisen that began to undermine the stability of the empire. Drought, famine, and plague swept through the countryside and affected major towns. Bands of Uzbek and Afghan tribal groups made repeated incursions along the empire's eastern frontiers. At the same time, the shah himself was suffering from a combination of maladies, which the traveler Engelbert Kaempfer later identified as a combination of “galloping consumption” and venereal disease marked by gruesome sores.Footnote 1 Placing blame on the astrologers for selecting an inauspicious alignment of the stars for Shah Safi's first coronation, the distressed courtiers set a new, more suitable hour for a second follow-up ceremony and admonished them for their carelessness (Fig. 1). According to the Safavid chronicler Mir ʿAbd al-Husain Khatunabadi, who was present at the ceremony, the chief cleric Muhammad Baqir al-Sabzavari delivered a sermon before the empire's chief political and spiritual leaders, then moved to a larger gathering in the presence of the general public.Footnote 2 To the surprise of those present, the shah's royal title was changed and he was thereafter known as Shah Sulayman until his death twenty-six years later in 1694.Footnote 3
The second coronation of Shah Safi II as Shah Sulayman (1668). Source: John Chardin, Voyages du Chevalier Chardin en Perse et Autres Lieux de l'Orient (Paris: LeNormant, 1811).

The imperial reset did little to reverse the course of the Safavids’ fortunes. Historians often point to the reign of Safi II, or Sulayman, as the beginning of the end of the Safavid Empire, which until then was among the most powerful states in the early modern world. H. R. Roemer, in the Cambridge History of Iran, introduces the reign of Safi II as the critical moment when “Persia came once and for all to the end of a long period of peace and prosperity.”Footnote 4 It is indeed striking that by 1722, less than a half century after the second coronation of Sulayman, the capital of Isfahan fell to a small band of Ghilzai Afghans who had marched nearly unimpeded through the Iranian plateau. This marked a strange and sudden end to one of the early modern world's great powers. Over the longer term, this imperial collapse marked a turning point from Iran as a dominant force in Eurasian political and commercial affairs to a region divided into competing empires in the mid- to late 18th century, with a declining population facing significant economic and military challenges. In the immediate aftermath of the fall of Isfahan came more than seven decades of conflict between rival Afghan, Kurdish, Afsharid, Zand, and Qajar armies. This ended only after the brutal conquests of Agha Muhammad Khan between 1789 and 1797, which laid waste to entire cities while establishing the territorial basis of the Qajar dynasty (1795–1925).Footnote 5 It was truly an ominous transition, marking a reversal of Iran's place in the world by the end of the 18th century.
The search for answers about the fall of the Safavid Empire have coalesced into a story of “decline,” roughly parallel to the more well-known and well-critiqued Ottoman decline narrative, except more rapid and severe. The usual explanations hinge on the drinking habits of the shahs, their inattention to matters of state, and the competition of “modern” European states. This is essentially the story told in Roger Savory's 1980 work Iran under the Safavids, which stood as something of a master narrative for decades.Footnote 6 Sidestepping the touchy “decline” word, A. J. Newman's reassessment of Safavid history in 2006 presents the fall of the empire as almost inexplicable. He notes no major challenges to Safavid rule, and indeed details a long afterlife to Safavid legitimacy. The fall of the empire, in his view, was the result of a chance military conflict handled poorly by the central government, reflecting a structural weakness in the state. In other words, the Safavid Empire experienced a fall without a decline.Footnote 7 More recent works have emphasized the structural weaknesses of the empire. Most notably, Rudi Matthee's Persia in Crisis: Safavid Decline and the Fall of Isfahan emphasizes the interrelated economic decline of the empire and the unraveling of its delicate alliances with a geographically and socially fragmented populace.Footnote 8
In the background of these narratives of decline and fall are murmurs of a series of environmental crises plaguing the Safavid Empire, continuing through the 18th century. The presence of drought, crop failures, famines, and plagues in late Safavid history are mentioned in the works of both Matthee and Newman.Footnote 9 Textual evidence is unfortunately slim. There are no extant archives (these supposedly destroyed by the aforementioned Afghan raiders in the 1720s). The majority of the surviving texts from this period are either chronicle works fixed on affairs at the center or religious and philosophical works, noteworthy for elaborating important key concepts of the Safavids’ new state religion of Twelver Shiʿism. In the absence of detailed source materials, historians have been rightly hesitant to make claims about social and economic conditions in the country and tie the scattered references too neatly into a general narrative tied to the fortunes of the empire.
Given these limitations, relatively little attention is given to the material backdrop to 17th- and 18th-century Iranian history. This has amplified the tendency in the humanities to place historical processes on an ethereal plane outside of the natural environments that shape, and are shaped by, human affairs. As a leading voice in the field of environmental history, J. R. McNeill, argues, it is important to recognize “the evolution of both human impact on the rest of nature and nature's influence upon human affairs; each is always in flux and always affecting the other.”Footnote 10 This material context is often of critical importance. In the case of late Safavid history in particular it can lead to a more compelling explanation of the empire's supposed decline, setting it in the context of a dramatic moment of global climatic change that undermined the structures of human societies worldwide. A broader view of developments throughout Eurasia, during what Eric Hobsbawm has termed the “General Crisis” of the 17th century, brings environmental crises to the fore as a common factor among a remarkable collection of case studies of social unrest around the world throughout the 17th and 18th centuries.Footnote 11 This corresponds to a prolonged period of global cooling and irregular weather patterns known as the “Little Ice Age,” running from roughly the 14th to the early 19th century and peaking during the worst of the social unrest described by Eric Hobsbawm.Footnote 12
It is not as simple as empires rotting away in bad weather. Reducing complex human processes to a single cause is always problematic. Although the materiality of social processes should not be ignored, McNeill reminds us that the relationship between humanity and the rest of nature is reciprocal.Footnote 13 We can think of this as a feedback loop, in which human history is affected by geographies and environments that they, in turn, reshape to their own purposes, creating context for human activities that continue to act on and reshape them. From the wide variety of case studies, it is clear that the common challenge of climatic change was met with an equally wide variety of responses, and the particulars of context and agency are critical factors.
This article, coauthored by an environmental historian and a climate scientist, will argue that the fall of the Safavid Empire should be understood as the collapse of the Safavid's imperial ecology: a set of networks and normative systems that patterned human interaction with the rest of the environment in which they operated.Footnote 14 Networks of administrators, landowners, and locally rooted elites drew together systems of interaction between human beings and their natural environments, from managing water to maintaining land use regimes, down to the plant cultivation, pastoralism, production, exchange, and consumption that made up regional ecologies. A close reading of contemporary sources suggests that the fall of the Safavid Empire was not merely a political or military problem, but a wider environmental crisis that undermined the imperial ecology. A climate reconstruction using dendrochronological (tree-ring) evidence demonstrates that the Iranian plateau experienced a significant climatic change in the late 17th and early 18th centuries, marked by cooler and dryer weather that is reflected in the growth pattern of juniper trees in modern Turkey and Syria, which correlate historically to climatic patterns on the eastern Iranian plateau. This data is analyzed alongside a reassessment of written sources from late Safavid historians, chroniclers, and travelers, who remark only sporadically on affairs outside of court, but who nonetheless found it necessary to mention the drought, famine, and plague sweeping through the country from the 1660s through the end of the 17th century. From other cases studies, we also know that a series of environmental challenges affected nearly the whole of Eurasia from the 1660s onward. As there is a growing body of scholarship on the global nature of the ecological crisis of the 17th century, we are above all arguing for the connectedness of Safavid history to broader patterns in world history, experienced locally as a collapse of Iran's early modern imperial ecology.Footnote 15
As Sam White argues in his study of 17th-century Ottoman environmental history, revisiting this question of decline with attention to its wider material context provides a more compelling method for pinning down exactly what declined, and why.Footnote 16 One of the unique features of the Safavid situation is that although local ecologies were quite strong and resilient, ecologies of empire on the Iranian plateau and Caspian littoral were typically much less so. The ability to systematically collect and distribute resources, maintain communication and transportation routes, and assert the force of central power were persistent challenges to statecraft. Drought, famine, disease, and sporadic warfare on the frontiers built upon each other to create a crisis that undermined the stability of these systems. The inability of the Safavid state to manage the symptoms of the climate crisis of the 17th century precipitated its political and economic collapse.
The disparate attempts to characterize and explain the long decline of the Safavid state should be incorporated into the growing scholarship on the global climatic crisis of the late 17th century. Climate change put stress on the ecology of the Iranian plateau and connected regions, and the inability of the Safavids to effectively reshape and reorient their systems in light of this crisis was the ultimate force behind the empire's slow motion collapse from the 1660s to 1720s, and the prolonged crisis that extended through the end of the 18th century.
The Ecology of Empire in Safavid Iran
The Safavid Empire functioned as an ecological zone, albeit one that was highly porous and decentralized. The Safavids governed a region that overlaps with much of the modern nation–state of Iran. Its shifting frontiers at times included parts of the Caucasus and Mesopotamia to the north and west. The eastern reach of the empire fluctuated in the frontier zones of eastern Khurasan, with interactions with the Uzbeks and other local rulers in what is now termed Central Asia, and extended south to the Mughal frontiers and mountainous regions bordering the Indian subcontinent. There are some important geographical distinctions between the Safavid Empire and the Iran of today. The population of the empire was but a small fraction of its current levels; at its height, it is likely that no more than ten million people were scattered over the empire's one million or so square miles.Footnote 17 Much of that population, perhaps upward of 80 percent, was engaged in small-scale agriculture. The Iranian plateau was firmly in arid and semiarid zones, with most areas in the interior receiving between 100 and 300 mm of precipitation per year. Most farming communities depended heavily on artificial irrigation techniques. Iran's famous qanat systems, for instance, mined water from the water table in mountainous zones to irrigate surrounding agricultural lowlands.Footnote 18 Pastoral nomadic groups exploited the marginal lands not suited for agriculture, or engaged in seasonal farming. The extreme northern and western frontiers along the Zagros and Alborz mountains had relatively more annual rainfall. The most notable exception was along the Caspian littoral, which had heavily forested areas and heavy rainfall.
These fragmented lands and communities were connected through networks of social and political power of various types. Kinship was one of the most prominent organizational features of Safavid society, often connecting peoples across the spectrum of settled and nomadic.Footnote 19 The state administered most provincial territories through intermediaries from prominent elite family networks in urban centers, and drew on pastoral nomadic tribal groups as a body of irregular troops. The Qizilbash confederation was the most famous of these, serving as a military arm of the Safavid government. Urban elites also were part of the Safavid power structure. Families of landowners, administrators, religious scholars, and tribal elites residing in larger towns dominated vast areas of the hinterland, and governed with little practical interference by central government.Footnote 20 Historians of the Safavid Empire have highlighted the rivalry between the Turk and Tajik, tribal and bureaucratic, elements of the central power structure. It is important to remember that the reach of central control was never very great. The Safavids directly governed their capital city (Tabriz, Qazvin, and later Isfahan), but relied upon the long-term tradition of negotiation with local elites throughout the rest of their empire to run their administration, collect taxes, and maintain order. The empire operated through a flexible system of alliances, patronage, investments in charitable activities and the mobilization of resources for imperial ends, which were virtually the extent of centralized government.Footnote 21
Land and the resources it produced were the foundation of the empire. As Ann Lambton's classic study on land tenure in Iranian history demonstrated so well, regulating land use and the collection and circulation of agricultural surplus were the primary concerns of government. Privately owned lands were taxed, with the surplus going to local administrative centers for sale or distribution for administrative and military needs. The surplus on some lands was allotted as tuyul or suyurghul directly in exchange for service to the empire. This was essentially a grant permitting private tax collection, avoiding the need for administrators to collect and distribute. The local administrative office, or divan, in a province often leased lands directly under their own control and collected the surplus directly.Footnote 22 Religious charities (vaqf) held tax-free property to support a wide variety of functions, drawing wealth in cash and kind from agricultural lands, shops, mills, irrigation works, and such to support local mosques and madrasas, social services like poverty relief, aid for pilgrims, and of course healthy stipends for the ‘ulama’ administering those monies. These endowments acted as engines of regional economies, drawing in resources from bequeathed properties, funneling them into a central place, and generating demand for specified goods and services.Footnote 23 Through land tenure arrangements, we can at least tentatively glimpse the impact of methods of administration and law as they would have affected people beyond the immediate orbit of urban elite society. This system was designed to ensure the steady supply and distribution of resources built from agricultural surplus as the material foundation of the empire.
The Safavid Empire and other early modern Eurasian states did not function like the intrusive, technocratic states of the past few centuries, which serve as our usual reference points. This has led to descriptions of the Safavid Empire, and other analogous systems, as “weak states,” or positing that Iran possessed no state at all, in the Weberian sense, until the 20th century.Footnote 24 However, the Safavid Empire, like its Ottoman and Mughal neighbors, had a strong bureaucratic tradition, carried out foreign relations, maintained systems of defense (if not always a standing army), and managed certain elements of trade.Footnote 25 Even though the social impact of governance was indirect and filtered through intermediaries, the state had a clear impact on systems that touched everyday life. Direct and indirect taxation, land use, provisioning, religious charitable foundations, military mobilization, and security for transportation and communication are just a few examples.
To understand the historical significance of empires in the broadest sense, particularly beyond political and elite culture, we need to pay greater attention to the interaction between imperial systems and the material context they operate within and continuously reshape. Longue dureé (long-term) thinkers, back to the Annales school, have argued for a geographically conscious perspective on long-term changes in human societies.Footnote 26 Even back in the 1950s, Marshall Hodgson viewed geography as a limiting factor for local experiences, set within larger global patterns determined in part by geography. In The Venture of Islam, which has served as a foundational work for much of the later social history, he argued that the “mid-arid zone” within which Islamic civilization flourished was an important connective feature that facilitated its historical unity, with the spread of common norms and ethics within their shared ecological constraints.Footnote 27 Alfred Crosby, who was among the first of what we now call environmental historians, drew this analogy further to the study of societies as bounded, biological communities containing not just human beings, but a host of botanical, zoological, mineral, and microbial entities he called their portmanteau biota, along with styles of interaction and use that held them together.Footnote 28 Crosby's major works concerned the Columbian exchange and European forms of imperialism as great clashes of ecologies. European colonial empires have remained a focus for the structural end of this approach, as a system for managing resources in a dialectical relationship with natural environments.Footnote 29 Caroline Merchant, notably, has argued that social and political systems operate around an ecological core, which is a key factor in the generation of everything from social and political institutions to cultural discourses (of gender in particular) and modes of consciousness.Footnote 30
At the broadest level, the material significance of empires lies in their function as ecological zones, patterning the interaction between human systems and environments. An imperial ecology, in this view, is the reciprocal relationship between what we often term the “political economy” of an empire and the material backdrop that it both shapes and is shaped by over time. The reach of imperial networks creates a bounded system (albeit one that is immensely porous, tenuous, and always in flux) within which a relatively unified set of military, political, and economic norms are practiced, and imperial ambitions pursued. This is not to suggest that local communities are discrete, closed systems. In fact, in looking in any detail at local social, economic, or cultural systems in Iran historically, it is immediately obvious that they drew their vitality from the breadth of their connections, which extended well beyond their frontiers. The persistence of an overland corridor running between the Caucasus and the Iranian plateau, and through Central and South Asia, with a nearly continuous flow of commercial goods, pilgrims, migrants, and money, is one such system. Nor are the center-periphery dynamics of empire exclusive, or even necessarily dominant. Internal exchange was significant, and no doubt dwarfed foreign trade.
In the particular case of the Safavid Empire, its prosperity was built on its agricultural wealth and the state's ability to acquire and mobilize those resources within its domain, and in interaction with foreign agents. The Safavid court stood at the nexus of imperial networks that drew upon the resources of its hinterlands. The state organized taxation in cash and kind to provide resources for the bureaucracy, military, and various provisioning systems. For the provisioning of the capital and its royal court, for example, Chardin noted that villages within a radius of eight to nine days’ travel were “obliged to send a certain number of loads of wheat or flour to Isfahan, and to sell it there at the price indicated to them.”Footnote 31 Adam Olearius, traveling through Isfahan in the 1630s, noted that the provisioning of the city extended far beyond its immediate environs, deep into every provincial area.
The city is supplied with provisions out of the other provinces of the kingdom. Out of that of Kirman, there are brought, in the winter time, fat sheep, and, in summer, lambs, which are sold, at Isfahan, at nine or ten Abbas's a piece: for the very skin is worth five or six, upon the account of the fur, which is very precious there. The province of Kilan [Gilan] furnished it with rice; and those of Kendeman, Tasum, Ebarku, and Jeschi, though they lie at a great distance, with wheat and barley. Wood and charcoal are sold here by the pound, the wood near half a penny, and the charcoal a penny a pound, in regard they are forced to bring it from Mazandaran and Jeilak-Perjan.Footnote 32
An understanding of this material basis for the prosperity of the state was embedded in norms of statecraft, for instance in the “circle of justice” (daʾira-yi ʿadalat) found throughout Persianate mirrors for princes literature.Footnote 33 Safavid administrative manuals stated plainly that the ruler was obliged to uphold justice to maintain security of person and property, to support the agricultural and handicraft production that could, in turn, be taxed to support the military and other state apparatuses.Footnote 34 The state itself also intervened in economic life, and did not just extract from it. The court was involved in supporting the production and exchange of resources. They set local and interregional norms for the measuring, accounting, and valuation of goods and services, and mobilized resources for political and military needs.Footnote 35 During the reign of Shah ʿAbbas I (r. 1588–1629), the chancellery grew in influence in managing affairs of the state, including military matters.Footnote 36 Beginning under his reign, the Safavids more completely subordinated the Turkic Qizilbash military elite that previously held quasi-independent control over tuyul grants throughout the empire, thus bringing even this most unruly element of the Safavid state more fully into its political networks.Footnote 37 In matters of trade, the Safavid court became active in negotiating with merchants and foreign powers to develop trade agreements and facilitate exchange as a taxable activity. This involved mobilizing the political networks of empire to the extent that economic historians begin to speak of a “political economy” of the Safavid Empire.Footnote 38
The significance of central authority in Safavid history has lent credence to arguments that the Safavid collapse was largely the result of a breakdown in the concentration of central authorities. Roger Savory's account of late Safavid history, which focuses on the inattention and drunkenness of the last three shahs (ʿAbbas II, Safi II/Sulayman, and Sultan Husayn) and, remarkably, the growing influence of women in court life, has given way to more materially grounded explanations.Footnote 39 The most comprehensive approach to date is that of Rudi Matthee, whose Persia in Crisis revisits the question of Safavid decline with greater emphasis on the political and economic challenges facing the state. He argues that the economic challenges it faced in the last decades of the 17th century were at least partially driven by the ravages of drought, famine, and disease.Footnote 40 From this view, the Safavids accomplished a remarkable feat in holding together an empire encompassing a relatively small but highly fragmented population.
The Safavids were not alone in experiencing a crisis in the late 17th century. There is a growing body of literature detailing a clear pattern of ecological crisis across Eurasian land empires during this time. As Geoffrey Parker has argued, “it required the misguided policies pursued by religious and political leaders to turn the crisis caused by sudden climate change into catastrophe.”Footnote 41 In fact, he says, most observers cite war and mismanagement, not climate change, as the culprit behind the sudden disorder they found in their societies, a tendency that is strongly echoed in Safavid sources from the period. Safavid history has stood aloof from the field of climate change, in part because of the paucity of evidence. “Meteorological hazards” were an ever present part of Iranian history. Drought, famine, flooding, and severe winters were so frequent that social historians have suggested that people were inured to situations that might be taken as “extreme” elsewhere.Footnote 42 As Peter Christensen has noted for earlier periods on the Iranian plateau, this region was particularly vulnerable to even slight climatic variation; he posited that the region has had more severe and longer lasting consequences than surrounding areas.Footnote 43 Alan Mikhail has similarly argued that “climate mattered more than politics to more people for more of Iranian history” and should thus assume a more central place in the field.Footnote 44 However, political and economic historians of the late Safavid period have noted a particularly severe pattern of crop failures, disease epidemics, and general breakdown of order in the background of their narratives. We now have some limited scientific evidence available to fill in the gaps of our sparse written sources, particularly for the climatic backdrop of agrarian crises. The following sections will present a climate reconstruction using tree-ring chronologies from the area of the eastern Mediterranean, which will be analyzed in tandem with global climatic data to place late Safavid history into the broader context of Eurasian environmental history.
Tree Rings: Evidence for Iran's 17th-Century Climate History
The historiography of Safavid decline has a strong subtext of environmental crises lurking in the background. Scholars mention the recurrence of drought, famine, and plague as evidence of declining social conditions, but with little further discussion of their impact on the empire as a whole.Footnote 45 Historians of Iran have been rightly cautious about making too strong of a connection between climate and imperial decline, both because of the dearth of textual evidence and to avoid the implication that climate alone possesses the power to affect human affairs directly. Now, with greater scientific evidence from climate reconstructions and dendrochronology, as well as significant literature on how the climate crises affected empires throughout Eurasia, is an appropriate moment to better incorporate environmental factors into our account of late Safavid history.
Scholarship on the global 17th-century crisis developed, unsurprisingly, out of European historiography originally, but benefited from the growth of comparative and global histories. Once scholars began looking more seriously to mend the seams between area studies, it was immediately clear that Europe was far from alone in this. More wars took place in the 17th century than at any time in world history up until World War II.Footnote 46 The beginning of the century is known as the Time of Troubles in Russian historiography, marked by a widespread famine that may have killed as much as one-third of the population and contributed to mass political disorder. The settlers of Jamestown, arriving in the early 17th century, experienced extremely dry summers and bitterly cold winters, and climatic challenges were noted in the Americas for decades.Footnote 47 China's transition from Ming to Qing rule in 1644, driven by uprisings throughout its northern provinces, was contemporary with the end of the Thirty Years War and the beginning of the English Civil War in Europe.Footnote 48 One of the most serious rebellions in Ottoman history, the Celali revolt, peaked in the 1590s–1600s, driven by peasant rebellions and extraordinary demands by the central government to support its war with the Hapsburgs.Footnote 49 Together, climate change, food shortages, and conflict converged in one of the most significant periods of crisis in world history.
Explanations have increasingly converged on material factors. Hobsbawm argued in the 1950s that the dramatic spike in popular uprisings in 17th-century Europe was driven by underlying social and economic forces related to the transition from feudalism to capitalism.Footnote 50 Although individual case studies have emphasized elite politics and ideologies, the wide-angle lens of global and comparative studies have set these in a world increasingly interconnected through commerce and empire. Hobsbawm identified a cycle of boom and bust in the world economy connected to patterns of exchange. The massive influx of New World silver, although a boon to the Spanish Empire, also circulated widely (with much of it eventually making its way to China), driving inflation and, with inadequate regulation, fiscal problems for states.
As scholars began integrating climatic history into their study of this period, they also noted the remarkable diversity of local experiences. Geoffrey Parker has surveyed an impressive range of empirical evidence detailing the variety of conditions and responses. Although these are by no means comprehensive, they convey that the 17th century was marked by erratic climatic events, not just cold weather. Bitter cold was certainly one remarkable feature, with, for instance, the freezing of the Thames in London and the Bosporus Strait in Istanbul. Periods of recurring drought or, conversely, heavy rains and flooding as in China, also were part of the overall picture. Comparative studies have clearly shown that social and political conditions, economic forces, and contingencies and circumstances were significant factors, even where common pressures of extreme weather, drought, famine, and plague, were present. The effects varied widely, with some areas hardly impacted at all, whereas Russia, northern Europe, and the Ottoman lands experienced notable social crises. One common root to all of these problems lay in the sensitivity of early modern empires to anything affecting their agricultural base. With growing populations already stretching food production to its limits, the decline, and sometimes sudden loss, of food supply for both people and animals was devastating.Footnote 51
Iran, however, has to this point remained absent from comparative studies, with historians citing a lack of appropriate sources and climatic observations to make a meaningful contribution to the global study of the Little Ice Age. Using tools from the environmental sciences, tree rings compose one notable set of non-textual sources that can provide context for what was happening climatically on the Iranian plateau. Dendrochronology gives us access to a physical archive of historical climate data, as temperature and precipitation affect annual growth in systematic ways that can be uncovered through the correlation of growth patterns across numerous samples. Measuring growth rings on a cylindrical tree trunk requires some additional number crunching and standardization, since the same volume of wood growth is spread more widely on a thinner ring the further it is from the center. Dendrochronologists also have to account for a tree starting off more flexible at a young age and becoming more rigid as it gets older (much like historians). The International Tree-Ring Databank includes thousands of raw “chronologies,” or data sets from tree ring measurements, drawn from samples throughout the world, which can be standardized using these methods and then correlated to exclude outliers and sharpen the signal they produce. What results is a valuable physical archive that gives a general picture of trends in temperature and precipitation across a specific region over a given time period.Footnote 52
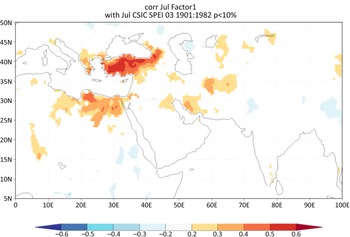
However, there are no chronologies in the International Tree-Ring Databank from modern Iran. To fill in this gap in the data, we identified surrounding areas with strong historical correlation to climate patterns in Iran, using a much more robust record of historical climate data from the past century. Fourteen chronologies in particular from juniper, pine, and cedar trees in Turkey, Cypress, Lebanon, and Jordan were located in places with statistically significant correlations to temperature and precipitation patterns in western and central Iran, and had a strong expressed population signal (EPS), meaning the correlation between the data sets themselves was significant enough to draw conclusions from. This is by no means a precise tool providing anything like granular data on specific climatic events, but it does demonstrate climatic trends in regions with historical correlations to Iran (Fig. 2).
Spatial correlation of standardized precipitation evaporation index three-month average in July with Factor 1 (mostly weighted with juniper trees from Turkey). For Factor 1, we ran a principal component analysis with all of the tree-ring chronologies from 1901–82 that had a strong enough common expressed population signal (EPS > 0.85) back to 1670; Factor 1 represented the maximum variance among those chronologies. Iran had only four climate stations that were included in this spatial climate data set, and those records went back only fifteen years, which explains the lack of correlation across most of Iran.

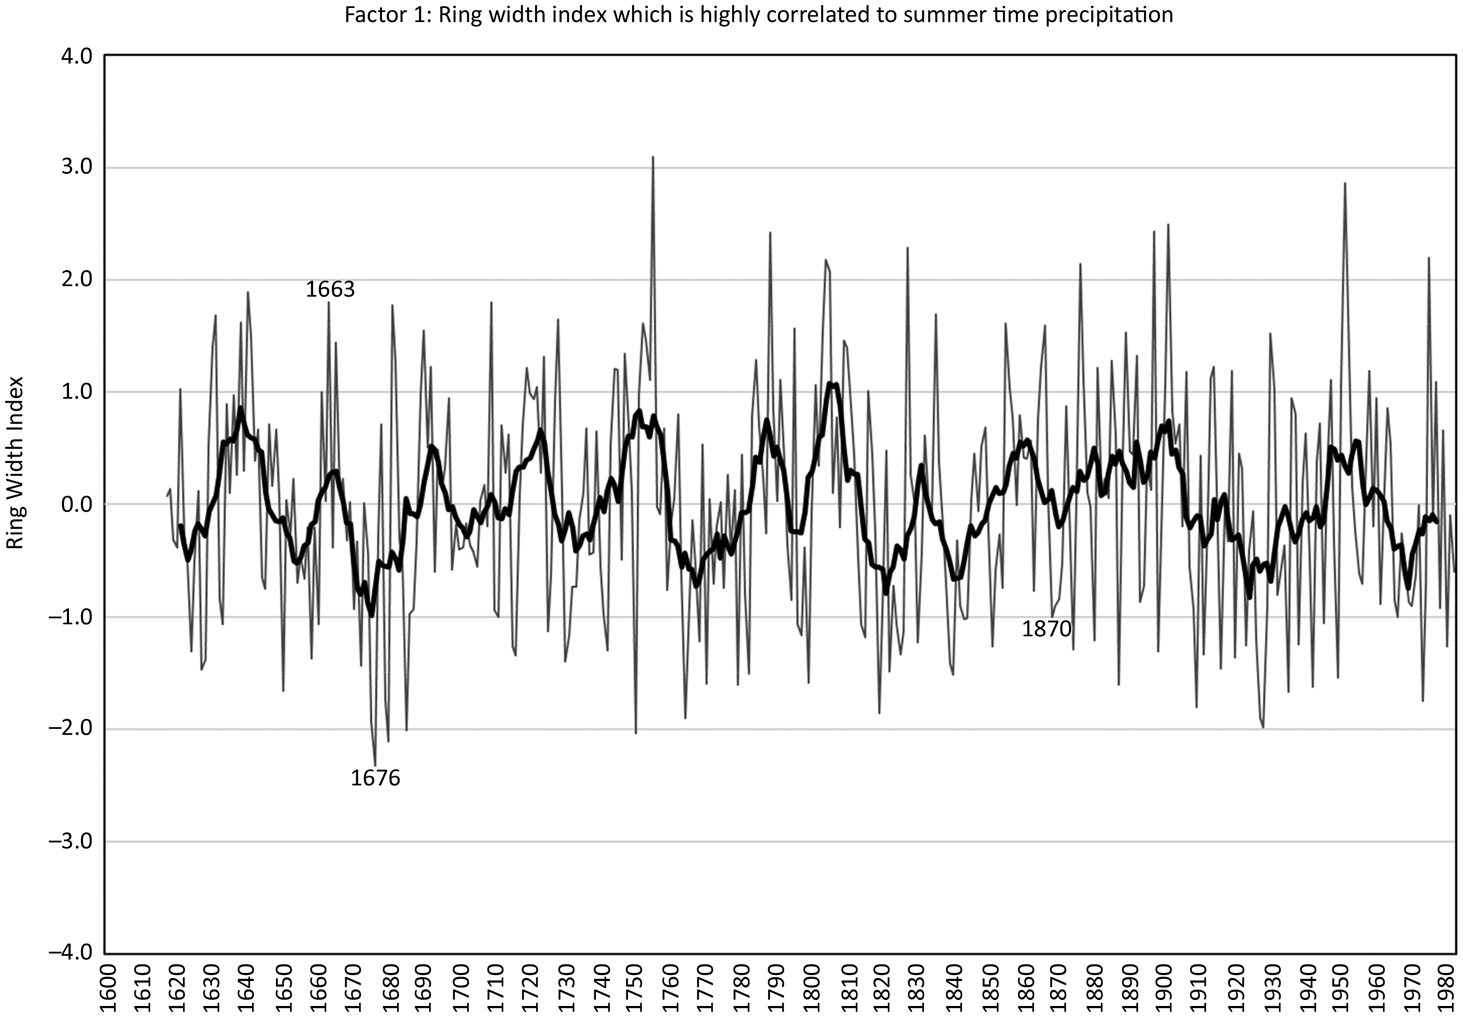
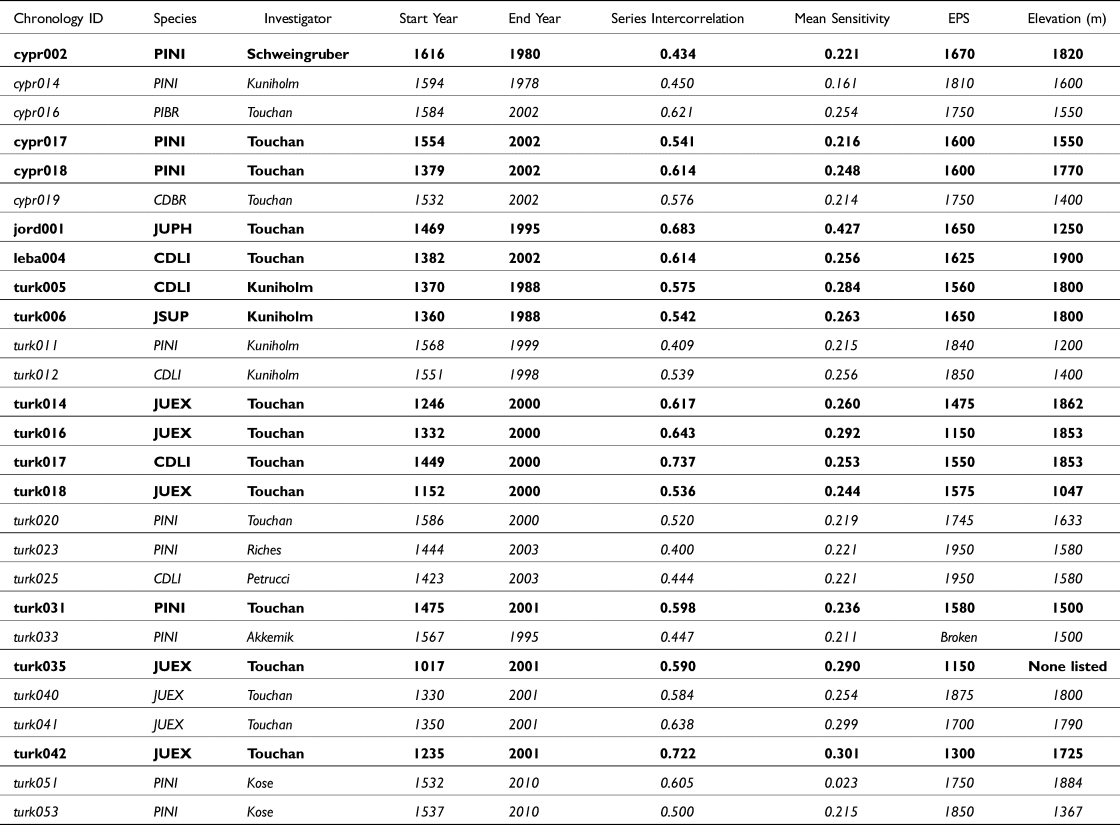
To get a picture of the climatic trends that tree rings record, we identified a set of relevant samples to analyze (Table 1). Ultimately, fourteen tree-ring chronologies with a statistically significant correlation were selected that yielded useful data for the time and place under consideration (Fig. 2).Footnote 53 The “signal” this analysis produced is represented by the wildly zigzagging light grey line (Fig. 3). This represents the amount of new annual growth in trees. This is a proxy for identifying a variety of local climatic factors over time, most notably temperature and precipitation. By looking at scattered data sets with statistically significant correlations, it excludes localized influences particular to individual trees and draws out climatic factors that would have influenced tree-ring growth throughout the entirety of that region. Year to year, that gray line shows great variation in ring growth. A ten-year average, marked by the black line, focuses the longer-term trends. This, along with the year-to-year variance and, especially, consecutive years of minimal growth, are important to the overall picture.
Ring width index, highly correlated to summertime precipitation. The light grey line is the annual record and the darker black line is a ten-year running average. The annual record is a three-month average standardized precipitation-evapotranspiration index for June, July, and August. Factor 1 has an r (correlation coefficient) of 0.576.

Tree-ring chronology statistics. “EPS” indicates the date through which the expressed population signal was above our threshold. PINI is Pinus nigra, JUEX is Juniperus excelsa, JUSP is Juniperus undifferentiated species, CDBR is Cedrus brevifolia, and CDLI is Cedrus libani. Bold text chronologies were included in this analysis, whereas the italic text chronologies were excluded because of lack of a common signal going far enough back in time.

We can see from the ten-year average represented by the solid black line in Figure 3 that tree-ring growth severely declined from 1663 through 1676. In fact, these tree-ring samples taken from regions with a close historical correlation to climate patterns on the Iranian plateau experienced their most significant drought in the past four hundred years at that time. The year 1676 saw the single lowest growth rate (and therefore the driest year) for the past four hundred years, worse even than the Great Famine of the 1870s. This signal represents the effects of both precipitation and temperature, so not only were there dry growing seasons, there were cold winters. This corroborates scattered references to snow (a rarity in lowlands in the interior of the Iranian plateau) during the 1870s.Footnote 54
These findings corroborate evidence of climatic stress in the closing decades of the Safavid period from a more focused study in 2017 by Gholami, Ahmadi Jolandan, and Torkaman on tree rings in the Roodbar region of the Alborz range in northern Iran. The investigators had limited access to samples but were able to analyze the rings of six old growth Mediterranean Cypress trees. Their study was focused on the effects of climate change since the mid-20th century, but their samples provided data going back to 1600. The study concluded that over the past four hundred years, “the longest drought happened between 1700–1725,” evidenced by a lengthy period of stunted ring growth.Footnote 55 This dip punctuated a much longer decline in temperatures and precipitation levels continuing to this day. Across the Zagros in northern Iraq, researchers using mineral deposits in cave stalagmites modeled 2,400 years of climatic change and similarly concluded that the region has experienced a long-term aridification trend since at least 950 A.D.Footnote 56 Faisal Husain noted the importance of this study as corroborating evidence of particularly severe drought in 1687–78. The thickness of annual growth on those stalagmites suddenly plummeted below the long-term average and their chemical composition shifted in line with other periods of drought. Ottoman chronicle and archival records from those years note the dry spell, and also its effects on everything from water levels in the Tigris and Euphrates to soaring food prices.Footnote 57
In late Safavid Iran, as with neighboring regions, the overall pattern we can discern in the climatic record is an extended cold and dry period, set in a period of long-term aridification. This surely would have produced conditions for disruptions to the agricultural economy, sensitive as it was to climatic fluctuations. This is important context for understanding the cycle of drought, famine, and disease that contributed to the decline of the empire. Of course, as case studies have shown, historical circumstances and human agency are all important parts of the overall picture, to which we will now return.
Revisiting Environmental Crises in Late Safavid Historiography
Although the tree-ring data above provides material context for Safavid decline, we must consider that human agency is an important component of this as well. This is especially true when we include humanity as part of nature, and thus human history embedded as an interactive player within natural processes. Further, this environmental approach brings us closer to specifying what declined, and why. The most widely cited accounts of late Safavid history focus on elite political activities. Building from the theoretical position that the power of the Safavid shahs was absolute, the activities of a few individuals at the top were considered to be paramount to the empire's well-being. From this perspective, once Shah Safi II/Sulayman took his hands off the wheel by retreating to the palace and leaving the empire in the hands of courtiers, the political machine ended up in a ditch. Political explanations dominate in part because of the limited nature of the sources available to us. The extant textual evidence rarely discusses nature and geography, let alone climate, and much of the narrative of social and economic decline comes from a handful of accounts by native and foreign writers fixated on events at the center. Nonetheless, it is important to revisit the evidence behind the traditional decline narrative with a different theoretical approach and our rough dendrochronological sketch in mind.
Strikingly, as late as the 1640s, the historian and poet Valiquli ibn Daʾud Shamlu glowingly described the peaceful state of the “guarded domains,” the flourishing of greenery at Nowruz, the prosperity of its crops, and even the relative prosperity of the peasantry.Footnote 58 The French Capuchin minister Father Raphael DuMans, traveling through the Safavid Empire as part of a mission among the Armenian community of New Julfa, describes in detail the peace and prosperity of the empire during his travels in 1660. At the same time, however, he made the prescient comment that Iran had reached a point of equilibrium, at which the region was well-populated but stretching thin the available resources. “There is only enough grain to feed the people of the country. If they multiplied, as in the West, [this] would make it necessary that either a portion died or they make a colony elsewhere.”Footnote 59 This was, no doubt, informed by his experiences in mid-17th-century Europe, where crop failures and famine took a significant toll on the population, which had only just begun to rebound, in part through the introduction of New World crops and raw materials supplied through colonial enterprises.
From the mid-1660s onward, however, the general picture of tranquility changed rapidly. Local chronicles go curiously silent for the first part of Safi II/Sulayman's reign.Footnote 60 Meanwhile, discussions of crises in the countryside became commonplace among foreign travelers, who tended to give the most detailed descriptions of social and economic conditions in the country. One particularly important figure for our purposes was the famous French traveler Jean Chardin, who described in detail the deteriorating situation in the empire between his arrival in 1665 and his return to Europe in 1677 in a massive ten-volume travelogue. He describes nearly constant famine and plague during his time in Iran, beginning with a series of poor harvests brought on by drought. In 1667, he notes “high prices, war, and diseases, in turn, afflicted most of the provinces of the empire,” for which he blames the inattention of the central government and the selfishness of local governors.Footnote 61 In 1668, the year of Sulayman's second coronation, this was accompanied by a winter which was as cold as the summer was dry.Footnote 62 The erratic weather continued with torrential rains in 1668, which may have wiped out more than half of the households of Shiraz.Footnote 63 By 1669, the provisioning system for the capital failed and a dire famine hit Isfahan. Chardin notes, interestingly, that the people of Isfahan began gathering near one of the city gates where they were accustomed to wheat arriving in large loads at regular intervals. He relates that these gatherings sometimes turned violent, but “not daring to attack the government . . . it was necessary instead to attack the door,” thenceforth known locally as the “famine gate.”Footnote 64 These crises continued and peaked in 1672 when heavy snows and bitter cold in the capital Isfahan were attested to by Chardin. A total of 70,000 died in Isfahan alone.Footnote 65 Rudi Matthee, in his work on the Dutch East India Company archives, notes a similar chronology of widespread droughts and crop failures in the Safavid Empire in 1666 and 1668, becoming a near constant crisis through the 1670s.Footnote 66
Geoffrey Parker notes that observers of the social and economic crises of the 17th century miss the long-term underlying environmental context and point instead to the more immediate causes in the realm of human affairs. Chardin similarly places blame on corruption and mismanagement by incompetent officials. Reflecting on these crises before he departed Iran for good in 1677, Chardin blames the political turmoil on the character of the shah. In Isfahan, during the famines of the 1660s, he was quite clear in placing blame on corrupt officials for the scarcity and high price of food. Not only, he says, were successive crop failures and a plague of locusts to blame, but the government failed to order sufficient wheat for the city in advance of the arrival of the court party, driving prices yet higher.Footnote 67 Wheat merchants and bakers, too, continued to hoard grain, despite the rising prices and misery, to maximize their profits. He summarizes:
In the end, poor government was partially the cause of the high cost [of wheat], because the laws were not observed and the officials neglected their duty with little fear of being punished. So because the muhtasib, or chief of police, received presents from those who sold the necessities of life, to please them, he had to publish the price of goods every week as those gentlemen desired, that is to say, an excessive price and three-quarters higher than they would be in the times of the late [previous] king.Footnote 68
This situation is remarkably similar to the great famine in Qajar Iran in the 1870s, when two consecutive years of drought and crop failures led to a widespread famine, in which perhaps 20 to 25 percent of the population perished. As Shoko Okazaki has argued:
The principal factor of the famine of 1870–71 was undoubtedly two consecutive years of severe drought. This major calamity was not, however, by any means due entirely to the capriciousness of nature. Nor was the increase in production of opium and cotton an important factor. . . . The responsibility for the tragedy can be squarely laid at the door of senior bureaucrats, landlords, grain dealers and high-ranking religious officials who engaged in hoarding and market manipulation. In addition, the central government and provincial governors, who did not take any effective steps to remedy the situation, must bear some of the blame for this calamity. In other words, the greed and incompetence of the wealthy and powerful were as responsible for the great suffering endured by the people in the great famine as was the drought.Footnote 69
Climate, in other words, is only part of the story. As Ranin Kazemi has argued, recurring famines in Qajar Iran were the result of a lack of access to food, rather than outright shortages. Speculators hoarded grain in times of scarcity, driving prices higher, artificially deepening and extending the effects of failed harvests. Government interventions were weak and ineffective. A favorite was the counterproductive measure of price fixing (nirkh), which disincentivized bringing needed supplies to market, while the discrepancy between market price and the nirkh price encouraged further hoarding.Footnote 70 During the 1870–72 famine, the effects were uneven, based on environmental and human factors. Kirman, for instance, escaped the worst of its effects under judicious management, especially as compared with the dire situation in Shiraz and Isfahan, despite the similarity of the climatic circumstances faced in each region. The governor of Kirman even exported grain from provincial granaries to help relieve food shortages elsewhere.Footnote 71 These distortions to the market occurred even in the most prosperous of times. Chardin noted a remarkably similar situation in the 1630s, shortly after the death of Shah ʿAbbas I (d. 1629).Footnote 72 In times of ecological strain, however, the interaction of these human and environmental factors can be devastating.
Much of the evidence from the 1660s and 1670s comes from a mere handful of sources, primarily drawn from European travelers like Chardin, who are especially prone to exaggeration and misinformation. Although the details are certainly murky, they reflect an overall impression that unusual climatic events were putting stress on the empire's integrity. As Keith McLachlan has noted, in the 20th century less than 10 percent of the land was arable, even with 20th-century agricultural technologies, and although sensitive to variation in rainfall this was offset somewhat by artificial irrigation techniques like the widespread use of qanats, which kept a steady flow of water to lowland fields for short-term changes.Footnote 73 Regardless, the line between a healthy growing season and a destructive famine was thin.
Drought alone is not itself a sufficient cause for famine, it merely presents an opportunity for other types of systemic failures to present themselves. Although the climate events described above are closely connected with recurring patterns of food shortages and famines throughout the late 17th century, we must widen our analytical lens to include human agency at the local and the imperial levels. As Kazemi noted, it was the actions of local merchants, landowners, and administrators who engaged in a pattern of speculation, hoarding, price fixing, bribery, and general mismanagement that turned an episode of successive droughts in the 1870s into a dramatic humanitarian catastrophe.Footnote 74 Abbas Amanat similarly argued that the horrendous famine in Iran at the end of World War I laid bare the shortcomings of the country's political and economic systems, hastening their general breakdown and the rise of a new set of institutions under Reza Khan.Footnote 75
The importance of human agency in response to climatic challenges is just as true of the Safavid case. Ahmad Ketabi's 2005 analysis of droughts and famines in Iranian history noted a similar dynamic in the 1660s to that noted by Kazemi and Amanat for the late Qajar period. Echoing Chardin, Ketabi placed blame directly at the hands of the court for exacerbating the crisis.
Not only did Isfahan's divan officials and muhtasib fail to secure and deliver goods to the city to fulfill the needs of the people, but by taking bribes from speculators they allowed for the shortage and high costs of grain to continue such that the price of wheat had increased some 75 percent from the time of Shah ʿAbbas II.Footnote 76
Typically, Safavid chronicles from the 1660s and 1670s are sparse, and pay little attention to the environmental crises noted by foreign observers except insofar as they affected the capital at Isfahan. Crop failures continued into the 1680s and 1690s, but were attributed to more diverse causes, including, for instance, a plague of locusts in 1688 and extraordinary rains in 1689. In the 1680s and 1690s, however, another familiar environmental crisis caught their attention more firmly, as waves of devastating plagues swept through the Iranian plateau, the Caucasus, and the Ottoman lands to the west. Mir ʿAbd al-Husain Khatunabadi (d. 1694), for instance, who barely noted the crises of the 1660s and 1670s in his chronicle Vaqayiʾ al-Sinin va al-Aʿvam (a “Chronology of Events” listed briefly by year), closely followed the progress of a plague from 1684 through 1691 across Azerbaijan from Gilan, to Ardabil, to Astarabad, then into the heart of the Safavid Empire in Isfahan and Shiraz.Footnote 77 Even rough figures are difficult to come by, but he claims that a cholera epidemic killed more than 80,000 people in 1685 alone. It then hit Tabriz, killing another 40,000 over the following two years.Footnote 78 When it arrived in Isfahan, he estimates that thirty to thirty-five people died per day at the height of the epidemic, in 1686–87.Footnote 79 In any case, this was clearly a major demographic event by scope of the crisis and what we know of how it affected surrounding regions.
Just as the connection between drought and famine requires reference to human systems for a full understanding, so does their connection to the spread of disease. Although plague is the result of exposure to bacterial pathogens, Alan Mikhail has argued that famine and plague commonly acted as a mutually reinforcing cycle, each weakening the population's resistance to the effects of the other.Footnote 80 Disease may often strike the fatal blow, but food shortages, dislocation, warfare, and other such pressures often put the club in its hands. Persianate writers, for their part, often ascribed disease to climatic causes, dividing lands between salubrious and insalubrious zones. As just one example, in the case of plague, Qazvini attributed it to a “poisonous wind” (varzidan-e bad-e samum) in Tabas, that spread then to Tabriz and killed some 12,000 people there in the summer of 1639.Footnote 81
Given the lack of specificity on social conditions in our sources for late Safavid history, we also should take note of the wider context. These scattered comments on drought and plague coincide with other environmental crises throughout Eurasia.Footnote 82 In Mughal India, the late 17th century was a period of turmoil, and historians have increasingly pointed to climate change as a contributing factor. In 1658, famine spread as the monsoon rains suddenly slowed to a trickle, while the empire, hoarding and provisioning its armies for ongoing internal conflicts, drove the situation to a crisis.Footnote 83 Alexander Dow relates extreme measures taken by Aurangzeb to combat famine that broke out after two years without rain in India.Footnote 84 A sudden downturn in the monsoon rains led to famine in 1702, followed closely by plague, all in the context of ongoing internal strife as Maratha armies rose up and plundered the Deccan region.Footnote 85 A particularly severe famine and plague occurred in the Arabian Peninsula in the 1670s as well, recalled by 19th-century chroniclers because of the sale of children and large-scale loss of livestock.Footnote 86 Interestingly, in the Ottoman Empire, climatic crises peaked earlier in the 17th century, accompanied by droughts in the Mediterranean region.Footnote 87 However, recurring famine remained widespread through the end of the 17th century, with notable episodes in Baghdad in 1689 and Basra and Khuzestan in 1691.Footnote 88
By the closing years of Safavid rule, the effects of these intermittent environmental crises had taken a toll on the integrity of the empire and were readily apparent in Isfahan itself. In February 1715, Mir ʿAbd al-Husayn Khatunabadi's younger brother, Mir Muhammad Ismaʿil, noted a sudden rise in the price of wheat, flour, and bread in Isfahan. General unrest broke out in the city, which the state attempted to put down through a combination of force and price fixing. This occurred shortly after the first serious Afghan incursion resulted in the seizure of Herat and moved from there into Khurasan.Footnote 89 This was the beginning of the end for Khatunabadi, who declined to even relate events of the intervening years, skipping straight to the final fall of Isfahan in 1722 to Mahmud's army. The Safavids were unable to muster sufficient troops or provisions to hold off even the force of nine thousand that marched in and besieged the city almost uncontested. The general picture is of a total disintegration of state structures, in tandem with a long cycle of environmental crises that undercut the material basis of the empire.
In the aftermath of the Safavid collapse, Persianate authors referred mainly to political and military explanations for the deteriorating situation. Qazvini's Favayid al-Safaviyya (Beneficial Narratives on the Safavids) in particular is a unique source, offering a view of Safavid history from the perspective of its recent demise. It was prepared under the sponsorship of a Safavid prince, Abu al-Fath Sultan Muhammad Mirza, who was then residing in India.Footnote 90 Under the circumstances, Qazvini's account is frank in pointing out the failures of the Safavid rulers, emphasizing especially Sulayman and Sultan Husayn's failures to maintain control over their borderlands as the chief factor in the empire's fall. Of Shah Safi II/Sulayman in particular, he likens the tense standoff on the eastern frontiers to being “like a wolf drinking from a spring with an ewe.”Footnote 91 Early in his reign, while the central government looked on, Cossacks were ravaging the southern banks of the Caspian Sea, Uzbeks claimed control over Baluchi territories, the Mughals were threatening the contested city of Qandahar, and the Ottomans were rumored to be preparing for an invasion on Iran's western frontiers, all with little response.Footnote 92 The passive policies of Shah Safi II/Sulayman were continued by Sultan Husayn (r. 1694–1722), who rarely left Isfahan, although maintaining peace with the Ottomans. From one perspective, wasteful military campaigns and the resources needed to mobilize military forces could only have worsened an already deteriorating situation in the country. There also is evidence to suggest that perhaps this was, in fact, symptomatic of a more serious problem in Safavid imperial ecology. Matthee relates that although Sultan Husayn maintained peace with the Ottomans to the west, he in fact attempted in 1696 to campaign on the eastern frontiers, but was halted by an inability to provision his army due to yet another drought. Similarly, a military alliance with the Portuguese was put on hold due to his inability to produce the required troops.Footnote 93 At the same time, Sultan Husayn had a reputation as a spendthrift, and large sums of money were spent on various building projects as well as the upkeep of growing expenses at court.Footnote 94
Reorienting the Fall of Isfahan
The Jesuit missionary Father Krusinski, present among the Armenians of New Julfa during the siege of Isfahan, related the horrors of the siege and eventual fall of the city in 1722 at the hands of a small band of Afghan warriors. The Ghilzai Afghan ruler Mahmud marched an army straight across the Iranian plateau to Isfahan via Kirman and Yazd with little resistance. They encountered an empire in crisis. In the year leading up to the siege, Sultan Husayn attempted to secure provisions for the capital but ultimately discovered that “they had no other Troops to act, nor Money to raise them, and no skillful Generals to command them.”Footnote 95 The empire was gone before the Afghans arrived at the gates. The Afghans set up a siege, choking off the city from its hinterland, with no one to free them from the predicament. The situation quickly deteriorated:
Corn failing in September, a Pound of Bread was sold for thirty Shillings, and in October for above fifty. The City of Ispahan being so full of Trees, that according to Tavernier it looks more like a Forest than a City, Part of them was fell'd in the Famine Time, and the Leaves and Bark sold by the Pound. The Roots of Herbs made into Meal were eaten. Shoe-Leather being boil'd was for a time the common Food; at last they came to eat human Flesh, and the Streets being full of Carcasses, some had their Thighs cut off privately. . . . Several Children were stolen and eaten, half dead as they were of Famine; and that the most monstrous Barbarities, which we read with so much Horror in the Relations of the most cruel Famines, might not be wanting in that of Ispahan, there were Mothers who kill'd and eat their own Children. The Mortality, which is the inevitable Consequence of the like Calamities, was answerable to the Excess of Misery in Ispahan.Footnote 96
This was but the last, and most dramatic, in a series of crises. In the absence of detailed evidence of conditions outside of Isfahan for the late 17th and early 18th centuries, historians have been rightly cautious about discussing social conditions in the countryside in the final decades of Safavid rule. At the same time, there is no reason we should assume that because most of our sources detail events at court those were the decisive factors in the process. The decline literature has invariably fixed its attention on activities among imperial elites, suggesting it was the failure of the final two or three rulers to hold things together that caused the dynasty to fall. Yet even with these explanations, we see the fall of Isfahan as the consequence of a deeper systemic failure. In David Morgan's Medieval Persia, for instance, he explains the situation as follows:
The reasons for the fall of the Safawid dynasty will have been apparent from the above narrative—the decline in the personal qualities of the rulers, due in part to their upbringing in the harem; linked with this, the excessive influence on government of the women and eunuchs of the harem; the decrease of government efficiency and the disastrous reduction in effectiveness of the military forces. It would probably be true to say that a determined assault from outside could have overthrown the Safawids at almost any time since the death of Shah ‘Abbas II. It just so happened, fortunately for the shahs and for the Persian people, that before Mahmud Ghilzai set off for Isfahan with his less than formidable army, no one had tried.Footnote 97
Two additional sets of evidence are now available to us that can allow us to speak more directly about the end of the Safavids’ reign as a collapse of its imperial ecology. First, we now have greater evidence from climate reconstruction models and tree-ring data which demonstrate that there was, indeed, a lengthy period of climatic stress marked by drought and low temperatures. Although we recognize that drought does not, in itself, cause famine, it is a critical factor when combined with other systemic problems like those suggested by Morgan. The mentions of famines, plagues, natural disasters, and the excessive spending at court and mobilization for warfare on the Safavid frontiers are too frequent to ignore. These processes undermined the stability of the relationships between imperial networks, local communities, and natural environments, as the activities of the court exhausted a depleted resource base. A deteriorating situation, in stops and starts, may have been triggered by a climatic downturn, but was actualized by human activities, resulting in the breakdown of the Safavids’ imperial ecological system.
Second, there is growing evidence of a series of interconnected ecological crises across Eurasia, which recent scholarship on the Ottoman Empire and Mughal Empire has now brought right up to the threshold of the Safavid domain.Footnote 98 We are arguing here simply for the connection of Safavid history to broader developments in 18th-century Eurasia. The reluctance to discuss climate crises is an outgrowth of a broader skepticism about granting any form of agency to natural processes, outside of those processes directly in the hands of human agents (who are themselves a part of nature). Safavid historiography, as a whole, is overwhelmingly focused on crises of legitimacy, the balance of tribal and urban Persianate forces, the central government and peripheral powers, or political and economic mismanagement. When placed in the context of climatic change, all of these were significant and decisive factors.
The ecological crisis continued through the 18th century. The political history of the decades following the fall of Isfahan is dominated by tracing the rise and fall of competing imperial projects. Rival Afghan, Zand, Afsharid, and Qajar forces, among others, gathered men, animals, grain, and movable wealth to pursue their military goals. Ecological warfare, such as destroying crops in the hinterland of cities under attack, was a common tactic employed to undermine territorial strongholds of rival armies.Footnote 99 Famine and plague continued in Iran and adjacent areas. Some thirty years ago, Juan Cole noted that one of the great intellectual and religious developments of the post-Safavid period, the Akhbari-ʿUsuli controversy over the status of mujtahids in Shiʾi jurisprudence, was resolved less through debate, but rather in large part by plague. As disease swept through Najaf and Karbala in the 1770s, it killed off many of the native Akhbaris who had nowhere to flee when crisis struck, unlike the largely Iranian ʿUsuli scholars who then inherited a position of dominance.Footnote 100 The final victory of the Qajars, who would govern Iran from 1795 to 1925 with the on-again, off-again support of ʿUsuli ulema, came at the cost of the wholesale blinding and slaughter of the population of Kirman City, who dared to harbor a rival prince.
Clearly, there is still much work to be done on the long-term interaction between human societies and natural environments in Iran. The interplay of ecology and imperial ambitions is a long-term feature of Iranian history that we have only just begun to understand. In the case of the late Safavid period and its long afterlife, it is necessary to better integrate the material backdrop of climatic crises and the end of empire, each reinforcing the other, in the context of a broad ecological crisis among Eurasian empires.
Environmental history, to be sure, has its own declensionist tendencies when applied to modern history, with a deeply embedded story of environmental degradation as an inherent feature of modernity and industrialization. This is, in large part, a result of the dramatic changes in our environment, with climate change today causing renewed interest in the influence of environmental factors in historical processes. An important part of this experience is realizing that the environment alone does not possess agency, nor is it a neutral backdrop to human affairs. We have seen recently how global environmental change can have a wide range of local effects, with some regions particularly vulnerable to variations in the climate. A prolonged drought in Iran in 2014 has left us with shocking scenes of the famed Safavid-era Khaju bridge crossing a dry riverbed over the Zayinda Rud. Lake Urmiya in the northwest of Iran is rapidly receding, much as with the better-known Aral Sea crisis. The Covid-19 pandemic, still ongoing at the time of writing, has taken a severe toll on the country. It is clear to environmentalists in Iran that drought and disease alone are not the entire story; they point to bureaucratic management, global economic and geopolitical factors, and human responses as important factors in creating national crises.Footnote 101 Although there are differences in scale to consider, we also should note that these are not entirely new phenomena. The 1870s drought and famine in Iran, which left tens of thousands dead, is but one famous incident that has received scholarly attention, in part because it was widely viewed and commented on by native and local observers whose accounts have been preserved.Footnote 102
The late Safavid period represents a less well-known, but no less dramatic, episode in global environmental history that, due to a general paucity of written sources, has not yet fully been explored. Whispers of environmental crisis in the background of late Safavid history, when the empire reached the peak of its power and then collapsed under a relatively small Afghan army less than a century later, are too loud to ignore, or compartmentalize as a separate set of problems from the general crises engulfing early modern Eurasia. The problem of sources remains significant, but with the additional tools available from environmental sciences we can begin to fill in this picture.