Introduction
Metal-ion batteries are today the technology of choice for mobile applications, with Li ion batteries providing the highest energy densities among commercial batteries.[Reference Thackeray, Wolverton and Isaacs1] Even higher specific capacity and higher rate batteries are required to achieve, respectively, all-electric vehicles and economical large-scale storage required for integrating clean yet intermittent sources of electricity such as solar or wind.[Reference Barbour, Grant Wilson, Bryden, McGregor, Mulheran and Hall2] Specifically, for large-scale storage, sodium-ion batteries are a promising technology, as Na is cheaper and more abundant than Li.[Reference Shukla and Kumar3] Diffusion properties of metal ions in electrode materials are a key determinant of achievable cycling rates.
Graphene has emerged as a viable anode material for electrochemical batteries, providing a high electric conductivity and decent Li diffusivity, with the diffusion barrier of about 0.3 eV.[Reference Fan, Zheng and Kuo4–Reference Uthaisar and Barone6] Graphene can be used as a storage medium for ions[Reference Fang, Lv, Che, Wu, Zhang, Gu, Zheng and Zhao7] and as a conducting binder for graphene–nanoparticle composites providing high connectivity between particles of high-specific capacity materials even as they undergo significant expansion and contraction on cycling.[Reference Luo, Fang, Wang, Zhou, Song and Zhi8, Reference Gu, Xu and Wang9] Surface diffusion of metal atoms/ions on graphene, together with insertion into and bulk diffusion in the nanoparticles, determines the overall rate capability of the anode. In these applications, graphene is significantly curved.[Reference Fan, Zheng and Kuo4, Reference Luo, Fang, Wang, Zhou, Song and Zhi8, Reference Gu, Xu and Wang9] Graphene is intrinsically curved,[Reference Meyer, Geim, Katsnelson, Novoselov, Booth and Roth10] and graphene used as an anode has crumpled paper morphology with kinks on the scale of a few nm.[Reference Lian, Zhu, Liang, Li, Yang and Wanga11, Reference Guo, Song and Chen12]
Curvature is known to result in changes in the electronic properties of graphene. For instance, significant effects on graphene–H2 interactions and on the phonon spectrum have been reported.[Reference Tozzini and Pellegrini13, Reference Lee, Yoon and Cheong14] It is expected to affect graphene–Li, Na interactions, but to what extent is unknown. Li storage in a related system, carbon nanotubes (CNT), has been extensively studied, and the effect of curvature on adsorption and diffusion was identified.[Reference Khantha, Cordero, Alonso, Cawkwell and Girifalco15, Reference Landi, Ganter, Cress, DiLeo and Raffaelle16] To the best of our knowledge, there are no calculations of the effects of curvature on the energetics of Li and Na storage and on Li and Na diffusion on graphene. Here, we therefore present a comparative ab initio study of adsorption and surface diffusion of Li and Na on planar and buckled (curved) graphene.
Methods
Structures and electronic structures of graphene and graphene–Li, Na were computed using density functional theory[Reference Kohn and Sham17] with the PBE functional,[Reference Perdew, Burke and Ernzerhoff18] as implemented in the SIESTA code.[Reference Soler, Artacho, Dale, Garcia, Junquera, Ordejon and Sanchez-Portal19] The DZP (double-ζ polarized) basis set and Troullier–Martins pseudopotentials[Reference Troullier and Martins20] were used. Planar graphene was modeled by a rectangular sheet of size ~32.26 × 12.91 Å (x and y direction, respectively) containing 156 atoms, with periodic boundary conditions. Repeating sheets were separated by 20 Å of vacuum along the z-direction. The Brillouin zone was sampled with a 1 × 2 × 1 k-point grid. We verified that this converged the adsorption energies to within 0.01 eV. Geometries were optimized until forces on the non-fixed degrees of freedom were below 0.025 eV/Å. The computed C–C bond length of 1.43 Å is in excellent agreement with previous reports.[Reference Kattel, Atanassov and Kiefer21–Reference Rajesh, Majumder, Mizuseki and Kawazoe23] Curved graphene was obtained by imposing a sinusoidal shape along the x-direction and re-optimizing with a fixed simulation cell. Two curvatures were used in the calculations below, corresponding to the sheet's contraction to 65 and 84% in the x direction relative to the planar sheet's size (these are referred to below as “65(84)% sheet”). The resulting shapes are shown in Fig. 1. Adsorption energies of Li and Na atoms were computed as E ads = E graphene+Li,Na − (E graphene + E Li,Na), where E graphene+Li,Na is the total energy of the adsorbed system at the optimal geometry, E graphene is the energy of the corresponding graphene sheet, and E Li,Na is the energy of an isolated Li or a Na atom (in the same supercell). E ads were corrected for BSSE (basis set superposition errors) by applying the counterpoise correction.[Reference Boys and Bernardi24] Spin polarization was tried but was found to have a negligible effect.
The graphene sheets used in this study: planar (cyan), and curved corresponding to contraction to 65% (brown) and 84% (blue) of the size of the planar sheet in the x direction. Coordinate axes: x – red, y – green, and z – blue. Visualization by VMD.[30]

Scans of the potential energy surfaces (PES) of Li, Na over the graphene sheets with a resolution of 0.2 Å were obtained by fixing the x and y coordinates of the metal and relaxing its z coordinate as well as all C atoms. The rectangular (2.4 × 2.3 Å) area of the scan included the minimum energy hollow (H) adsorption site at the point of maximum curvature (see Figs. 2 and 3 and Supplementary Information). The metal atom can diffuse either along the direction of maximum, minimum, or intermediate curvature into nearby H sites (Fig. 2) included in the scan. We focus here on the H–B (bridge)–H diffusion paths crossing the C–C bond, which are energetically favored and pass through well-defined saddle points (see Fig. 3 and Supplementary Information). Diffusion barrier heights were found from saddle points located with a resolution of 0.001 eV on the PES obtained from the discrete scan with a cubic spline interpolation. We have confirmed that these barrier heights are within 0.002 eV from those computed by constrained optimization, where the coordinate most aligned with the diffusion path (x or y) of the metal atom was stepped with a step size of 0.075 Å (see Supplementary Information). All other coordinates were relaxed at each step except for the coordinates of the C atom farthest from the metal atom, which was also fixed to prevent system drift.
Adsorption geometry (red) and H–B–H diffusion pathways (pink) of a Li atom on graphene (cyan, 65% contraction). The equilibrium positions and pathways are qualitatively similar for all systems listed in Table I.
Potential energy surfaces for Li (left) and Na (right) on planar (top) and curved (bottom, 65% sheet, adsorption on the convex side) graphene. dX and dY are Cartesian displacements from the hollow adsorption site at the point of maximum curvature. X is the direction of maximum curvature, see Figs. 1–2. Isovalues are in eV with 0 corresponding to the H site at the point of maximum curvature. See Supplementary Information for more detailed graphs of all systems.
Results and discussion
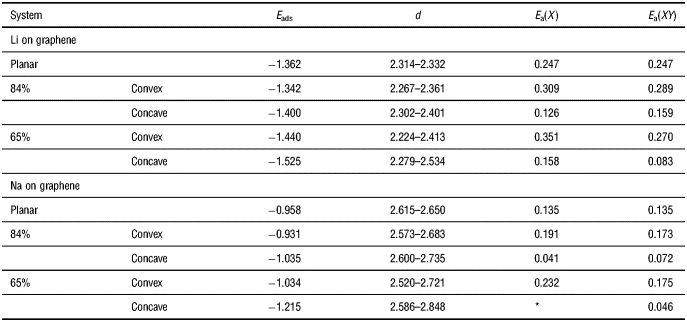
Both Li and Na prefer to adsorb on the hollow site directly above the center of a hexagon formed by C atoms, for all graphene sheets. For example, the optimized geometry of Li adsorbed on the 65% sheet is shown in Fig. 2. In Table I, we list adsorption energies for atoms adsorbed at the point of maximum curvature on the concave or convex side of the graphene sheet. The numbers for the planar sheet are in agreement with previous calculations.[Reference Zhou, Hou and Wu5, Reference Choi and Jhi25–Reference Khantha, Cordero, Molina, Alonso and Girifalco27] We note that sodium has weaker adsorption and a larger equilibrium separation from graphene by about 0.3 Å.
Adsorption energies E ads (eV), range of distances to the C atoms of the nearest hexagon d (Å), and diffusion barriers E a (eV) for the two pathways shown in Fig. 2 for Li and Na atoms adsorbed on graphene sheets of different curvatures (identified as % length versus the planar sheet).
*No saddle point was identified.
Adsorbed metal atoms donate charge to the graphene substrate. Plots of charge density differences Δρ = ρ graphene+Li,Na–(ρ graphene + ρ Li,Na) for all systems are shown in the Supplementary Information. An example for Li on the planar sheet is shown in Fig. 4. Charge transfer was estimated by integrating |Δρ|/2. This resulting charge transfer of 0.77 and 0.83 e for Li and Na on planar graphene, respectively, is in good agreement with previous works[Reference Fan, Zheng and Kuo4, Reference Zhou, Hou and Wu5, Reference Khantha, Cordero, Molina, Alonso and Girifalco27, Reference Jalbout, Ortiz and Seligman28] and with the lower ionization potential of Na than of Li. Curvature slightly reduced the extent of charge transfer, by up to 0.07 e for the 65% sheet.
Charge density difference for Li on planar graphene. Depletion regions are in pink and areas of increased density in blue. For comparison, the charge density of a free Li atom at the same isovalue (of 0.001 e/Å3) is shown as a blue ball.
The H–B–H diffusion paths, similar for all systems, are shown in Fig. 2. These paths include a path along the direction of maximum curvature, i.e. along x (referred to in the following as path X with barrier E a(X)) or at an angle to it (referred to in the following as path XY with barrier E a(XY)). Figure 3 shows the potential energy surfaces for Li and Na atoms on the planar and 65% sheets. All other PES plots are given in the Supplementary Information. The corresponding barrier heights are listed in Table I. On the planar graphene, the paths X and XY are equivalent, and the diffusion barrier between the hollow sites for Li is 0.25 eV, in general agreement with previous works, where values of 0.28–0.33 were reported.[Reference Fan, Zheng and Kuo4–Reference Uthaisar and Barone6] We note that we used a much larger graphene sheet (less adatom–adatom interaction) than in the previous works.[Reference Fan, Zheng and Kuo4–Reference Uthaisar and Barone6] The barrier for Na diffusion on planar graphene is 0.14 eV, about 0.1 eV lower than that of Li, and in agreement with a previous estimate of 0.13 eV.[Reference Soler, Artacho, Dale, Garcia, Junquera, Ordejon and Sanchez-Portal19, Reference Troullier and Martins20] This is contrary to most bulk materials, where Na diffusion is much more difficult compared to Li.[Reference Malyi, Tan and Manzhos29]
Curvature significantly changes both the adsorption energetics and the diffusion dynamics. The difference in adsorption energy of atoms on the concave and convex sides reaches 0.08 eV for Li – comparable to differences in E ads computed for Li on the inside and outside of a CNT of comparable curvature.[Reference Khantha, Cordero, Alonso, Cawkwell and Girifalco15] For Na, the difference is much larger at 0.18 eV. Significant diffusion anisotropy is introduced with differences in diffusion barriers between the path X and XY reaching up to 0.08 eV for the same system. This is significant, as it is expected to lead to an order of magnitude change in the diffusion rate given its dependence on exp(−E a/kT), where kT is about 0.026 eV at room temperature. Secondly, the diffusion barrier is different for metal atoms adsorbed on the concave or convex side of the graphene surface, the difference reaching about 0.2 eV (or two orders of magnitude in diffusion rate) for the 65% sheet. Interestingly, the sign of the change in barrier height E a vs. planar graphene is different for the convex and the concave sides, although on both sides of the 65% sheet (strongest curvature), the adsorption is clearly stronger than on planar graphene, see Table I.
Diffusion on the convex side of curved graphene becomes progressively more impeded as the extent of the curvature is increased: for Li, the barrier changes from 0.25 to 0.31 to 0.35 eV when going from planar to 84 to 65% sheet; for Na, the change is from 0.14 to 0.19 to 0.23 eV. The maximum change is therefore similar for Li than for Na, reaching about 0.1 eV. The curvature therefore increases the barrier for Na by about 2/3. The barrier for the XY pathway changes less, as expected, but still increases by more than kT. On the concave side, on the contrary, accelerated surface diffusion is expected, and for both Li and Na, the maximum barrier reduction (on the 65% sheet) is of the order of 0.1 eV (Table I). On this side of the sheet, the reduction of the barrier of the XY path is almost as significant as of that of the X path. This compares well to low barriers previously reported for Li inside CNT.[Reference Khantha, Cordero, Alonso, Cawkwell and Girifalco15] Specifically, the XY path with the barrier of <0.1 eV (on the 65% sheet) corresponds to the preferred heliodal path of Li inside CNT.[Reference Khantha, Cordero, Alonso, Cawkwell and Girifalco15]
Conclusions
Curvature of graphene significantly changes its Li and Na storage properties. Changes in the diffusion barrier of the order of 0.1 eV between the planar and buckled (contracted to 65% of the original length) sheet, and of 0.2 eV between atoms adsorbed on concave and convex sides, are expected to lead to differences in the diffusion coefficient of one to two orders of magnitude at room temperature: accelerated diffusion on the concave side and anisotropically impeded on the convex side. Owing to the exponential dependence of rate on E a, these effects do not cancel out and are expected to lead to a higher average diffusion rate. It is therefore imperative to consider curvature when modeling graphene-based electrodes. In all cases, the barrier for Na diffusion is about 0.1 eV lower than that for Li.
Supplementary materials
For supplementary material for this article, please visit http://dx.doi.org/10.1557/mrc.2013.24
Acknowledgments
This work was supported by Tier 1 AcRF grant (R-265-000-430-133) of the Ministry of Education of Singapore.