1. Introduction
During the last few years, the oil market has witnessed substantial price volatility as well as historically high prices for crude oil and the major light products. In July 2008, oil prices struck an all-time record high above $144 a barrel, seven times higher than the $19.70 a barrel recorded in December 2001. In real terms, oil was at that time the most expensive it had ever been. Analysts have pointed out that higher oil prices are inevitable and that it is unlikely that prices will fall in the long term without major discoveries of oil or alternative energy sources. Moreover, calls for the government to shield the poor and some crucial sectors are not uncommon with increasing oil prices.
South Africa has high levels of income inequality, among the highest in the world. This is mainly due to discriminatory practices during the apartheid era that served to bring about a racial divide in wage earnings. Although there is disagreement over the changes that have occurred in poverty since the attainment of democracy, there is some agreement about the factors that lead to poverty. Poverty and welfare have been shown to be closely associated with race, with poor Black Africans accounting for the overwhelming majority of the poor (the terms used for the different races are consistent with those in common use and employed by the national census, and do not imply acceptance of racial attributes). There is also a regional dimension to poverty in the country, with the incidence of poverty in rural areas being much higher than in non-rural regions.
There is a strong relationship between employment and poverty. The unemployment rate for those from poor households is higher than the national average, while the labour force participation is much lower for poor compared to non-poor households (Leibbrandt and Woolard, Reference Leibbrandt and Woolard2001). Access to wage income is also an important contributor to poverty, with poor households generally characterized by a lack of earnings, partly due to unemployment among household heads and partly due to the poor pay for the work they secure, usually in the domestic and agriculture sectors.
On the other hand, government management of the higher oil prices will have significant repercussions on the economy, on households’ expenditure and welfare. Because oil is such a basic component of manufacturing, floatation of oil prices will directly affect the whole economy, income distribution and poverty reduction. Removal of oil price subsidies will impact on oil-dependent businesses because their costs will increase substantially. Higher oil prices due to reduction and elimination of the use of subsidies will lower oil consumption in favour of other sources of energy (e.g., coal) which are known to be more damaging for the environment. Subsidising oil prices, even if it might be beneficial to competitiveness and the whole economy, raises the risk of increasing the trade deficit through an increase in oil imports. This may cause an increase of the real exchange rate, thereby lowering consumption. Consequently, higher inflation will ultimately pressure the government to increase interest rates, thereby reducing short-term investments and restricting future economic growth. The method that government will use to finance subsidies has important policy relevance. If the subsidy is financed by different taxes, these would have differing effects on the economy and households. Thus, it is important to investigate various options.
Economists have used a variety of methods to analyse the extent and magnitude of oil price-induced shocks, adjustment policies and the effects of such policies on economic growth and income distribution in developing countries. Mitra (Reference Mitra1994) explores different adjustment scenarios in oil-importing developing countries to cope with the 1973/1974 and 1978/1979 oil-price shocks. The analysis uses three types of approach in examining the behaviour of the countries. A descriptive approach classifies 33 countries according to the extent of the shocks, the policies pursued and the success of the subsequent adjustment. Partial-equilibrium models for Kenya and computable general-equilibrium (CGE) models for Turkey, Thailand, Kenya and India enable counterfactual and alternative policy response experiments.
Using South Africa as an example, this paper follows the CGE approach in Mitra (Reference Mitra1994) combined with a micro-simulation model to address the problem of how an oil-importing developing country can cope with oil price shocks. The micro-simulation model permits a detailed analysis of effects by socio-demographic characteristics of the people affected. Effects are differentiated according to several scenarios concerning the government's response to the oil price shock. The CGE and micro modules are linked in a top-down fashion. The value added of the work carried out in this paper lies in the explicit poverty modelling accomplished through the use of micro-simulation techniques linked to a CGE model. There is no parallel work in South Africa and indeed in the rest of Africa that we are aware of that has applied this technique to analysis of oil price shocks.
The rest of this paper is divided into four sections. Section 2 describes the model framework used while section 3 presents the simulation scenarios. Section 4 presents and discusses the results while section 5 concludes the paper.
2. The model
The study uses an energy-focused CGE model linked to a micro-simulation household model of South Africa. The core of the constructed CGE model is based on the neoclassical general-equilibrium theory and also builds on the energy CGE models found in the literature (Manne, Reference Manne1977; Bergman, Reference Bergman1990; Hazilla and Kopp, Reference Hazilla and Kopp1990; van der Mensbrugghe, Reference van der Mensbrugghe1994; Bergman and Henrekson, Reference Bergman and Henrekson2003; Busollo et al., Reference Bussolo, Chemingui and O'Connor2003). CGE models are widely used for the evaluation of policies related to energy and carbon dioxide emission; a survey by Bergman and Henrekson (Reference Bergman and Henrekson2003) highlights their usefulness in environment and resource management modelling. However, the model accounts for only two representative household categories – urban and rural – limiting its usefulness for income distribution and poverty impact analysis of oil crises, as indicators used for the analysis of poverty and inequality generally use household or individual level data. Therefore, micro-simulation modelling is essential in order to reconcile the use of macro-models with distributional impact analysis.
2.1. The core model
The core of the constructed model is based on the neoclassical general equilibrium theory. It collapses a whole economy into three major parts: the supply of goods and servicesFootnote 1 which includes production and trade activities; the demand of goods and services by institutional unitsFootnote 2; and the institutional constraints. The model then builds equations meant to capture the behaviour and interaction among the three components.
Producers maximize their profit under a given technology and independent prices. Industry-specific producers are modelled as representative producers which have a nested constant elasticity of substitution (CES) production technology. The relationship between the rest of the world and the domestic economy is determined by substitutability between imported and domestic goods on the consumption side (Armington assumption), and by substitutability between the domestic and international markets on the production side. The relative prices of foreign goods – defined by international fixed prices (small country hypothesis), the exchange rate and government interventions (taxes, subsidies and tariffs) – determine the allocation of supply and demand between domestic and international markets.
Households’ behaviour is rational, which implies that, in the presence of complete markets, there is a separation between their production and consumption decisions (separability hypothesis). Households maximize utility under limited budgets and given markets. They are modelled as representative agents that are assumed to have Stone–Geary type of preferences. Households, firms and government have fixed endowment of factors according to the short-run perspective of the analysis.
All commodity markets follow the neoclassical market-clearing price system, in which jointly determined producer and consumer prices vary only by given tax, subsidy and margins rates. The labour market is assumed to be fully segmented by skill (high, medium and low) categories, gender (male and female) and geographical location (urban and rural). High-skilled workers are fully employed in the economy although low rates of frictional unemploymentFootnote 3 are observed in urban and rural areas for this category. High-skilled labour markets are assumed to be perfectly competitive so that the prevailing wage rates equalize exogenous supplies and endogenous demands. In contrast, the medium- and low-skilled labour markets are driven by the demand side with an unconstrained supply side represented by fixed wage rates.Footnote 4 The employment and wage rates in general public administration are exogenously determined. Capital demand is industry specific and there are as many returns to capital as industries in the economy. There is no return to capital in general government services. Instead, the government supports the cost of using such capital.
The other structural features specified by the model are related to the current account balance, fiscal policy and saving-investment rule. The current account balance is exogenous and equilibrates via adjustments of the real exchange rate. The simulations are performed under a rigidity of government current expenditures and neutrality in its revenues through an integration of a compensatory tax/subsidy on households’ income at a uniform rate. This closure rule is motivated by the absence of explicit modelling of the macro and distributional effects of changes in government spending. Private savings are investment driven, i.e., investment is fixed at its base year level and households’ savings are forced to adjust to investment through an endogenous marginal propensity to save. In a comparative static context, this means that the costs of the oil price increases and government interventions are not passed on to the future. The ‘numeraire’ is the exchange rate. All values are thus measured relative to the price of internationally traded goods.
2.2. The energy specificities of the model
The model has four types of energy products, which are crude oil, petroleum products, coal and electricity.Footnote 5 Crude oil is exclusively imported, that is, there is no local production (hence no corresponding domestic industry) for this product. Petroleum products are supplied by oil refineries and synthetic fuel industries. The products supplied by the two types of industries are perfect substitutes.Footnote 6 Coal and electricity are supplied by coal and electricity industries. Therefore, the model also shows four types of energy industries (synthetic fuel, refined oil fuel, coal and electricity). The model differs from standard CGE models in three other main aspects: the energy supply and demand specification; the price setting method in the domestic oil market; and the consumption decision making process.
An industry's technology is presented as a nested CES function. The gross output consists of a Leontief function of the composite value added-energy and the non-energy input consumption. Leontief technology also determines the demand for non-energy commodities in the total non-energy input consumption. A CES function aggregates a composite of medium- to low-skilled labour and the bundle of capital-energy and high-skilled labour in the value added-energy composite, with a high elasticity of substitution. The bundle of capital-energy and high-skilled labour is also a CES aggregation of capital-energy and high-skilled labour. However, the latter has a low elasticity of substitution. A fixed proportional (Leontief) relationship is defined between medium- and low-skilled workers as well as between urban and rural workers for all skilled categories. Finally, a unitary elasticity of substitution (Cobb–Douglas) aggregates male and female workers for all skilled categories and geographical locations. A CES function with a low elasticity demonstrates that capital and energy imperfectly substitute for each other (quasi-complementary) in the composite capital-energy.
The four types of energy are imperfect substitutes of each other. Composite fuels and electricity are combined in a CES function with a relatively low elasticity of substitution, i.e., it is not easy for industries to adopt a better energy efficiency technology according to the short-run perspective of the study. The former is defined as a CES-aggregate of coal and oil fuels, also with a relatively low elasticity of substitution between them. Finally, crude oil and refined oil products are assumed to be complements in the oil bundle. The demand for each energy commodity is shared between imports and domestically produced goods depending on their relative prices and assuming a high degree of substitutability between them.
To implement the oil price support policy, the government guarantees a selling price to oil consumers. In a market-clearing context, there is zero excess supply so that the equilibrium price adjusts supply and demand. Therefore, the government provides a price policy support to oil consumers, but it is still willing to let the market adjust to the market-clearing price. In that case, the price paid by oil consumers is exogenous, whereas the level of government subsidy is endogenously determined, depending on the fluctuation of international oil prices. The government will then have to arrange some method of financing the implied extra expenses.
The goods and services consumed by households are grouped into 13 groups of consumption by purpose as follows: food, personal care, fuel, clothing and footwear, furniture and equipment, health, transport, computer and telecommunication, education, recreation, entertainment and sport, miscellaneous expenditure, and housing. A single commodity category (e.g., petroleum product) enters into one or several groups of consumption by purpose (e.g., household fuel and transport). Representative urban and rural households maximize unitary utility functions over the group of consumption by purpose, subject to the constraint of their income. Thus, households’ expenditure on commodities combine a Linear Expenditure System function over various groups of consumption by purpose, and a Cobb–Douglas function over commodity categories for each group of consumption by purpose.
2.3. The micro-simulation module
The study uses a two-layered macro-micro technique to analyse the income distribution and poverty impacts of alternative policy responses to high oil prices. The macro and micro modules are linked in a top-down fashion which does not account for the feedback (second-order) effects from the micro component to the macro component of the model. Therefore, one should interpret the results as a first-round (prices and quantities) distributive impact analysis of the oil shocks.
The micro-simulation model developed follows Ravallion and Lokshin (Reference Ravallion and Lokshin2004) and Ganuza et al. (Reference Ganuza, Paes de Barros, Vos, Vos, Taylor and Paes de Barros2002) among the wide range of possible models presented by Bourguignon et al. (Reference Bourguignon, Bussolo and Pereira da Silva2008) in accounting for both prices and the reallocation effects of shocks. It takes CGE results on the employment and unemployment variables and on the return to factors as inputs. For each of the 12 segments of the labour market, the changes in employment or unemployment variables obtained from the CGE model are imposed onto the individuals in the survey. Unemployed individuals are randomly selected to join the pool of employees in a situation where employment increases. In the opposite case, we randomly select individuals remaining employed when retrenchment occurs. The selection process is repeated a large number of times to allow for the determination of confidence intervals of poverty indicators. Changes in wage rates are applied to salary and wage workers; the latter are aggregated to the real households level. Business and transfer earnings are also adjusted by changes in return to capital and in the average economy-wide price, respectively, obtained from the CGE model. Households’ earnings, that is, wage, profit, and transfer, are computed and used for measurement of counterfactual income poverty indicators after being deflated by urban and rural consumer price indexes generated from the macro analysis.
Individual regular incomes are drawn from the 2000 Income and Expenditure Survey (IES) and the September 2000 Labour Force Survey (LFS) both published by Statistics South Africa. Data on individuals’ (and thus households’) regular income, that is, salaries and wages, profits and net incomes, and transfer receipts, are generated from the IES. Time spent by individuals on market activities, that is, salary and wage work, self-employment work and unemployment, and many other pieces of information related to the employment status of individuals are missing from the IES 2000. Therefore, the latter is completed by information from the LFS 2000. The 18 sources of income from the IES are grouped into three categories according to the main source of income in the CGE model. Household earnings sum up the regular incomes generated by its members. There are 389 occupational groups aggregated into three skill levels using the Statistics South Africa classification in the 1998 Social Accounting Matrix (SAM).
A standard Mincerian wage regression imputes wages to unemployed and inactive individuals. Log wages are regressed on education and age (proxy of the experience), controlling for gender, employment status (full or part time), marital status and, finally, the presence of children under seven years old.Footnote 7
A distinct advantage of the approach used here, that of accounting for all households in a survey, is that we are able to translate the policy effects to national poverty effects. We use the existing poverty lines (Hoogeveen and Ozler, Reference Hoogeveen and Özler2004) for South Africa to calculate various poverty indices that help to characterize poverty. The base year households’ regular incomes and income poverty indicators are computed. The Foster, Greer and Thorbecke measures of poverty are used.
3. The simulation scenarios
The study experiments with a sustained increase of import and export prices of crude oil and refined petroleum products under alternative government policy responses. It simulates a US$ 10 increase in import prices of crude oil. The shock translates into a 50 per cent increase of the cost of crude oil as compared to its (average) level in 2000. A simultaneous increase – but by a smaller amount of 25 per cent – of the import and export prices of refined petroleum products is also simulated. The analysis should be taken as giving a short-term perspective of the impact of recent oil price shocks.
Altogether three scenarios are run. The first scenario assumes that the increase in prices of crude oil and petroleum products imported by South Africa is fully transmitted to end users through an increase of the purchasing prices. This is the current intervention of the government in the oil market which we assume is maintained. This scenario is referred to as the ‘floating-price scenario’. The alternative scenarios suppose that the government is willing to intervene and compensate for the increase of the consumption prices of petroleum products in order to protect consumers and producers. Thus, it decides to compensate fully the increase through the price-subsidy mechanism. The purchasing prices of petroleum products are kept exogenous and the government fully compensates for an increase in their prices in sub-scenario 1 (setting 1). In sub-scenario 2 (setting 2), the price-subsidy mechanism is combined with a 50 per cent tax on the profits of the synthetic petroleum industry (a form of windfall tax). The financing of the subsidy is the mirror image to the utilization of an additional revenue from an environmental tax, which was found important in the literature on environmental tax reforms (see, e.g., Welsch, Reference Welsch1996). These scenarios are referred to as the ‘price-setting scenarios’. It is worthwhile to reiterate that synthetic petroleum is a substitute for imported fuel.
The idea of a windfall tax was first floated in South Africa in the October 2005 medium-term budget policy statement by the then Finance Minister Trevor Manuel. Of course the calls for a windfall tax were somewhat dampened when the oil price spike took a dive and the related windfall profits took a correlating downturn. But over recent months there has been a growing body of evidence that could suggest a windfall tax may be back on the cards. Oil prices peaked at almost $150, then tumbled to under $40 a barrel and recently jumped to above $100, bringing back to the forefront the windfall debate. With conventional tax sources battered by the global economic recession, windfall taxes could produce a marked revenue enhancement that the government desperately needs. Further impetus has been provided by the proposed Australian tax on windfall mining profits, referred to as the Resources Super Profit Tax, which is hoped to help the government there recover from the global financial crisis. The IMF has expressed support for the proposal, arguing that resource rent taxes give mineral-rich countries brighter prospects of repairing crisis-battered budget balance sheets. The issue of subsidies as modelled is another policy option – the whole host of social grants transfer making up as much as 3.5 per cent of GDP in the country does suggest that there is a huge appetite for cushioning households from negative exogenous shocks to the economy.
In all scenarios, in order to maintain government revenue neutrality, a tax on household incomes at a uniform rate to compensate for government extra expenses is instituted. The compensatory tax has to be interpreted as the current cost of maintaining unchanged the future welfare effects of government expenses and investment to improve households’ living standards. In other words, it cancels out the inter-temporal free lunch situation.
4. Results and discussion
Recent oil price increases are likely to have significant economic and social impacts in South Africa due to the country's dependency on imported oil, notably crude oil. Moreover, the government's management of high oil prices could contribute to exacerbating its impact as well as the distributional effects among households and individuals.
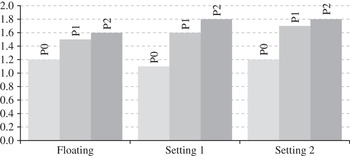
A sustained US$ 10 increase in the import prices of crude oil fully transmitted to consumers leads to an increase of the poverty headcount (P0) by 1.2 per cent in South Africa (figure 1). This is equivalent to 270,000 additional individuals falling below the poverty line of Rands 322 per month. Further, the amount of money needed to bring poor people to the poverty line, i.e., the poverty gap (P1), increases by 1.5 per cent, indicating a decline in the living standards of the poor. It is also shown that the poorest suffer the most as seen in the increase of 1.6 per cent of the poverty severity (P2). Poverty also increases in the price-setting scenarios (Setting 1 and Setting 2) and the changes in poverty gap and severity are slightly higher compared to the results for the floating-price case (floating) (figure 1).
Comparison of the change in poverty indexes (%)

Higher prices of crude oil and petroleum products increase the import bill as the fall in the imported quantities is less than the increase in prices, that is, demand is inelastic with respect to the price. Economic agents face constraints on their budgets, in the sense that there is no spare revenue to spend, and on external borrowing. Therefore, the higher cost of imported oil and petroleum products leads to an increase of the country's external spending at the expense of its internal spending. As a result, the demand for domestically produced goods contracts and their prices fall.
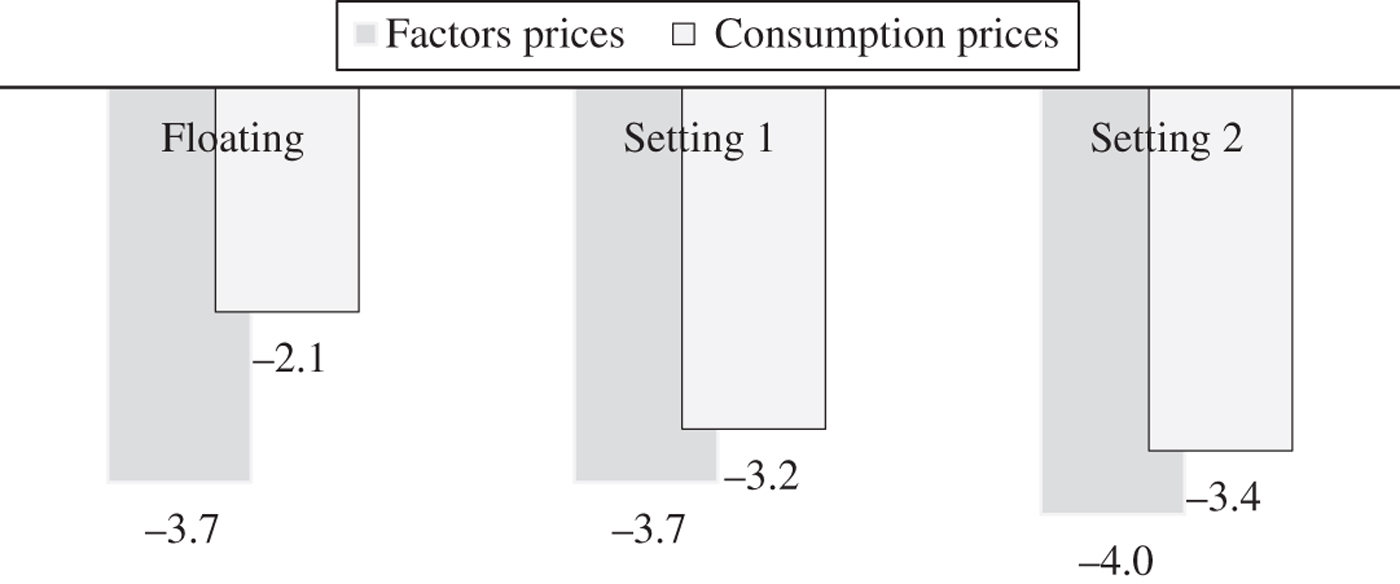
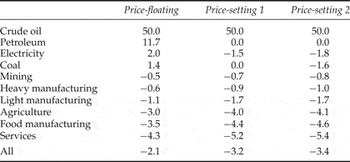
On the one hand, the fall in domestic prices reduces business profits, employment and wages. As a consequence, domestic income falls and hence the measures of poverty tend to rise. On the other hand, declining domestic prices contribute to increasing households’ purchasing power and tend to reduce poverty. However, the prices of commodities purchased by households are weighted averages of domestic and import prices, where the weight is the share of domestic-produced and imported commodities in total demand. Prices of non-oil imported products are kept constant when simulating increases in prices of imported oil and petroleum products. Therefore, the declines in prices of traded goods and services are less important than the declines in prices of non-traded products. Since productive factors are being less traded than consumption products,Footnote 8 their real prices fall (figure 2) and tend to increase poverty measures (figure 1).
Change in average factors and consumption prices (%)
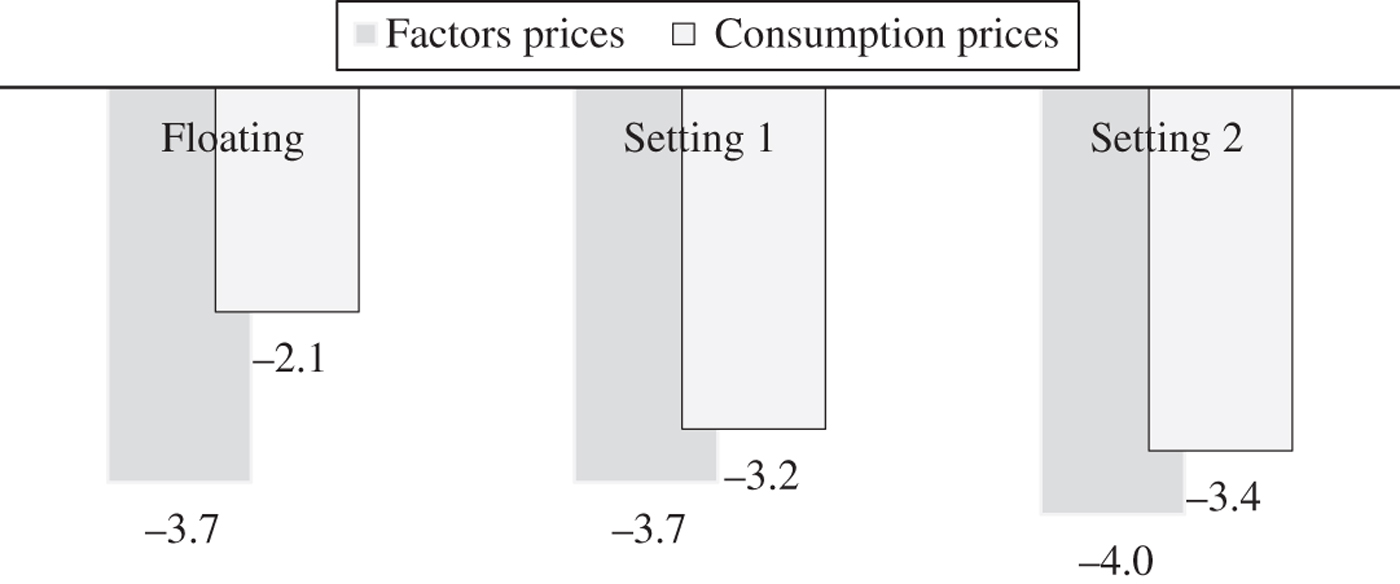
As the prices of petroleum products remain constant, consumer prices fall more in the price-setting scenarios compared to the price-floating scenario (figure 2). The shares of petroleum products in households’ expenses reveal that the price support setting policy is expected to benefit poor as well as rich households (see Fofana et al., Reference Fofana, Chitiga and Mabugu2009). Thus, we would have expected poverty indexes to fall more in the price-setting scenarios as compared to the price-floating scenario. Poverty measures do not fall in price-setting scenarios as expected, because of the adverse effect of the financing method used to compensate for the extra spending generated by government policy.
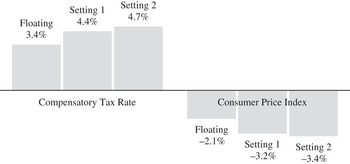
The simulations are run under a rigidity of government current expenditures. Thus, a compensatory tax/subsidy on household income and wealth is integrated at a uniform rate to finance government current and extra expenses. The compensatory tax rates are endogenously determined at 4.4 and 4.7 per cent of the household gross income in the price-setting 1 and 2 scenarios, respectively, and are higher by 1.0 and 1.3 percentage points compared to the price-floating scenario (figure 3). The changes in the compensatory tax rates are close to the changes in consumer price indexes between the price-floating scenario and the price-setting scenarios (figure 3). The small changes in the poverty indexes among scenarios are due to the quasi-uniform structure of petroleum expenses and the uniform rate of compensatory tax among the households’ income categories.
Changes in compensatory tax rate and consumer price index under various scenarios

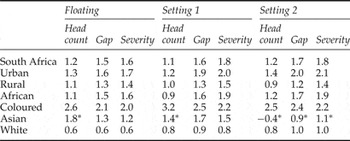
We now turn to a more in-depth discussion of the poverty and distributional impacts of high oil prices. We have seen that the increase of import prices of crude oil and petroleum products leads to an increase in national poverty. Poverty increases more in urban than rural areas in the price-floating and price-setting scenarios (table 1). The changes in poverty gap and severity are slightly higher in the price-setting than the price-floating scenarios. Furthermore, in the case of a tax on windfall profits, the poverty results are worsened and the urban–rural gap increases.
Comparison of the change in poverty indexes among households groups (%)

Note: *Value not significant at 95% degree of confidence.
Source: Authors’ calculations from the simulation results.
Poverty indexes increase more among Coloured and Black households groups than the White households group (table 1). Poverty measures also increase among the Asian households group but are not statistically significant. Poverty results worsen in the price-setting scenario without a tax on windfall profits (sub-scenario 1); and also as the gap between the Coloured and White groups increases. In the case of a tax on windfall profits, poverty results increase but moderately and the gap between population groups narrows as compared to the price-setting sub-scenario 1.
The poverty and distributional impacts of the recent oil prices shock is analysed through the price and reallocation effects, as well as the endowment effects. The price and reallocation effects focus on the changes in the prices of resources purchased and sold in the economy, as well as labour employment effects, while capital is assumed to be sector specific. The availability of resources is also fixed given the short-run perspective of the analysis. Hence, the endowment issue focuses on the distribution of the available resources among actors. A deeper analysis of these effects provides a better understanding of the poverty and distributional impact of high oil prices in South Africa.
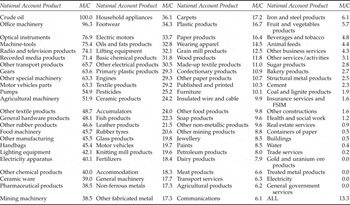
High oil and oil products prices modify commodity prices and factor returns in net oil-importing countries such as South Africa. Domestic prices fall for most of the commodities, in particular for the low import-substituting commodities. Private services, manufactured foods, and agriculture products are over-represented among the low import-substituting commodities (table 2). This situation leads to a greater decline in their average purchasing prices (table 3).Footnote 9 In contrast, average purchasing prices increase for energy products and high-intensive energy input use products, i.e., crude oil, petroleum, electricity and coal (table 3).
Import-to-consumption ratio for the 95 National Account Products (%)

Notes: M, import; C, consumption
Source: South African National Accounts for year 2000.
Percentage change in average purchasing price for aggregate products

Source: Authors’ calculations from the simulation results.
In the price-setting scenarios, the purchasing price of petroleum products remains constant and does not lead to a greater substitution with petroleum substituting products such as electricity and coal, whose prices fall relative to the floating price scenario. Production and value added of synthetic fuel fall more under the windfall tax scenario. As a consequence, the synthetic fuel industry uses less coal input which contributes to lowering the price of coal. Also, domestic prices fall more in the case of price-setting scenarios leading to greater decline in the prices of services, manufactured food, and agriculture products.
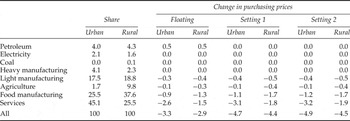
Changes in product-specific prices and households’ purchasing prices are assessed at the macro level and transmitted to the households at the micro level through the changes in the urban and rural consumer price indexes. The purchasing prices fall slightly more for urban households as their average share of services – the low import-oriented commodities – in consumption expenses is higher (table 4). Consumption price effects do not change significantly across the three scenarios as the changes in households’ price indexes are mainly driven by the services, manufactured goods and agriculture products, representing roughly 72 per cent of urban and rural households’ expenses (table 4). The prices of these products change roughly in the same proportion across the three scenarios (table 3).
Change in households’ average purchasing price index (%)

Source: South African SAM for year 2000 and authors’ calculations from the simulation results.
The changes in factor prices and factor reallocations are strongly related to the distributional impacts among industries. Workers in general government services are sector specific and receive fixed real wage rates, i.e., indexed to the changes in average consumer price. Workers in private industries are mobile with wage rates equalizing across industries for high-skilled labourers, and employment opportunities changing for medium- and low-skilled labourers.
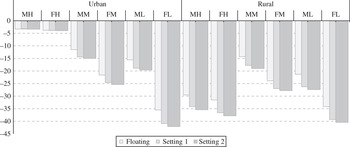
In both rural and urban areas, the increase of oil prices reduces the expected wage rates, i.e., the nominal wage rates adjusted by the unemployment rates (figure 4). The increased imported oil bill, while contributing to a further decline in domestic demand, also reduces more the expected wage rates in the price-setting scenarios compared to the floating scenario. The decline in the expected wage rates (figure 4) is greater than that of the purchasing prices (table 3) so that the expected real wage rates fall more in the price-setting than the price-floating scenarios.
Percentage changes in wage rates
Notes: MH, male high-skilled; FH, female high-skilled; MM, male medium-skilled; FM, female medium-skilled; ML, male low-skilled; FL, female low-skilled workers.

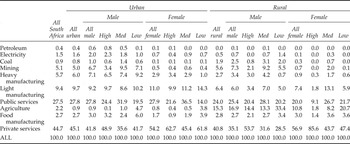
In general, low-skilled workers record a greater decline in their expected wage rates compared to their medium- and high-skilled counterparts. Oil price increases hit more rural than urban workers, and more female than male workers. Low-skilled, rural and female workers are penalized by the higher dependency on services, food manufacturing and agriculture industries (table 5) which record a greater decline in their prices (table 3) and, to some extent, their lower involvement in the energy industries for which prices have increased significantly.
Structure of employment by sector (%)

Source: South African SAM for year 2000.
Although factors’ prices and reallocations effects determine to a large extent the poverty and distributional effects of high oil prices in South Africa, the analysis needs to be completed by an understanding of the endowment effects. Endowments are assumed given according to the short-run perspective of the analysis. Therefore, the supply of various labour and capital types are considered fixed at their baseline levels both for the macro and micro analysis. Therefore, only the initial income structure is of interest in understanding the impact of high oil prices on poverty measures.
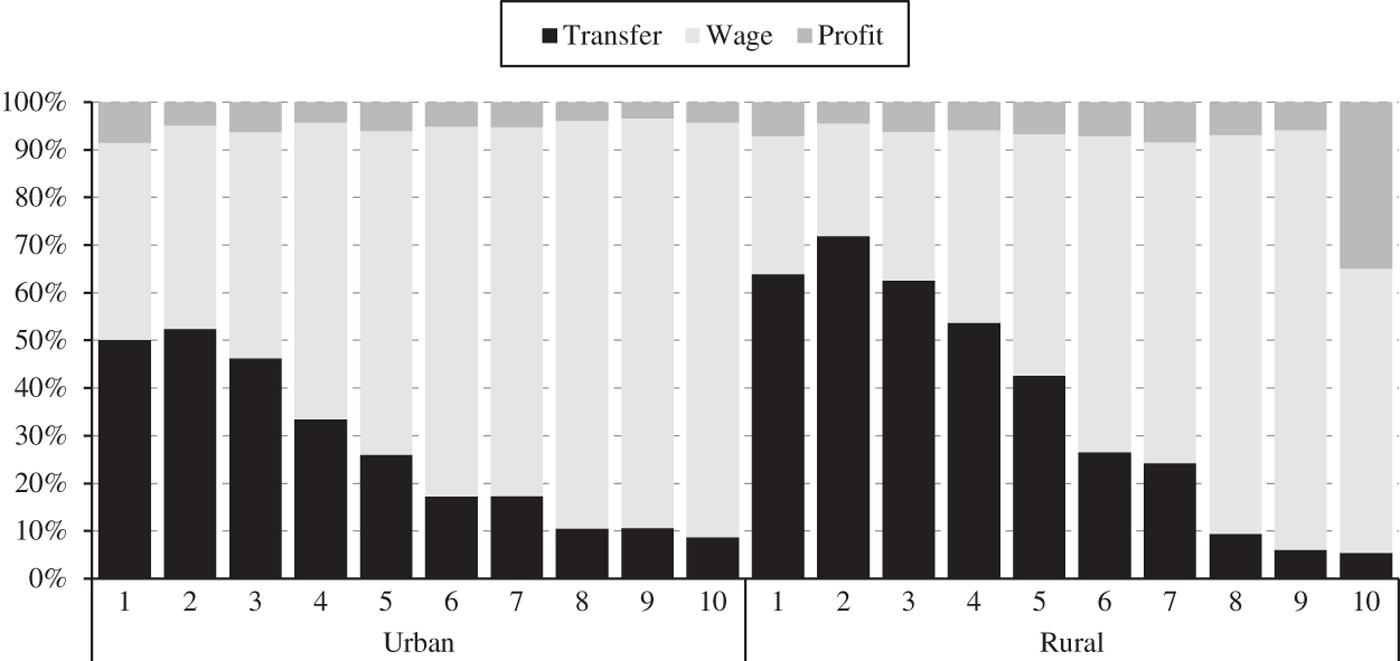
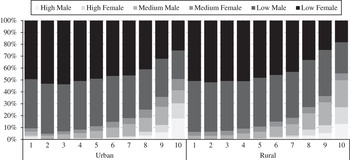
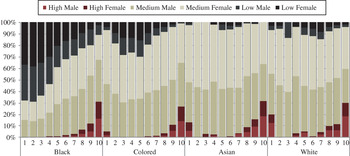
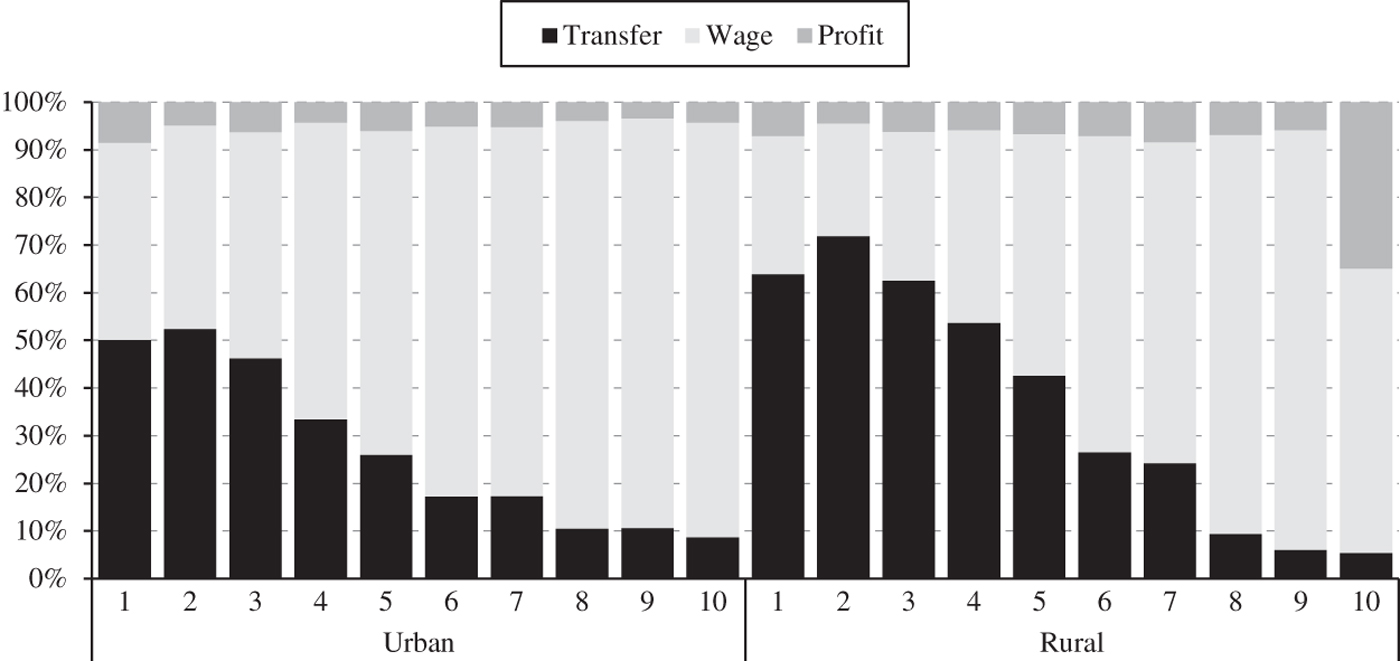
Labour earnings represent a large share of households’ income (figure 5). Further, a significant heterogeneity appears between the top and the bottom income deciles regarding their skill endowment (figures 6 and 7). While the bottom deciles are endowed mainly with low-skilled labour, top deciles show greater share of medium- and high-skilled labour categories. Owing to the fact that low-skilled workers record a significant decline in their expected real wage rates, their real income also falls, leading to increases in poverty measures.
Income structure by urban and rural and income groups
Share of working-age individuals by skill, region and income group

Share of individuals by skill categories for population and income groups

Transfers are the main source of income for the bottom income decile households (figure 5). Further, the share of transfer income is higher for rural than urban households and plays an important role in the urban–rural distributional impact. Poverty measures fall less among rural compared to urban households because of the greater shares of transfers in their income. As transfer income remains unchanged in real terms, it acts as a buffer to the declining income due to high oil prices shock.
Poverty measures increase more among Coloured and Black households groups because of their heavy reliance on low-skilled labour. The increase of poverty among the Coloured population group is particularly significant because of the lower share of transfers in their income compared to that of the Black population group.
GDP falls slightly more in the price-setting scenarios (2.4 and 2.5 per cent) compared to the floating price scenario (2.2 per cent). Thus, the economic performance deteriorates when the government taxes the windfall profit of the synthetic fuel industry, as this transforms private savings into consumption, thereby contributing to deterioration in the trade balance.
5. Conclusion
Using an energy-focused CGE model linked to a micro-simulation household model of South Africa, this paper quantifies the effects of three scenarios corresponding to different government policy responses to the oil price shock. The first scenario assumes that increases in the price of world oil and petroleum products are passed through to end users with no changes in government tax/subsidy instruments. The two other scenarios assume that the world price increases are nullified by a full price subsidy by the government in one scenario, while revenues generated from a 50 per cent tax on the windfall profit of the synthetic petroleum industry contributes to minimising the loss in government revenue in the other scenario.
The poverty headcount ratio increases by 1.2 per cent when the imported crude oil and oil products prices rise by 50 and 25 per cent with respect to their base-year levels, respectively, and pass into the consumers’ bill. The poorest households are most adversely affected by the increase of oil prices as seen in the increases by 1.5 and 1.6 per cent of the poverty gap and the poverty severity indexes, respectively.
Higher cost of imported oil and petroleum products leads to an increase of the country's external spending at the expense of its internal spending. As a result, the demand for domestically produced goods contracts and their prices fall, leading to a fall in business profits, employment and wages. The prices of commodities purchased by households are weighted averages of decreasing prices of domestically produced products, increasing prices of imported oil and fixed prices of imported non-oil products. Therefore, the decline in prices of traded commodities is less important than the declines in prices of non-traded commodities. Because productive factors are being less traded than consumption products, their real prices fall and this leads to an increase of poverty measures.
Poverty increases slightly more in the price-setting scenarios relative to the floating price scenario. The fall in consumer price indexes recorded in the price-setting scenario is cancelled out by additional tax levied on household income to compensate for the government extra expenses implied by the price support policy. While revenues generated from a 50 per cent tax on the windfall profit of the petroleum industry help to minimize the loss in government revenue, they do not contribute to mitigating the increasing poverty trend since the decline in saving and investment under this scenario restricts the country's growth, employment and income distribution perspectives.
Poverty measures fall less among rural compared to urban households because of the greater shares of transfer in their income. As transfer income remains unchanged in real terms, it acts as a buffer to the declining income as a result of high oil prices shock. Because of their heavy reliance on low-skilled labour, poverty measures increase more among Coloured and Black household groups. The increase of poverty among the Coloured population group is particularly significant because of the lower share of transfer in the households’ income compared to that of the Black population group. Finally, low-skilled, rural female workers are penalized more by the oil shocks due to higher dependency on services, food manufacturing and agriculture industries and lower involvement in the energy industries.
This paper, to our knowledge, is the first attempt at applying the micro-simulation cum CGE methodology to the study of the impact of oil price shocks on poverty in the context of an African country. The main lesson from this exercise is that oil price shocks tend to be inequality and poverty increasing, which tends to be aggravated rather than reduced when oil is subsidized. Indeed, inequality rises more in this case. These general equilibrium effects stress the importance of the CGE-micro framework. This has immediate policy implications in various environmental areas, including transportation, environmental regulation, development and climate change. The lessons are valuable not only for South Africa but for upper-middle income oil-importing developing countries characterized by extreme degrees of inequality, as they attempt to find solutions to rising oil prices.