Implications
Understanding the spatial distribution patterns of sheep is important from an animal management perspective and is the result of complex interactions of various factors. In this study, we presented two manipulations that, when applied in a controlled experiment, yielded unexpected changes in spatial distribution. The study presented here suggests that the gathering of information and maximising the intake of a highly preferred food may be important factors determining spatial distributions in certain environments.
Introduction
The spatial distribution pattern of group-living terrestrial herbivores is generally considered to arise from trade-offs between factors pulling them together, such as sociability and fear of predators and factors pushing them apart, such as decreased food availability and increased competition for food (Fryxell, Reference Fryxell1991). Herbivores experience large seasonal fluctuations in the availability of food and geography-dependent variations in pasture quality and are therefore accustomed to grazing in pastures ranging from scarce low-quality to abundant high-quality forage. Here, we experimentally manipulated feeding motivation and food availability to examine the influence of these factors on the spatial distribution of domestic sheep.
Domestic sheep are a highly social species that normally graze on heterogenous pasture (Penning et al., Reference Penning, Parsons, Orr and Treacher1991) and their spatial distribution pattern is influenced by a number of factors (Arnold and Maller, Reference Arnold and Maller1985; Michelena et al., Reference Michelena, Gautrais, Gérard, Bon and Deneubourg2008; Sibbald et al., Reference Sibbald, Oom, Hooper and Anderson2008). Sheep show strong social attraction behaviour and are more likely to move towards each other in order to forage the same patch (Dumont and Boissy, Reference Dumont and Boissy2000; Sibbald et al., Reference Sibbald, Oom, Hooper and Anderson2008) and show reluctance to move away from a group in order to feed (Sibbald et al., Reference Sibbald, Erhard, Hooper, Dumont and Boissy2006). If food is scarce, individuals can be expected to spend a greater amount of time further away from each other and show increased movement and less social cohesion. However, when food is readily available and competition for food is low, individuals can be expected to come together indicating social attraction behaviour (e.g. Giraldeau and Caraco, Reference Giraldeau and Caraco2000). Food availability was manipulated to test the hypothesis that this factor influences the spatial distribution pattern of sheep.
Experimental manipulation of food competition can be achieved by changing group size (e.g. Grand and Dill, Reference Grand and Dill1999), but this manipulation introduces a confounding factor (group size). Instead feeding motivation can be manipulated by overnight food deprivation (Verbeek et al., Reference Verbeek, Waas, McLeay and Matthews2009) that can be expected to lead to greater intra-group competition for food. It should be noted that increasing feeding motivation can be expected to force animals to disperse as they try and maximise their food intake.
Feeding motivation and food availability are likely to have synergistic effects on spatial distribution patterns so that studies that experimentally manipulate feeding motivation and availability, such as in a 2 × 2 design will reveal aggregation behaviour that is more like a natural scenario. Social associations in this study refer to the duration that animals spend in close proximity to each other (within 4 m) and was measured using proximity loggers, which have proved a useful technique for automatically recording social cohesion in wild (Ji et al., Reference Ji, White and Clout2005) and domestic animals (Swain and Bishop-Hurley, Reference Swain and Bishop-Hurley2007). In this study, food availability was manipulated by scattering large grains (lupins) evenly across a plot or by testing in a plot devoid of any food. We hypothesised that (i) increased feeding motivation (hungry, scarce food) will cause animals to move more and have less time and opportunity for social interaction and (ii) in conditions of low feeding motivation (satiated, abundant food), sheep will move less and show greater social interaction. We fitted all sheep with proximity loggers, which record the number and duration of close encounters (<4 m) with other group members. Hence, more encounters of a longer duration indicate greater social interactions (aggregation) in the group leading to patterns that reflect greater social cohesion, whereas fewer encounters of shorter duration would indicate reduced social interactions and associated patterns that reflected reduced social cohesion (dispersal) in the group.
Material and methods
Subjects
Eighty merino ewes either 2 (n = 24), 4 (n = 21), 5 (n = 23) or 6 years old (n = 12) were allocated to one of eight groups of 10 sheep. Groups were each balanced for sheep age and weight as far as possible, and were tested in two successive replicates of four groups each. Before the trial, sheep were kept outside on pasture supplemented with lucerne hay and grain. Two days before the start of the trial, the sheep were moved to the experimental plots (see Design and Procedure section) to familiarise them with these plots.
Design and procedure
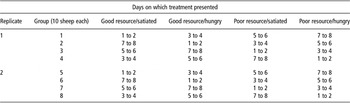
Each group received four treatments in succession; two manipulations applied in a 2 × 2 design, over an 8-day period (Table 1). The procedure involved releasing each group of sheep daily at 0930 h into one of four plots (40 × 40 m) and returning them to the sheep yards at 1330 h (yards ranging from 50 m2 to 100 m2). The plots had been heavily grazed before the trial and contained (based on visual assessment of herbage mass) <200 kg/ha total dry matter (DM), all of which was dead annual pasture (i.e. of low quality and quantity).
Order in which treatments were presented

Each group of 10 sheep received each of the four treatments in a Latin-square design. At any time, there was one group exposed to each treatment, to balance out any day effects equally across all treatments.
Resource quality was manipulated by evenly scattering lupins at a concentration of 6.25 g/m2 (or 10 kg/paddock) to provide a ‘good-resource plot’ or not adding any lupins, to provide a ‘poor-resource plot’. Lupins were 93.8% DM, 38.5% CP and 13.2 MJ/kg DM of metabolisable energy (determined using NIRS). Counts of lupins made before and after sheep were removed from these plots at five predetermined locations (45 cm diameter) were taken to estimate the amount of lupins consumed. Before the introduction of sheep on successive days, lupins were replenished to provide a starting concentration of 6.25 g/m2. This was done by an initial visual examination of the paddocks to determine whether remaining lupins were evenly spaced, and then attempting to spread lupins in order to achieve a uniform distribution. In the second replicate, the good- and poor-resource plots were switched relative to the first replicate, to balance out any effects of plot on the treatments. For the second replicate, lupins left over in the two plots from the first replicate were removed.
Feeding motivation was manipulated by removing feed while the sheep were housed overnight (food-deprived group) or by feeding approximately 5 kg of lucerne hay per group while in the yards (satiated groups). Food deprivation was undertaken to increase competition within the group and animals were on a reduced ration (i.e. food-deprived or poor-resource plot) for a maximum of 48 h consecutively (Table 1). This period of no intake was chosen as it was deemed sufficient to increase feeding motivation but not sufficient to raise any significant ethical concerns. This and all procedures were approved by the University's Animal Care and Ethics Committee (ACEC 09/026).
Measurements
The amount of time that each sheep spent within 4 m of group members while in the plots was measured using proximity collars (Sirtrack Ltd, Havelock North, New Zealand). Each sheep was fitted with a neck collar weighing approximately 0.5 kg (0.8% mean sheep weight; mean sheep weight (range) = 56(38.5 to 65.5)kg). The proximity loggers use an ultra high frequency signal with an identification number (ID). The loggers also receive and log the IDs of loggers within approximately 4 m. The exact distance of contact logs will vary slightly as radio waves can be reflected or blocked by objects such as other sheep (Mullen et al., Reference Mullen, Matis, Adams and Ranganet2004).
In addition, one 5-year-old sheep from each group was randomly selected and fitted with an additional collar with a Global Positioning System (AgTraX L18 GPS, BlueSky Telemetry, Aberfeldy, Scotland) device weighing approximately 1 kg (1.8% mean sheep weight). The Global Positioning System (GPS) collars record position to within ±5 m, and were used to calculate the distance travelled by one sheep from each group while in the plots. GPS fixes were collected every 30 s in order to estimate movement: a higher rate could not be achieved due to memory constraints.
Behaviour scan sampling at 2-min intervals of each group was undertaken for the first 30 min and last 30 min while in the test plots to record the number of sheep grazing in each group. Grazing was operationally defined as sheep standing with their mouth approximately <5 cm from the ground.
Analysis
The proximity collar data were downloaded at the end of each replicate period. The output provided a record of date, time, identification of sheep encountered and the duration of any encounter. An encounter was defined as an association recorded by the logger, and the number of encounters and their duration for each sheep for each 4-h period in the plot were calculated. All data outside of the 4-h recording period were deleted. Of a total of 640 days of proximity records for all the sheep, loggers failed to record 6 days, and on these days the group means were adjusted to take into account the number of animals actually transmitting signals.
As records from each sheep within a group were not independent, a mean encounter number and duration per sheep per group were calculated for each day and this met parametric assumptions of normality and homogeneity of variance. The data were analysed in a repeated measures ANOVA with resource quality (good or poor), hunger state (satiated or food-deprived) and day (first or second) as between-subject factors and group number (1 to 8) as a random effect. Grazing behaviour and lupin consumption were also analysed using a repeated measures ANOVA in a model as described above. Statistical analysis was undertaken using SPSS 17.0 (IBM Corporation, New York, NY, USA).
One of the GPS collars failed to record any data, and only data from seven sheep were available for analysis. On the basis of a developed Arc Macro Language (Environmental Systems Research Institute Inc. (ESRI)) script running in Arc Workstation 9.3 (ESRI), ASCII text files were imported and initial spatial point files were created based on coordinate information within the text files. By selecting coordinate pairs (i.e. points 1 to 2, points 2 to 3, etc.) within the point file, vertices were created to make a spatial-line file. Due to the geographic coordinates being used, the distance measurements were calculated by loading the spatial-line file into ArcGIS 9.3 (ESRI), and the Data View coordinate system was set to Projected, WGS 1984 UTM Zone 55S. A new attribute field for distance was created and using the Calculate Geometry tool, distances in metres were calculated for the view projection. Total distance travelled per day met parametric assumptions and was analysed using an ANOVA in a model as described above.
Results
Grazing time and lupin consumption
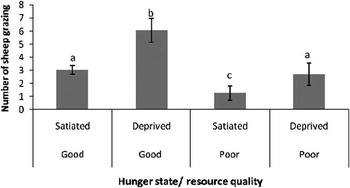
Feeding motivation and resource quality had a significant interactive effect on grazing time (ANOVA: F1,7 = 17.8, P = 0.004; Figure 1). No other second-order interactions (hunger × day, ANOVA: F1,7 = 0.001, P = 0.97; resource × day, ANOVA: F1,7 = 0.008, P = 0.93) or third-order interactions were found (hunger × resource × day, ANOVA: F1,7 = 0.8, P = 0.41). Figure 1 indicates that the most grazing was observed in food-deprived sheep in the good-resource plot and the least grazing time in the satiated sheep released into the poor-resource plot.
Mean ± s.e. of sheep grazing per treatment. Plot shows means for days 1 and 2, as day had no significant effect.

Food-deprived sheep consumed 4.4 ± 0.5 kg of lupins per group per day and satiated sheep consumed 2.1 ± 0.2 kg of lupins per group per day (ANOVA: F1,7 = 21.2, P = 0.002). The amount of lupins consumed did not vary significantly between the first and second day (ANOVA: F1,7 = 0.09, P = 0.77) nor was there a significant day/hunger state interaction (ANOVA: F1,7 = 0.22, P = 0.65).
Encounters recorded by the proximity collars
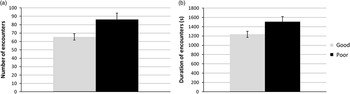
In total, there were 193 760 encounters recorded. No third-order interactions (all P > 0.2) or second-order interactions (all P > 0.2) were found for the number or duration of encounters. Sheep had more encounters (ANOVA: F1,7 = 6.3, P = 0.041) of a longer total duration (ANOVA: F1,7 = 8.6, P = 0.022) in poor-resource plots than in good-resource plots (Figure 2). Feeding motivation had no effect on the duration of encounters (ANOVA: F1,7 = 3.8, P = 0.091) or on the number of encounters (ANOVA: F1,7 = 0.8, P = 0.39). Day of release into the plots also had no effect on the number of encounters (ANOVA: F1,7 = 3.0, P = 0.13) or the duration of encounters (ANOVA: F1,7 = 1.9, P = 0.21).
Mean ± s.e. (a) number and duration of encounters (b) in the good- and poor-resource plots. Data show values per sheep per 4 h.

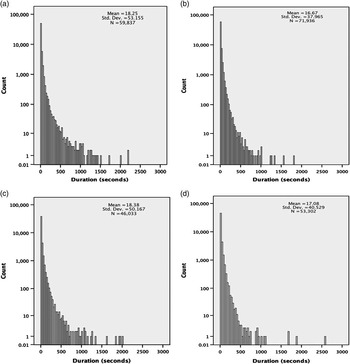
Frequency histograms of the number of social encounters of specified durations indicate that encounters of a short duration were very common in this experiment (Figure 3). The histograms indicate that the above-mentioned significant effect of a poor-resource plot on encounter duration arises mainly due to an increase in the number of encounters in the range of 8 to 15 min.
Frequency histograms of encounter durations of sheep in the four treatments. The number of encounters (y axis, counts) of various durations (x axis, in s) is shown for (a) satiated/poor resource, (b) deprived/poor resource, (c) satiated/good resource and (d) satiated/good-resource treatments.

Distance travelled
Sheep travelled 372 ± 34 m/h in the plots. Sheep travelled further in the good-resource plots on day 1 than on day 2 (412 ± 54 and 329 ± 25 m, respectively), but travelled less distance in the poor-resource plots on day 1 than on day 2 (359 ± 49 and 386 ± 31 m, respectively; resource × day interaction, ANOVA: F1,6 = 7.8, P = 0.031). No significant third-order interaction (ANOVA: F1,6 = 3.5, P = 0.11) or other second-order interactions (hunger × resource, ANOVA: F1,6 = 1.1, P = 0.34; hunger × day, ANOVA: F1,6 = 1.6, P = 0.24) were found on distance travelled. Distance travelled was not significantly influenced by feeding motivation (ANOVA: F1,6 = 0.7, P = 0.45) or resource quality (ANOVA: F1,6 = 0.003, P = 0.96).
Discussion
In summary, food-deprived sheep consumed more lupins and spent more time grazing than satiated sheep indicating that overnight deprivation of food as applied in this experiment was sufficient to alter feeding motivation. Feeding motivation, however, was not found to lead to reduced social cohesion and greater distance travelled as might be expected if sheep were trying to maximise food intake. Instead, resource quality had an effect on social cohesion that was opposite to our hypothesis: sheep showed greater social cohesion in poor-resource plots than in good-resource plots. These findings suggest that feeding motivation was not an important determinant of social cohesion but food availability was involved.
A relatively short-test period of 4 h/day was selected in an attempt to maintain a constant feeding motivation throughout the test, and this was supported by the food consumption data. Mean daily intake observed was 0.44 kg of lupins per sheep for the food-deprived treatment and given 1.0 kg of lupins was available per sheep, the mean intake of lupins is likely to represent the amount of lupins that sheep were able to consume in the 4 h in the plot. The potential daily intake of lupins for merino sheep, taking into account mean weight of our animals is estimated to be 1.4 kg/day, whereas 0.62 kg of lupins per day is required for maintenance (Grazfeed v4.1.13, Horizon Agriculture Pty Ltd, Australia). The ration of lupins consumed was therefore both below daily maintenance and not all the food was consumed in the available time, suggesting that their motivation to consume lupins is likely to have remained high throughout the 4-h test period.
Activity levels and grazing time are important factors in determining spatial distribution patterns of herbivores and have previously been shown to reduce social cohesion in sheep (Michelena et al., Reference Michelena, Gautrais, Gérard, Bon and Deneubourg2008). Although grazing time varied significantly between treatments in our experiment, it was not found to have a corresponding effect on spatial distribution patterns or distance travelled. In particular, sheep distribution patterns were significantly different between treatments in which there was a similar amount of grazing time (i.e. satiated sheep in the good-resource plot and food deprived in the poor-resource plot). It therefore appears that activity levels or grazing time had little effect on spatial distribution patterns in this experiment.
Instead, one possible explanation for the effect of resource quality on spatial distribution patterns could be related to sheep choosing to maintain greater social cohesion if food is scarce. Sheep are accustomed to grazing heterogenous environments in which there is patchy distribution of preferred vegetation, which in turn may become depleted as animals graze on it (Oom et al., Reference Oom, Sibbald, Hester, Miller and Legg2008). Given that the distribution of vegetation is spatially and temporally patchy, information regarding the location, size and quality of food patches should be a significant factor in determining social cohesion of sheep, as in other animals (Clark and Mangel, Reference Clark and Mangel1984; Nocera et al., Reference Nocera, Forbes and Giraldeau2008). As a consequence of hungry sheep failing to find food in the poor-resource paddock, sheep may attempt to increase the amount of information obtained from other individuals by aggregating. The sharing of information in this way has been considered to be critical in exploiting potential opportunities and avoiding danger (Dall et al., Reference Dall, Giraldeau, Olsson, McNamara and Stephens2005), and has been shown to be an important factor in determining distribution of fish at various patches (Hakoyama and Iguchi, Reference Hakoyama and Iguchi1997). It is possible that under certain conditions, namely high feeding motivation and low food availability, the motivation to acquire information from others in the group may force animals to aggregate more than might be expected.
In addition, sheep appear highly motivated to consume lupins, and this may also have influenced spatial distribution patterns. That is, lupins may be such an attractive food that sheep sacrifice their need to maintain social cohesion in favour of moving in order to maximise lupin intake. Such an explanation would explain why sheep disperse more than expected in good-resource paddocks: they moved further away from each other in order to maximise lupin intake. It should be noted that dominance status influences subordinate sheep's decisions to move to a new patch but also influences dominant sheep, which can follow subordinates more than expected (Hewitson et al., Reference Hewitson, Gordon and Dumont2007). If dominant sheep were following subordinate sheep in our experiment, this could also explain why sheep did not disperse as much as expected in the poor-resource paddocks.
The finding that the number and duration of encounters varied due to resource quality suggests that distribution was non-random in at least one type of paddock. Sibbald et al. (Reference Sibbald, Shellard and Smart2000) found that inter-individual (Scottish Blackface sheep) distances were not different from those predicted by a random distribution at high stocking densities but became non-random between 133 m2 and 200 m2/head. The findings from our study, at 160 m2/head, fit in well with the estimates of Sibbald et al. (Reference Sibbald, Shellard and Smart2000). Although we did not compare our close encounter logs with that expected from a hypothetical even distribution, partly because this calculation would be an estimate as the accuracy of the distance of logging of encounters varies due to technical factors. The use of a relatively small paddock has an added benefit because in larger paddocks spatial patterns appear to be influenced by the fear of social isolation (Sibbald and Hooper, Reference Sibbald and Hooper2004).
In conclusion, feeding motivation did not affect sheep distribution patterns as predicted. Instead, the sheep were closer together when food was scarce than when it was abundant, which was contrary to the expectation that when food resources are scarce, sheep would have dispersed more in order to find food. It is suggested that when food is scarce sheep may be coming together in order to share information about food patches. It could also be because when the highly preferred food was abundant, the sheep may have to move apart more than expected in order to maximise intake. It is concluded that the particular details of our experiment, namely the even distribution or absence of a highly preferred food, affected spatial distribution patterns as sheep tried to find this food and maximise intake.
Acknowledgments
We thank John Broster and Craig Poynter of Spatial Data Analysis Network (SPAN) for assistance with the analysis, and Brian Alston and Toby for assistance with sheep work. Funding for the proximity loggers and GPS collars was provided by a Charles Sturt University infrastructure grant.