1. Introduction
Access to reliable solid waste services is an essential component to improve public health, a safe environment and sustainable development, particularly in low-income countries (Altaf and Deshazo, Reference Altaf and Deshazo1996; Ahmed and Ali, Reference Ahmed and Ali2004; Scheinberg et al., Reference Scheinberg, Wilson and Rodic2010). During the last decades, the sheer volume of the generated solid waste, particularly in large cities, has been increasing at an unprecedented rate because of rapid rates of urbanization and rising standards of living (NEERI, 1994; Beede and Bloom, Reference Beede and DE1995; CPCB, 2000; Twardowska and Allen, Reference Twardowska, HE, Twardowska, Allen, Kettrup and Lacy2004; Rathi, Reference Rathi2007). Lack of planning, poor or no separation of waste at the source and ill-designed disposal systems, insufficient public and private funds, and corruption in the public sector characterize many developing countries’ solid waste management (SWM) services (Adedibu, Reference Adedibu1985; Diallo and Coulibaly, Reference Diallo and Coulibaly1991; Gupta et al., Reference Gupta, Krishna, Prasad and Kansal1998; Buenrostro et al., Reference Buenrostro, Bocco and Bernache2001). The negative externalities associated with increasing levels of unmanaged solid waste are further exacerbated by the inadequate provision of other basic infrastructure and services such as water supply, sanitation facilities, sewage and transportation systems.
In Ethiopia, waste management is a problem that affects water quality and public health in urban and rural communities. Solid waste management practices are generally characterized by poor quality services in terms of collection, recycling, open dumping and other forms of improper final disposal; scavenging at landfill sites by waste pickers; and improper and unlined landfill sites and corresponding environmental and public health issues (Baraki, Reference Baraki2003; Tolina, Reference Tolina2006). Currently an estimated 65 per cent of all solid waste produced per day is collected and disposed by municipalities in dumpsites, 5 per cent is recycled, 5 per cent is composted and the remaining 25 per cent of the solid waste is uncollected and dumped in unauthorized areas such as open fields, ditches, sewers, streets and other spaces in Ethiopian cities (Abera and Ali, Reference Abera and Ali2015). Only two of the 15 regional cities in Ethiopia control and have a protocol for their solid waste disposal practices (Degnet and Maru, Reference Degnet and Maru2005).
Being one of the largest cities in Ethiopia, Hawassa has been expanding rapidly because of the influx of unemployed rural residents, and improvements in infrastructure and booming construction works. However, solid waste management in Hawassa is far from adequately organized, and is collected in traditional ways, in which people providing the service in the city use their children as young as 10 years old to collect solid waste using donkey-pulled carts without any safety regulations. Africa has the largest number of child labourers in the world: 59 million children between the ages of 5 and 17 are involved in hazardous work (ILO, 2013). According to the 2011 Ethiopian Demographic and Health Survey (CSA, 2012), 27 per cent of the children between the ages of 5 and 14 (31 per cent of all male and 24 per cent of all female children) are involved in paid and unpaid child labor, either in family businesses or working for non-family members. Ninety-five per cent of the collected amount of solid waste in Hawassa is indiscriminately thrown away at dumping sites on the periphery of the city, and sometimes dumped illegally at empty lots scattered throughout the city. There is no provision of bins and waste collection service charges, which are collected directly door-to-door by the waste operators, are not uniform, varying from 2 to 15 Birr (US$0.10 to 0.85) per household per week, depending on the size of the sack used to dispose the waste.Footnote 1
Most attempts to improve solid waste management in cities in Ethiopia have focused on the technical supply aspects of the service, mostly ignoring the demand side of the solid waste management services, including the ability to pay the service charge in order for the service to be provided in a financially viable way, based on full cost recovery and without relying on child labor. A limited number of stated preference studies have been conducted in developing countries focusing on solid waste collection, and applying the contingent valuation (CV) method (e.g. Altaf and Deshazo, Reference Altaf and Deshazo1996; Marchand, Reference Marchand1998; Rahji and Oloruntoba, Reference Rahji and Oloruntoba2008). In Ethiopia, such CV studies have been carried out in Addis Abeba (Walelegne and Alebel, Reference Walelegne and Alebel2002), based on 494 household interviews yielding an average willingness to pay (WTP) per household per month between 4.6–16.7 Birr; in Mekelle (Gebreegziabeher et al., Reference Gebreegziabeher, Mekonnen and Hagos2012), targeting 226 households resulting in an average WTP between 7.8–11.9 Birr per household per month; and Bahir Dar (Bishaw, Reference Bishaw2011), sampling 164 households and producing an average WTP of 14.5 per household per month.
In this paper, we develop and apply a discrete choice experiment (DCE), another stated preference method, in order to assess public preferences in Hawassa for improved solid waste services, defining the service provision as a bundle of services as in, for example, Adetola and Benedicta, (Reference Adetola and Benedicta2010), which includes an increase in collection frequency and waste separation, and also includes the abolishment of child labor as a separate characteristic of the future solid urban waste management sector. The main objective of the study is to assess public preferences for improved urban solid waste services, estimate public WTP, and identify what determines public WTP, in order to inform future policy and decision-making related to the solid waste management sector. The study presented here differs from existing studies applying DCEs related to solid urban waste (e.g. Sakata, Reference Sakata2007; Karousakis and Birol, Reference Karousakis and Birol2008) in that it includes the labor reform of the waste collection sector in a developing country context as an important additional choice characteristic.
The remainder of the paper is organized as follows. Section 2 describes the design of the DCE, section 3 presents the underlying econometric choice model, section 4 provides the main results and section 5 concludes the paper.
2. The choice experiment
The choice attributes and levels were fixed based on expert interviews and a focus group discussion organized at Hawassa City Hall. The focus group consisted of 10 residential households, one expert in solid waste management, five door-to-door waste collectors, and four landfill operators. The group discussion aimed to identify the main issues related to solid waste management in Hawassa and translate these issues into concrete choice attributes. The meeting also served to clarify issues related to who provides the services, what methods are used to collect the waste, waste transport and disposal, the number of landfills around Hawassa, how payments are fixed and by whom. Domestic waste is collected, transported and disposed of by private households organized into micro-enterprises. Although education is compulsory in Ethiopia for children between 7 and 16 years, children as young as 10 years engage in waste collection, transportation and disposal activities in the city. Child labor was identified by the group participants as one of the main issues in the waste management sector. Other problems related to irregular waste collection, the lack of waste separation (often carried out afterwards on landfill sites by children), the lack of fixed collection rates and the need to renegotiate rates (currently varying between 1–20 Birr per month) regularly on an individual household basis.
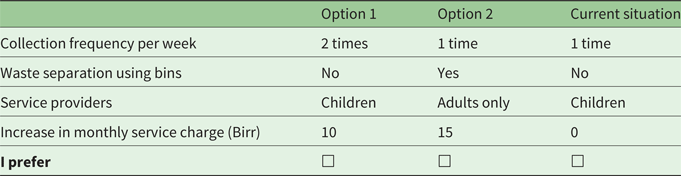
In the DCE, respondents were therefore presented with a series of possible solid waste service improvement scenarios, differing in: (i) the level of weekly waste collection frequency; (ii) whether or not the waste is separated at the source and waste bins are provided so households can sort their waste into recyclables and non-recyclables; and (iii) whether the sector only employs adults instead of children in providing the solid waste services. These improvements come at a price, which consists in this case of an additional monthly service charge just like existing water and electricity bills, paid to municipality-approved door-to-door service providers. Current waste collection frequency of approximately once per week was extended with one and two days extra per week, while the two other non-monetary choice attributes (waste separation into recyclable and non-recyclable waste and the abolishment of child labor) were defined as simple binary variables (i.e. ‘yes’ or ‘no’). Five price levels were identified for the increase in the household's monthly waste service charge of 1, 5, 10, 15, and 20 Birr. This design appeared to work well in a follow-up pre-test based on 20 individual face-to-face interviews with a random selection of households in Hawassa.
Alternative policy scenarios were created by combining the four choice variables based on their different attribute levels in SPSS using a main effects fractional factorial orthogonal resolution III design, which assumes that interaction effects of the attributes are negligible (Kuhfeld, Reference Kuhfeld2005). Main effects typically account for 70 to 90 per cent of the explained variance in these kinds of experimental designs (Dawes and Corrigan, Reference Dawes and Corrigan1974). Twenty-four alternatives were generated and converted into 12 pairwise choice tasks, which were randomly assigned to each respondent. Hence, each respondent answered 12 choice cards. Although there is little consensus, and even less empirical data regarding the optimum level of choice tasks given the choice task complexity, participants in a DCE typically evaluate between one and 16 choice sets, with the average being somewhere around eight choice sets per respondent (Louviere et al., Reference Louviere, Hensher, Swait and Adamowicz2000).
Each choice card shows two hypothetical choice alternatives describing a future improvement of current solid waste services, along with the option to choose none of the two. Inclusion of this latter ‘status quo’ alternative is instrumental in order to be able to estimate welfare measures that are consistent with demand theory (Bateman et al., Reference Bateman, Carson, Day, Hanemann, Hanley, Hett, Jones-Lee, Loomes, Mourato, Ozdemiroglu, Pearce, Sugden and Swanson2003) and not to force respondents to choose the proposed alternatives. Respondents were told that they would not have to pay anything extra if they chose the opt-out. In order to account for the fact that some of the survey participants are illiterate, interviewers read the information on each choice card out loud during the face-to-face interviews. An example of a choice card is presented in table 1.
An example of a choice card

The DCE was implemented in February 2012 through 201 in-person interviews in three distinct city zones in Hawassa, namely Misrak Wukro, Manaharia and Tabor. The city zones were selected with the help of the Hawassa Urban Planning, Sanitation and Beautification Agency. No statistical information is available about each zone's residential household characteristics, but the zones differ considerably in terms of their socioeconomic status. Misrak Wukro is the poorest part of the city, while households living in Manaharia and Tabor are better off.
The procedure was as follows. First households in each zone who were paying for door-to-door solid waste collection were identified. From this, a random selection of households was chosen in each zone. In most cases, women were interviewed since they were at home during the day, and they are traditionally more responsible for handling solid waste in the household (Gebreegziabeher et al., Reference Gebreegziabeher, Mekonnen and Hagos2012). The response rate was 100 per cent, which is not unusual for this kind of stated preference research in developing countries (Whittington, Reference Whittington1998). Trained local enumerators were used for the interviews. After data screening, all 201 of the interviews could be used in the analysis, 68 from Misrak Wukro, 68 from Manaharia and 65 from Tabor.
3. The choice model
Public preferences for improved solid waste services are modeled in terms of McFadden, Reference McFadden and Zarembka1974 random utility model, allowing for a separation of utility (U ijt ) into a deterministic part (V ijt ) and a stochastic part (ε ijt ) as in (1):
 $$U_{ijt} = V_{ijt} + \varepsilon_{ijt}$$
The deterministic part of utility is typically specified to be linear in parameters including a constant term. DCEs fall in the class of attribute-based methods in which the deterministic part of utility for individual i for good j in choice task t is described in (2) as a linear function of its attributes X ijt , other explanatory variables Z ijt and a constant α that is specific to alternative j, ∀ j−1 alternatives:
 $$V_{ijt} = \alpha_{-1} + \beta X_{ijt} + \gamma Z_{ijt}.$$
The alternative-specific constant (ASC) captures the average effect on utility of all factors that are not included in the model. In this particular case, the ASC can be considered as a specific parameter of the utility function capturing a bias toward that alternative (Hoyos, Reference Hoyos2010). In each choice task the respondent is presented with a limited set of proposals D to improve current solid waste services. The stochastic term is assumed to follow an iid extreme value distribution of type I.
In order to account for possible preference heterogeneity, the preference parameters are allowed to vary across respondents, applying different mixing distributions. Equation (3) describes the mixed logit (ML) probability of individual i selecting alternative j in choice task t over other choice alternatives k. The utility coefficients β vary across individuals, hence β
i
, with density
 $\Delta (\beta_{i} \vert b)$
. This density can be a function of any set of parameters and represents in this case the mean and covariance of β in the sample population.
 $$P_{ijt} = \int \left({\exp \lsqb (\alpha_j + \beta_i X_{ijt} + \gamma Z_{ijt})\rsqb \over \sum\nolimits_{j\in D} [(\alpha_k + \beta_i X_{ikt} + \gamma Z_{ikt})]}\right) \Delta (\beta \vert b)d\beta \quad \forall j \in D.$$
ML-models assume heterogeneity to be continuous over the interval spanned by the distribution for the preference parameters (Scarpa et al., Reference Scarpa, Willis, Acutt and Koundouri2005). Treating preference parameters as random variables requires estimation through simulated maximum likelihood. Procedurally, the maximum likelihood algorithm searches for a solution by simulating draws from distributions with given means and standard deviations. Probabilities are calculated by integrating the joint simulated distribution. Applications of ML-models have shown that this model is superior to the standard multinomial logit model in terms of overall fit and accuracy of welfare estimates (e.g. Morey and Rossmann, Reference Morey and KG2003; Provencher and Bishop, Reference Provencher and RC2004; Brouwer et al., Reference Brouwer, Martín-Ortega and Berbel2010a).
Mixed logit models account for preference heterogeneity and repeated choices (Train, Reference Train2003). Even if unobserved heterogeneity is accounted for in a ML-model, the model may still fail to explain the sources of this heterogeneity (Hynes et al., Reference Hynes, Hanley and Scarpa2008). To this end, interactions of respondent-specific household characteristics with choice specific attributes can be included in the utility function to improve the model fit (Revelt and Train, Reference Revelt and Train1998). Finally, the price attribute included in the DCE allows for the calculation of welfare estimates (e.g. Hensher et al., Reference Hensher, Rose and Greene2005). The welfare measures calculated in this study represent the monetary values arising from changes (improvements) in the bundle of solid waste services and are calculated as follows (e.g. Bateman et al., Reference Bateman, Carson, Day, Hanemann, Hanley, Hett, Jones-Lee, Loomes, Mourato, Ozdemiroglu, Pearce, Sugden and Swanson2003):
 $$\hbox{Compensating surplus} = {-(V_0 - V_1) \over \beta_{\rm service\ charge}},$$
where the utility associated with the proposed change in the waste service (V 1) is subtracted from the utility associated with the status quo level of service provision (V 0). If the model is linear in the monetary choice attribute, this indirect utility difference is then divided by the negative of the coefficient associated with the service charge βservice charge.
4. Results
4.1 Sample characteristics
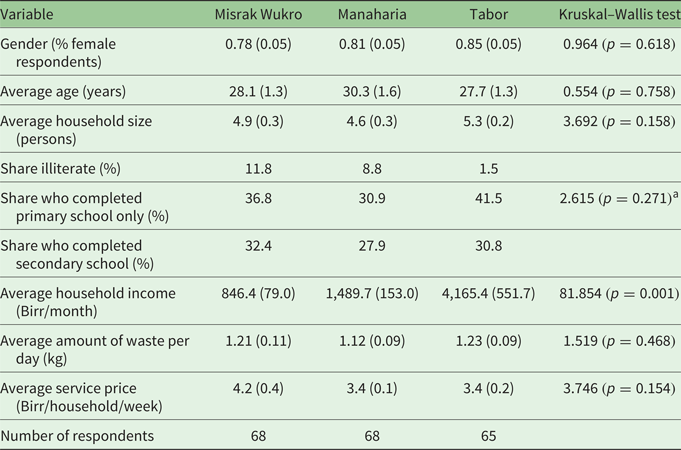
Table 2 reports the main socio-demographic characteristics of the interviewed households in the three city zones. The three samples are homogeneous and hence comparable in terms of gender (81 per cent of all respondents are female), age (respondents are 18 years or older, with the oldest respondent being 75 years) and household size (on average each household consists of 4.9 persons). Also no significant differences exist between the sub-samples with regards to the average amount of waste they generate (on average 1.2 kg per household per day) and the average price they pay for their waste collection (prices varied between 1–25 Birr per household per week, with half of the sample paying 3 Birr per week and the sample average being 3.7 Birr per week).
Main socio-demographic and solid waste service characteristics of the sample population across the three districts in Hawassa

Note: a Test of equality of distributions over all education levels across the three samples.
The main difference between the three sub-samples is, as expected, found in the income levels. Average household income is lowest in Misrak Wukro (US$48 per household per month) and highest in Tabor (US$237 per household per month). Divided by 30 days and the average household size, average income per person per day is less than the World Bank poverty line of US$1.25 in Misrak Wukro and Manaharia. Although the share of illiterate respondents is highest in Misrak Wukro (12 per cent) and lowest in Tabor (1 per cent), the distribution of respondents over the different education levels is statistically not significantly different across the three samples. Differences in the share of respondents who completed primary and secondary school are less pronounced.
4.2 Estimated choice models
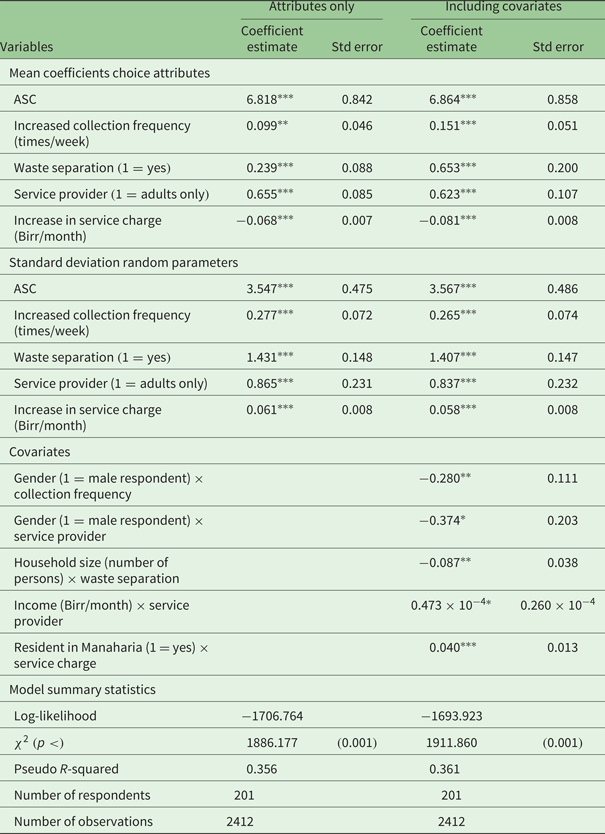
A large majority of the respondents (98 per cent) is interested in, and willing to pay extra for, improved solid waste services and always chose one of the hypothetical alternatives over the status quo. Across all 2,412 choice occasions (201 respondents answering 12 choice sets), the opt-out was chosen in 2.3 per cent of the cases. No protest voters were encountered, i.e. respondents who consistently chose the opt-out alternative in all choice occasions for reasons unrelated to their preferences or income constraints (e.g. Brouwer and Martíin-Ortega, Reference Brouwer and Martín-Ortega2012). Choice behaviour was modelled accounting for the panel structure of the collected choice data. For efficiency reasons, the models were estimated using a Halton sequence of 500 replications in a quasi-Monte Carlo maximum likelihood simulation (Bhat, Reference Bhat2001) in NLOGIT version 5.0.
The ML choice model results without and with the inclusion of covariates are presented in table 3. The estimated choice models are highly significant, as can be seen from the outcome of the χ2 test statistic which tests differences in model fit when going from a model which includes the constant only and the fitted models presented in table 3, and the relatively high pseudo R2 (Hoyos, Reference Hoyos2010). All random coefficients are also statistically significant, indicating that the choice attributes are characterized by significant preference heterogeneity. The distribution of the random parameters is normal for the continuous choice attributes and uniform for the dummy variables (e.g. Hensher et al., Reference Hensher, Rose and Greene2005). The coefficient estimates for the choice attributes are all statistically significant and have the expected signs. The significant positive outcome of the ASC implies that respondents prefer some change instead of no change from the current situation. Respondents positively value an increase in collection frequency, waste separation and the abolishment of child labor, while a price increase for the waste services affects their utility negatively.
Estimated mixed logit choice models

Note: *p<0.10; * *p < 0.05; ***p < 0.01.
Applying a systematic search for the impact of respondent characteristics on both choice attributes and the ASC, a limited set of socio-demographic covariates is found to interact significantly with the choice attributes, but not with the ASC. Significant gender effects are found for two choice attributes: women attach more value than men to the proposed increase in collection frequency and the abolishment of child labor. Bigger households are furthermore less interested in the separation of recyclable solid waste. One possible reason might be that this would entail more work for bigger households as they produce more waste. However, no significant relationship could be detected between household size and the amount of generated waste, based either on correlation or the cross-tabulation χ2 test statistic. Another possible explanation can be found in the fact that a significant association exists between household size and education level (the χ2 test statistic based on cross-tabulation is 119.105, p<0.001). Respondents representing bigger households, that is, consisting of more than the average of 5 persons, are relatively speaking more often illiterate compared to smaller households consisting of less than 5 persons, while respondents from smaller households have relatively more often completed primary and secondary school. Education was expected to play a direct role in explaining choice behavior for the waste service improvement scenarios, in particular for recyclable waste separation and the abolishment of child labor, but none of the education interaction terms turned out to be statistically significant. For example, Adetola and Benedicta, (Reference Adetola and Benedicta2010) found that education generally, i.e. interacting with the ASC but not in interaction with choice attributes such as collection frequency or waste separation, has a positive impact on choice behavior in favor of the improvement of solid waste services in Nigeria. In this study, we find a significant income effect on the abolishment of child labor: richer households attach a small, but statistically significant higher value to the abolishment of child labor in the waste management sector than poorer households.
Finally, a significant effect is found for the zone in which respondents live. Respondents living in the richer zone of Manaharia are willing to pay a significantly higher increase in service charge than respondents living in the poorer zone of Misrak Wukro (i.e., the baseline zone in the estimated choice model with covariates). No such significant effect is found for Tabor.
4.3 Economic welfare measures for solid waste service improvements
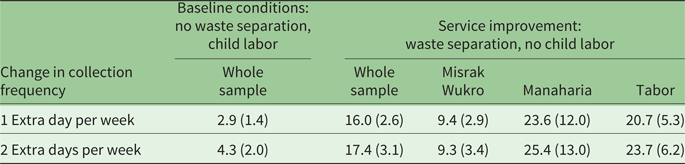
Based on the coefficient estimates in the first attributes only model, WTP values and their standard errors can be calculated, using the Krinsky and Robb, Reference Krinsky and Robb1986 method. Marginal WTP for one extra day per week of solid waste collection in the whole sample is 2.9 Birr per household per month (table 4), while respondents are willing to pay 4.3 Birr extra when their waste is collected 2 days extra per week. This is equivalent to an increase in the sample's average waste collection charge (see table 2) of 20 and 30 per cent, respectively. Marginal WTP is 3.5 Birr (with a standard error of 1.3) per household per month for separating and recycling solid waste, and 9.6 Birr (with a standard error of 1.5) for the abolishment of child labor. Adding waste separation and the abolishment of child labor to the increase in collection frequency (the maximum benefit scenario in table 4) results in an additional increase of public WTP for the whole sample of a factor of 4 to 5 (from 2.9 to 16.0 Birr and from 4.3 to 17.4 Birr for an increase in solid waste collection frequency of 1 and 2 days, respectively). Public WTP is significantly higher in the richer city zones of Manaharia and Tabor than in Misrak Wukro, but no significant difference exists between the former two (Manaharia and Tabor). In Misrak Wukro, public WTP for waste separation and the abolishment of child labor in the waste management sector is the same for one or two extra days of waste collection. This corresponds to a 56 per cent increase over and above the current average service charge households pay. In Manaharia this increase over and above the current service charge is between 174–187 per cent and in Tabor between 152–174 per cent.
Estimated mean WTP for improvements in solid waste services (Birr/household/month)

Note: Standard errors in parentheses.
5. Discussion and conclusions
This study contributes to the limited stock of stated preference valuation studies focusing on the urban waste sector in a developing economy. The study provides valuable insights into household preferences for improvements in current levels of service provision, in particular public WTP over and above current service charges for more frequent collection times and recyclable waste separation through the provision of waste bins. The novelty of the study is found in the fact that we explicitly address the employment of children in waste collection and disposal. Although other studies exist in a developing country context applying DCEs to elicit public preferences for more reliable waste collection services and waste separation, none of these studies addresses the phenomenon of vast employment of child labor in the waste sector.
In this study, almost all of the sampled households are willing to pay extra to improve the existing urban solid waste management system. The WTP values found in this study are remarkably close to the WTP values found in previous CV studies carried out in Ethiopia, which aimed to improve solid waste collection in cities such as Addis Ababa and Mekelle. Public WTP in the whole Hawassa sample for one or two extra days of waste collection per week is on the lower end of the range of WTP values found in the existing literature (4.6–16.7 Birr/household/month), while public WTP in the whole sample for the maximum improvement scenario is on the higher end of these existing CV-based WTP values.
Importantly, households are willing to pay a significant premium over and above existing service charges to abolish child labor in the waste sector, especially households with female household heads and higher income levels. Although official statistics are not available in Ethiopia, many waste collectors use their children to go door-to-door to collect waste, exposing them to all kinds of health risks and depriving them of an education. Moreover, there is public interest in the separation of recyclable and non-recyclable waste when households are provided with waste bins, except from larger households, the heads of whom in this study appeared to be generally less educated.
These results provide important information to municipality officials and the waste management sector as these attributes can be targeted to generate additional revenues and design appropriate strategies to improve existing solid waste management services. Households in Hawassa are willing to pay 20–30 per cent extra over and above their current service charge if the current collection frequency is increased from once per week to twice or three times per week. Significant differences exist, however, between city zones where households earn distinctly different levels of income. Depending on the city zone, public WTP increases by 50–190 per cent over and above the current waste collection service charge if bins are provided for recyclable waste separation and child labor is abolished. These values can be used in future policy appraisals of investment decisions to improve solid waste services in Hawassa and other cities in Ethiopia facing similar waste management challenges. Besides affordability, education was expected to play an important role in explaining public preferences, especially for the choice attributes waste separation and child labor abolishment. Education only seemed to play an indirect role through household size and only affected the choice attribute waste separation.
Finally, although the design of the DCE was simple and straightforward, consisting of four choice attributes only, of which half were binary variables (‘yes-no’, ‘children-adults’), the number of choice tasks was considerable. Respondents were asked to evaluate and make a decision in 12 choice tasks. This did not seem to pose any problems, such as fatigue, in this study, either during the pre-test or the main survey. In order to assess how stable the estimated utility function is and to what extent preference learning or fatigue played a role, choice behaviour at the start of the experiment was compared with choice behaviour at the end of the experiment (Brouwer et al., Reference Brouwer, Dekker, Rolfe and Windle2010b). This was investigated by comparing preference and scale parameters over the choice sequence following the Swait and Louviere, (Reference Swait and Louviere1993) test procedure. The results are presented in the appendix. The scale parameter is inversely related with the variance of the error term (Louviere et al., Reference Louviere, Hensher, Swait and Adamowicz2000). If the scale parameter increases, choice variance decreases, and one could conclude that people make more accurate decisions as they make repeated choices. Obtaining estimates for the scale parameters hence provides insight into possible preference refinement during a choice sequence (Holmes and Boyle, Reference Holmes and KJ2005). Examining the relative variance in table A1 in the appendix suggests that the choice model variance decreases by 32 per cent when comparing the first and second group of choice tasks (first row) with the second and third group of choice tasks (third row). This would point to some degree of preference learning and refinement during the choice sequence, providing further confidence in the robustness of the empirical results.
Appendix
Preference stability was tested across subsets of choice tasks. In choice experiments, the utility function of each individual is assumed to be stable throughout the choice sequence (Brouwer et al., Reference Brouwer, Dekker, Rolfe and Windle2010b). Choice behaviour at the start of the experiment is expected to be consistent with choice behaviour at the end of the experiment. Specifically, we test whether the utility parameters β and the confounded scale parameter λ estimated in the choice model remain the same across all 12 choice tasks. To this end, a pairwise comparison is made between the 12 choice cards. Due to the limited number of observations, the 12 choice tasks are split into three groups of four tasks. In a first step, the estimated ML-model provides efficient estimates for λ1 β1, λ2 β2 and λ3 β3, and a likelihood function for each set of four choice tasks. Because the estimated parameters are confounded with the scale parameters, we have to isolate possible differences in variance before comparing the preference parameters (Louviere et al., Reference Louviere, Hensher, Swait and Adamowicz2000). This means that the scale parameter of the first set of four choice tasks is normalized to λ1=1. A pooled model is then estimated in a second step by including the first and second set of choice tasks, which has the effect of imposing equality on the preference parameters (β1 = β2). In this model, the relative scale parameter λ2/λ1 is, however, not set equal to 1. A search procedure over a range of relative scale parameters is applied to estimate the combination of scale and pooled preference parameters that provides the best model fit. At each possible relative scale parameter, the data for the second set of choice tasks are re-scaled such that an ML-model can be estimated. After the best-fit model has been identified, a standard chi-square distributed Likelihood Ratio (LR) test using the Log Likelihoods (LLs) of the models from step 1 and the best-fit model of step 2 is used to test the difference between the preference parameters in the two choice sets under the null hypothesis that they are the same.
The third step tests for differences in scale across choice tasks. In principle, this step is conditional on the outcome of the mentioned LR test. It requires the estimation of an ML-model for the same pooled model as in step 2, but with equality imposed on both preference and scale parameters this time (β1 = β2 and λ1 = λ2). Again, a chi-square distributed LR test can be applied to compare the LL of the estimated model to the LL of the pooled model with varying scale parameters.
The results of this test procedure are presented in table A1. Due to the confounding of preference and scale parameters, it is impossible to attribute the detected differences between the estimated groups of models to either differences in preference parameters or scale parameters or both (Louviere et al., Reference Louviere, Hensher, Swait and Adamowicz2000).
Test results of equality of preference (β) and scale (λ) parameters between sets of choice tasks