Scholars have long documented that the time young citizens spend in school is strongly related to their levels of civic engagement later in life (Verba, Schlozman and Brady Reference Verba1995; Wolfinger and Rosenstone Reference Wolfinger and Rosenstone1980). Yet there is less research on the specific school-based factors that help students develop into active citizens. Most commonly, scholars attribute the development of early civic attitudes and behaviors to the cognitive skills that schooling enhances or reflects (Denny and Doyle Reference Denny and Doyle2008; Luskin Reference Luskin1990).Footnote 1 For instance, in their seminal work on voter turnout, Wolfinger and Rosenstone argue that education ‘increases cognitive skills, which facilitate learning about politics’ (Wolfinger and Rosenstone Reference Wolfinger and Rosenstone1980, 35–6). Nie, Junn and Stehlik-Barry (Reference Nie, Junn and Stehlik-Barry1996) similarly assert that ‘education influences the characteristics of democratic enlightenment almost exclusively through verbal cognitive proficiency’ (emphasis added). In contrast, a growing body of research from education policy, psychology, economics, child development and other fields suggests that students’ success in school and beyond is predicted by ‘non-cognitive’ or psychosocial attributes – a set of skills and aptitudes related to self-control, emotional regulation and sociability, which are distinct from the cognitive abilities captured by math and reading tests (Cunha and Heckman Reference Cunha and Heckman2007; Heckman Reference Heckman2000; Heckman and Kautz Reference Heckman and Kautz2013).Footnote 2 Recently, popular attention and scholarly work has been focused on the psychosocial attribute of grit – the ‘exertion of effort or will necessary to achieve goals’ (Shechtman et al. Reference Shechtman2013, 15). Across different fields, scholars have found that grit and closely related constructs can predict a variety of success outcomes (Reed, Pritschet and Cutton Reference Reed, Pritschet and Cutton2013; Salles, Cohen and Mueller Reference Salles, Cohen and Mueller2014). In this article, we consider the possibility that psychosocial abilities captured by measures of grit might also predict engagement in school, community and democracy.
Our analysis links a unique large-scale longitudinal student survey with student-level school administrative records from the Wake County (North Carolina) Public School System (WCPSS).Footnote 3 This data enables us to account for a wide variety of observable and unobservable confounders, first to extend previous analyses of student achievement and then to evaluate the relationship between grit and student engagement in school, community and democracy. In doing so, we use several identification strategies, including an especially compelling set of empirical models that leverage family, twin and individual-level fixed effects.
Building on previous research (Duckworth et al. Reference Duckworth2007; Duckworth and Quinn Reference Duckworth and Quinn2009), our results show that grit is an important predictor of academic achievement: students who score one standard deviation higher on the grit scale score about 0.10-0.15 standard deviations higher on standardized tests of math and reading. Going beyond academic performance, we also show that grittier students are more engaged in their schools, have fewer absences and tardies, and are more likely to feel politically efficacious, volunteer in their community, and plan to vote when they are old enough to do so. Our results suggest that these relationships are not an artifact of observable confounders like race, age, gender, socio-economic status, political motivation, personality or other character traits, genetics or even cognitive ability – the marker of individual ability long thought to be pre-eminent in the development of an engaged citizenry (Denny and Doyle Reference Denny and Doyle2008; Luskin Reference Luskin1990; Verba, Schlozman and Brady Reference Verba1995). These results are robust to models that account for a host of unobservable factors that remain constant within census tracts, schools, siblings, twin pairs or within individuals themselves over time, with a few exceptions.
Our analysis has implications that cut across disciplinary boundaries by speaking to our broader understanding of child development, political socialization and civic engagement. The findings suggest that general psychological attributes (like grit), not just domain-specific political attributes (like interest in politics), may shape the development of the attitudes and habits necessary to engage democratically. Indeed, our results suggest that the civic benefits often ascribed to cognitive ability may be at least partly attributable to an individual’s non-cognitive or psychosocial abilities. Our findings also highlight the value of studying political socialization – a field that, according to many, has been overlooked in recent years as research studies tend to ‘eschew […] children’ and instead focus on adulthood.Footnote 4 Building on previous research in this area (Dawson and Prewitt Reference Dawson and Prewitt1968; Greenstein Reference Greenstein1965; Jennings et al. Reference Jennings2005; Niemi and Hepburn Reference Niemi and Hepburn1995; Sapiro Reference Sapiro2004; Searing, Schwartz and Lind Reference Searing, Schwartz and Lind1973; Sears and Funk Reference Sears and Funk1991), our results underscore the need to focus on the roots of political participation, especially given the rigidity of civic attitudes and behaviors in adulthood (Fox and Lawless Reference Fox and Lawless2014; Meredith Reference Appleton2009; Plutzer Reference Plutzer2002; Prior Reference Prior2010, Prior Reference Prior2018). Late childhood and early adolescence appears to be a critical period in the development of the general – not explicitly political – psychological attributes needed to engage in the civic domain.
Our results also have implications for current policy debates. Education policy makers are currently weighing the costs and benefits of emphasizing psychosocial attributes, like grit, in education curricula. For example, a 2013 US Department of Education report concluded that ‘there is an emerging and convergent recognition that [psychosocial] factors – and particularly grit, tenacity, and perseverance – should play an essential role in evolving educational priorities’ (Shechtman et al. Reference Shechtman2013, 75). However, others have been critical of this approach (Ris Reference Ris2015; Erickson Reference Erickson2015). Although this debate has centered on the relationship between grit and academic achievement, our results highlight that the development of psychosocial attributes can contribute to other life outcomes that impact the quality of democracy and society more generally. These results should be of interest to a broad range of education stakeholders, given that one of the fundamental objectives of public education systems is the preparation of a citizenry (Ravitch and Viteritti Reference Ravitch and Viteritti2003).
Background and Conceptual Framework
A growing literature from multiple disciplines examines a set of so-called non-cognitive or psychosocial skills as a means of improving life outcomes.Footnote 5 These abilities appear to promote success in school and beyond, but are distinct from measures of cognitive ability. They are thought to initially develop in childhood and early adolescence (Eccles et al. Reference Eccles1993). Those who develop psychosocial skills early on are thought to be more likely to develop other skills later in life, as ‘skill begets skill’ (Heckman Reference Heckman2000, 3).
Media and scholarly attention has been especially focused on the psychosocial attributes of grit, tenacity and perseverance (Duckworth et al. Reference Duckworth2007; Duckworth and Quinn Reference Duckworth and Quinn2009). Across several disciplines, scholars have found these attributes to be predictive of a variety of well-being measures. Grittier individuals tend to stay in school longer, perform better in school, be healthier and score higher on measures of subjective well-being (Meyers, Pignault and Houssemand Reference Meyers, Pignault and Houssemand2013; Reed, Pritschet and Cutton Reference Reed, Pritschet and Cutton2013; Strayhorn Reference Strayhorn2014; Kleiman et al. Reference Kleiman2013).
What is Grit?
Colloquially, grit is often described using closely related words, such as resolve, resilience, zeal, persistence, pluck, fortitude, determination or endurance. Psychologist Angela Duckworth loosely defines grit as ‘perseverance and passion towards long-term goals’ (Duckworth and Quinn Reference Duckworth and Quinn2009), and the ability to ‘work strenuously toward challenges [and to] maintain effort and interest over years despite failure, adversity, and plateaus in progress’ (Duckworth et al. Reference Duckworth2007).Footnote 6 More recent research has adopted a broader conceptualization of grit, defining it as a bundle of beliefs, attitudes and strategies that help in working through the difficult mental process of planning for and ultimately overcoming obstacles to achieving one’s goals.Footnote 7
Conceptually, we follow the lead of Shechtman et al. (Reference Shechtman2013) and others, and consider grit a construct that captures a set of attributes that enable follow-through on a goal in the face of obstacles. Grit encapsulates one’s levels of general self-efficacy (the belief that one can do what they set out to do (Bandura Reference Bandura1977)), systematic thinking (the ability to plan to overcome the obstacles that stand in one’s way (Golwitzer Reference Gollwitzer1999)) and effortfulness (the ability to work hard and follow through to overcome the barriers that get in the way of completing a given task (Blair and Razza Reference Blair and Razza2007)). That is, in order to achieve a goal, one has to believe in (self-efficacy), put plans in place (systematic thinking) and work hard to stick to the plan (effortfulness).
With its recent ascent to the national discourse, grit is now the subject of considerable debate.Footnote 8 Some contend – perhaps rightfully so – that the rhetoric about the influence of grit on academic performance has outpaced the available empirical evidence (hence our efforts below to first explore whether grit predicts academic achievement, before turning to our primary focus of youth engagement) (Credé, Tynan and Harms Reference Credé, Tynan and Harms2017; Rimfeld et al. Reference Rimfeld2016). Moreover, many have raised concerns about the extent to which grit overlaps – conceptually and operationally – with other psychological constructs.Footnote 9 For example, at first glance, grit seems similar to the notion of resilience previously explored by social psychologists (Ong et al. Reference Ong2006). But while resilience refers narrowly to an ability to adapt to adversity (Masten et al. Reference Masten, Lopez and Snyder2009), grit also encompasses self-efficacy, careful planning and effortful control towards achieving one’s goals (Duckworth et al. Reference Duckworth2007; Tough 2013; Von Culin, Tsukayama and Duckworth Reference Von Culin, Tsukayama and Duckworth2014).Footnote 10 Some have also argued that grit is closely related to the personality dimension of conscientiousness (Rimfeld et al. Reference Rimfeld2016). However, formal empirical examinations have shown only a modest correlation between the two (for example, r=0.44) (Ivcevic and Brackett Reference Ivcevic and Brackett2014). Grit is also weakly related to other psychological characteristics. For instance, Tucker-Drob et al. (Reference Tucker-Drob2016, Table 2) and Credé, Tynan and Harms (Reference Credé, Tynan and Harms2017, 27) show that grit is only modestly related to psychological constructs like a need for cognition (r=0.36), intellectual self-concept (r=0.27), mastery orientation (r=0.32), incremental mindset (r=0.16) and test motivation (r=0.14). Aligning with our broader conceptualization, they also show that grit appears to be more strongly related to measures of generalized self-efficacy (r=0.43), effortfulness (r=0.72) and planning processes (r=0.46), though none of these alone fully captures grit. While touching lightly on other psychosocial constructs – as is the case with virtually all (if not all) psychological factors – meta analyses suggest that grit is uniquely able to capture individuals’ perseverance of effort, which explains variance in academic performance even after controlling for (other psychological factors like) conscientiousness. Our view is that the grit measure captures a family of psychosocial attributes that have yet to be thoroughly explored for their relevance to early civic engagement.
One key way that the concept of grit separates itself from other psychological constructs is its malleability. Recent research seems to suggest that grit – unlike stable personality traits – can be developed, promoted or reinforced. Two recent sets of experiments have explicitly looked at grit’s responsiveness to targeted intervention. In the first, Alan, Boneva and Ertac (Reference Alan, Boneva and Ertac2016) show that school training programs have a lasting effect on students’ grittiness (and also have downstream effects on student grades). In the second, the Behavioral Insights Team in the UK evaluated three randomized-control trials that shifted student learning towards a more reflective and interactive pedagogical approach. These programs increased students’ levels of grit noticeably (and also increased their empathy and problem-solving skills) (Kirkman et al. Reference Kirkman2016). These findings are consistent with research that shows, more generally, that psychosocial skills are malleable (Holbein Reference Holbein2017). While there is certainly more to learn about when and how grit can be changed, and at what point during the life course it is most malleable, it seems to be an individual characteristic that is not fixed at birth.
While empirical work has found grit to be predictive of academic success, conceptually and operationally distinct from other individual attributes (Duckworth et al. Reference Duckworth2007; Eskreis-Winkler et al. Reference Eskreis-Winkler2014; Meyers, Pignault and Houssemand Reference Meyers, Pignault and Houssemand2013; Tucker-Drob et al. Reference Tucker-Drob2016), and malleable to targeted intervention, we remain sympathetic to the view that the standard grit measure might capture a family of psychosocial attributes that tap into the broader ability to persevere in order to accomplish one’s goals in the face of challenges and setbacks. Given the emerging research, it seems reasonable to conceptualize grit as comprising both individual mindsets – how people think about themselves, their environment and their relationships to their environment – and skills – the characteristics originating from one’s knowledge, ability, practice and aptitude – that allow individuals to set aside short-term concerns, withstand challenges and setbacks, and anticipate obstacles in the future (Dweck, Walton and Cohen Reference Dweck, Walton and Cohen2011; Shechtman et al. Reference Shechtman2013). While more work remains to be done to understand the exact nature of grit, the key question motivating our analysis concerns the relevance of this psychological construct for the development of civic and social attitudes and behaviors.
Why Psychosocial Abilities and Youth Civic Engagement?
Our research situates itself in the literature on the psychological underpinnings of youth civic engagement and political socialization more generally (Dawson and Prewitt Reference Dawson and Prewitt1968; Eccles et al. Reference Eccles1993; Flanagan Reference Flanagan2003; Greenstein Reference Greenstein1965; Jennings et al. Reference Jennings2005; Niemi and Hepburn Reference Niemi and Hepburn1995; Sapiro Reference Sapiro2004; Searing, Schwartz and Lind Reference Searing, Schwartz and Lind1973; Sears and Funk Reference Sears and Funk1991; Sears and Levy Reference Sears and Levy2003; Watts and Flanagan Reference Watts and Flanagan2007). These works clearly show that childhood experiences affect civic engagement later in life. Despite a growing body of research in this area, to our knowledge no work has explored the importance of the bundle of psychosocial attributes captured by grit for early life civic engagement. A few studies have come close by exploring the political relevance of other psychosocial attributes and civic participation. These include examinations of the relevance of self-efficacy, emotion regulation, locus of control, and patience or delayed gratification for adult participation (Condon and Holleque Reference Condon and Holleque2013; Denny and Doyle Reference Denny and Doyle2008; Dawes et al. Reference Dawes2014; Fowler and Kam Reference Fowler and Kam2006).
While children and early adolescents are not eligible to vote in the United States, there are a number of ways that they can be civically engaged. Young people can volunteer with civic and political organizations, be involved in their school communities, consume political information and have political discussions, to name a few. Even active participation and involvement in school activities can be thought of as an analog to forms of adult civic engagement. Understanding what helps young people develop the attitudes and behaviors of an active citizen early on – before they are eligible to vote – is vitally important given the habitual nature of civic participation (Plutzer Reference Plutzer2002; Meredith Reference Meredith2009) and the remarkable stability of civic attitudes and behaviors in adulthood (Fox and Lawless Reference Fox and Lawless2014; Prior Reference Prior2010, Prior Reference Prior2018). Young people who start engaging early on are much more likely to do so in adulthood, while those who do not may be left behind (McFarland and Thomas Reference McFarland and Thomas2006).
There are several reasons to suspect that psychosocial skills, like grit, could promote youth engagement in school, community and democracy. Consistent with grit’s dual role in shaping mindsets and skills, these channels involve both the civic attitudes that grit might help develop and the civic behaviors it might promote. First, grit may help individuals follow through on a given desire to be engaged. Put differently, grittier students may be better focused, attentive and willing to exert effort in spite of the obstacles and distractions that they face in being actively engaged. This view starts with an acknowledgment that acts of civic engagement are costly.Footnote 11 Because of the costs, obstacles or distractions that young people face, many may fail to actually follow through and be civically engaged even if they have a desire or motivation to do so. In choosing whether or not to volunteer, for example, young people need to overcome a number of barriers. Volunteering requires time, planning and effort, and competes with a host of distractions and substitutes that limit one’s available time. With grit involving – at its core – the ability to overcome obstacles, the direct relationship is relatively straightforward: grit may help young people overcome engagement costs and follow through on their intentions. Consistent with this notion, some scholars have speculated, but not tested, that it may take ‘a great deal of initiative, energy, [and] perseverance […] [for citizens] to be heard’ (Neuman Reference Neuman1986, 2 (emphasis added)).Footnote 12
Second, psychosocial skills like grit may promote the attitudes necessary to be actively engaged. As mentioned earlier, the notion of grit involves an individual’s ability to believe in themselves across their various life domains. As a result, grit may promote internal political efficacy – the feeling ‘that the individual citizen can play a part in bringing about [political] change’ (Campbell, Gurin and Miller Reference Campbell, Gurin and Miller1954, 187), which is a known precursor to civic engagement (Verba, Schlozman and Brady Reference Verba1995). Having overcome obstacles and experienced success in a number of domains, grittier individuals may be more likely to believe they can understand and navigate complex civic and political environments. In the school setting, an enhanced level of self-efficacy may translate into higher levels of engagement with teachers, peers, schoolwork and various intra-school organizations (Bandura et al. Reference Bandura1996; Fast et al. Reference Fast2010). Simply put, the ability to persevere may breed a general belief that individual efforts in the civic domain are achievable.
Finally, grittier citizens may also be able to better exert effort towards future civic acts like voting. As Duckworth and her coauthors mention, grit often involves goals that have long time horizons (Duckworth et al. Reference Duckworth2007; Duckwork and Quinn Reference Duckworth and Quinn2009; Duckworth Reference Duckworth2016). As such, grit may help individuals better consider their actions in the future. This ability may prove useful in the civic and political realm. Those who develop grit may be able to see themselves as taking part in costly future civic activities. Put differently, in addition to promoting following through on civic activities that are immediately available (such as volunteering and showing up to school), grit may help students anticipate, plan for and identify as participants in activities in the future (such as voting). Thus it is our expectation that grittier students will have higher vote intentions, despite the fact that they are not yet eligible to vote.Footnote 13
Data
To examine the relationship between grit and our outcomes of interest among a sample of young, not yet eligible citizens, we partnered with the WCPSS – the largest school district in North Carolina and the 15th largest in the United States in terms of student enrollment. WCPSS has a mix of urban, suburban and rural areas, and enrolls students of multiple races and ethnicities.Footnote 14 The system currently has more than 180 schools serving roughly 160,000 students across an 800 mi2 area.
During the spring semesters of 2015 and 2016, WCPSS implemented an in-school student survey of all students in grades 5, 8 and 9.Footnote 15 All survey respondents in both waves were linked to school administrative records, resulting in a dataset that is exceptional not only in its size, but also in its scope and richness.Footnote 16 More information on the survey design and summary statistics of our measures can be found in the online appendix.
In both waves, grit was measured using the standard 8-item Duckworth Grit Scale for children (Duckworth et al. Reference Duckworth2007). This battery of questions asks students to identify how well the following statements describe them: ‘New ideas and projects sometimes distract me from previous ones’, ‘Setbacks don’t discourage me’, ‘I have been obsessed with a certain idea or project for a short time but later lost interest’, ‘I am a hard worker’, ‘I often set a goal but later choose to pursue a different one’, ‘I have difficulty maintaining my focus on projects that take more than a few months to complete’, ‘I finish whatever I begin’ and ‘I am diligent’. Together these individual items form a scale that has been previously evaluated for validity and reliability (Duckworth and Quinn Reference Duckworth and Quinn2009). For our analyses below, we create a mean grit scale that is standardized by grade: ranging from -4 to 2.8 and having a mean of 0 and standard deviation of 1.Footnote 17 The scale is reliable (α=0.7) and loads on a common factor (Eigenvalue 1: 2.13, Eigenvalue 2: 0.76).Footnote 18
Our data also contain a variety of questions and administrative data measuring students’ engagement in school, community and democracy. In the survey, we were able to include three items directly related to community and democratic engagement. Following the example of previous research on civic engagement among pre-voting aged youth (Flanagan, Syvertsen and Stout Reference Flanagan, Syvertsen and Stout2007), we include measures of civic attitudes (for example, political efficacy and future voter turnout intentions) and civic behaviors (volunteerism).Footnote 19 Working within the survey length and response option constraints (4-point scales, agree/disagree) of the instrument, these measures were adapted from existing batteries of civic engagement for young people (Flanagan, Syvertsen and Stout Reference Flanagan, Syvertsen and Stout2007). Our models consider these items individually. We also combined them into a scale using principal component factor analysis; the items are strongly related and all load highly on a common factor (Factor 1 Eigenvalue: 1.86; Factor 2 Eigenvalue: 0.82).
We measure school engagement using a combination of survey and administrative data. Although a somewhat nebulous concept, school engagement has long been considered a critical component of student success and has been broadly defined to include the behaviors, attitudes, and values that promote behavioral and emotional participation in a school’s academic, social and extracurricular activities (Appleton et al. Reference Appleton2006; Fredricks, Blumenfeld and Paris Reference Fredricks, Blumenfeld and Paris2004). School engagement can be conceptualized as being closely related to other forms of civic engagement, such as engaging in the community and in democracy – indeed, previous studies have shown that measures of school engagement taken in adolescence are predictive of more traditional forms of civic engagement, such as voting, volunteering and belonging in adulthood (McFarland and Thomas Reference McFarland and Thomas2006; Metz and Youniss Reference Metz and Youniss2005; Marzana et al. Reference Marzana2015).Footnote 20 Included on the student engagement survey were a number of items previously identified and validated by others that are designed to tap into students’ involvement in learning activities, enjoyment or interest in school, and the recognition of the importance of school for future goals (Appleton et al. Reference Appleton2006). Specific items include ‘After finishing my schoolwork I check it over to see if it’s correct’, ‘When I do schoolwork I check to see whether I understand what I’m doing’, ‘I work hard to meet my teachers’ expectations’, ‘I enjoy talking to the teachers here’, ‘I enjoy talking to the students here’, ‘Learning is fun because I get better at something’, ‘What I’m learning in my classes will be important in my future’, ‘School is important for achieving my future goals’ and ‘My education will create many future opportunities for me’.Footnote 21 In addition, we have two proxies for school engagement from administrative data records: student absenteeism and tardies. If students do not show up to school or to class on time they are, almost by definition, not engaged in the school. Empirical evidence supports this notion: our survey-based school engagement scale is strongly related to our administrative measures of student absenteeism and tardies.Footnote 22
Other key variables in our combined data file include student administrative records of cognitive ability, as measured by North Carolina’s standardized math and reading end-of-grade/end-of-course exams.Footnote 23 In addition to allowing us to examine the previously explored relationship between grit and academic achievement, lagged test score measures add value as a control when we examine civic engagement, as they guard against the possibility that any relationship between grit and engagement is an artifact of cognitive skills, which have long been considered a key predictor of engagement in the political science literature (Luskin Reference Luskin1990; Nie, Junn, Stehlik-Barry and Reference Nie, Junn and Stehlik-Barry1996; Verba, Schlozman and Brady Reference Verba1995).
Additionally, from the school administrative records we have measures of students’ race/ethnicity, gender, grade, age, academically gifted status and limited English proficiency status. We also know which school students are currently attending and which census tract they live in. Administrative records also identify siblings, twin pairs and individual students across waves (a fact that we leverage in our identification strategies outlined in the next section).
We also have two survey-based measures of political interest or motivation. Our two specific questions ask students to indicate their level of agreement with the statements, ‘I care a great deal about who is elected to be our next president’ and ‘I think politics and government are boring’ (reverse coded). Given political motivation’s foundational relationship with other civic attitudes and behaviors (Verba, Schlozman and Brady Reference Verba1995), in all of our models we control for measures of this characteristic. We have argued that grit may promote engagement by strengthening individuals’ beliefs about their capacity to engage, their ability to follow through on a given orientation towards engaging, and their ability to anticipate and plan for future forms of engagement. However, this framework does not diminish the need to have some degree of political motivation with our forms of political engagement. While grit might help citizens achieve their goals, their level of political motivation may also matter. Hence, exploring the relationship between grit and civic engagement requires that we partial out the role of political motivation by including it as a control in the model.
Finally, from the student survey we are also able to construct a number of data quality controls, which include an indicator for straight-lining on the grit scale items (1.5 per cent of the sample), a continuous variable measuring the percent of survey questions answered (to help account for non-response bias), a continuous variable measuring the percent of responses that the respondent answered ‘strongly agree’ (to help account for acquiescence bias), an indicator for taking the survey very quickly (marking individuals in the quickest 5 per cent or respondents – equivalent to taking the 50-item survey in about 4 minutes), and an indicator marking individuals who responded in an inconsistent pattern to our two reverse-coded political interest items (as an attention check). These data quality controls help us rule out the possibility that the results are an artifact of systematic survey response patterns or satisficing. They also serve to account for psychosocial factors that are related to, but ultimately distinct from, grit. Recent research has shown that survey-taking patterns offer a powerful behavioral measure of individuals’ levels of conscientiousness or character traits (Hitt, Trivitt and Cheng Reference Hitt, Trivitt and Cheng2016). As a result, including our survey-taking measures allows us to account for other aspects of psychosocial ability unrelated to the Duckworth grit scale.Footnote 24 This approach, combined with our sibling, twin and individual fixed effects models (which we outline in the next section), allows us to isolate grit’s relationship with test scores, school engagement and democratic engagement net of the other potentially important individual student traits and abilities.
Methods
To evaluate the relationship between grit and our outcomes of interest, we use several identification strategies. Our first approach controls for the observed characteristics and data quality measures that we just outlined. This approach most closely resembles previous work studying grit’s relationship with academic performance (Duckworth et al. Reference Duckworth2007; Kleiman et al. Reference Kleiman2013; Reed, Pritschet and Cutton Reference Reed, Pritschet and Cutton2013).
Improving on previous work (Duckworth et al. Reference Duckworth2007; Duckworth and Quinn Reference Duckworth and Quinn2009), we are also able to control for census tract/school fixed effects. These account for both observable (community socio-economic conditions, levels of grit, etc.) and unobservable (school quality, school culture, school leadership, social connectivity, community levels of civic involvement, etc.) differences that remain constant within these fairly fine-grained geographic units.Footnote 25 All in all, these geographic fixed effects account for the possibility that any relationship with our outcomes of interest is a byproduct of the time-invariant components of social context.
Additionally, we are able to leverage the fact that we can identify twins and siblings in our sample.Footnote 26, Footnote 27 Among non-experimental studies of psychological characteristics, twin and sibling fixed effects models are one of the strongest robustness checks that can be run, as they controls for a host of observable (for example, socio-economic status, family members’ levels of political motivation, family members’ levels of engagement, parents’ grittiness, etc.) and unobservable (for example, parenting style, personality, shared heritable traits, etc.) factors that are shared within families and twin pairs.Footnote 28 As such, this modeling approach is commonly used to eliminate many sources of potential bias, but this technique has not often been used in studies of the roots of civic engagement, with some notable exceptions (Burden et al. Reference Burden2017; Charney and English Reference Charney and English2012; Dinesen et al. Reference Dinesen2016; Fowler, Baker and Dawes Reference Fowler, Baker and Dawes2008; Oskarsson et al. Reference Oskarsson2017).Footnote 29
As a final robustness check, we leverage the fact that we have panel data from Waves I and II of the student survey, and estimate individual fixed effects models that approach causality even more so than the sibling and twin pair models. These models take advantage of variation in individuals’ level of grit over time, comparing students when they are gritty to themselves when they are less gritty. In a way, this modeling approach is similar to an especially powerful difference-in-difference specification, where the first difference is between individuals whose level of grit changes over time (the ‘treatment’ group) and the second difference is between those whose level does not change (the ‘control’ group).Footnote 30 Given the grades present in the survey (5th, 8th and 9th), the sample for this estimation procedure comes from individuals who were in 8th grade in the first wave and 9th grade in the second (with some additional students who repeated grades also included).Footnote 31 This modeling approach controls for all observable and unobservable individual-level heterogeneity that remains constant within individuals over time (individual-level propensity to engage, family-level propensity to engage, genetics, childhood experiences, stable personality traits, etc.). This provides a very stringent robustness check in exploring the relationship between grit and engagement in school, community and democracy. While this approach is commonly used in education studies with panel data (Hanushek, Kain and Rivkin Reference Hanushek, Kain and Rivkin2004; Ladd, Clotfelter and Holbein Reference Ladd, Clotfelter and Holbein2015), to our knowledge this strict specification has rarely been used in observational studies of engagement outcomes. While this modeling approach is especially powerful, it does not absorb heterogeneity that varies within individuals over time. That said, this approach goes a long way towards accounting for factors that may bias our estimates. With this final robustness check, we are able to make our estimates as observationally robust as possible given our research question of interest.
These rigorous robustness checks allow us to account for the possibility that our results (shown in the next section) are picking up some other personality trait beyond grit. Many of these traits, like conscientiousness, have been shown to be stable within families and over time (Cobb-Clark and Schuer Reference Cobb-Clark and Schurer2012; Mondak Reference Mondak2010; Soldz and Vaillant Reference Soldz and Vaillant1999). Given stability along these dimensions, our sibling, twin and individual fixed effects models will absorb all of these other stable character traits. In short, given our robustness checks – and our survey quality controls mentioned earlier – it is highly unlikely that any relationship between grit and test scores and engagement in school, community and democracy is an artifact of conscientiousness or other stable psychological characteristics.
Results
In each of the results reported here, we provide the predicted change in our outcomes associated with a one-standard-deviation change in the Duckworth grit scale. In some instances, as a reference we also report the associated change moving from the 10th to the 90th percentile of the grit scale.Footnote 32
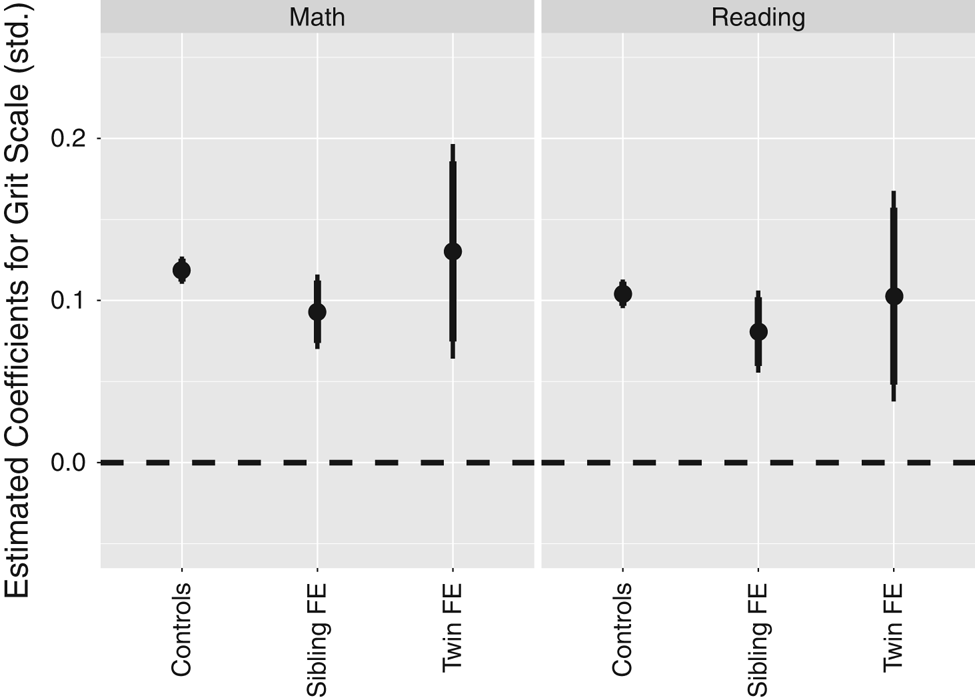
Before turning to our primary results for student engagement in school, community and democracy, we first briefly replicate and extend previous work exploring the relationship between grit and academic performance. Figure 1 plots the coefficient estimates for our models relating grit and student achievement in math and reading. Our first two modeling approaches suggest that students who score one standard deviation higher on the Duckworth grit scale score roughly 0.119σ higher (p<0.01) in math and 0.104σ (p<0.01) in reading. If we compare individuals at the 10th percentile of the grit scale to those at the 90th percentile, the estimates are 0.31σ (p<0.01) for math and 0.27σ (p<0.01) for reading.Footnote 33 This conclusion holds if we look among siblings (math: β=0.093, p<0.01; reading: β=0.081, p<0.01) or twin pairs (math: β=0.130, p<0.01; reading: β=0.103, p<0.01). In short, regardless of the modeling approach, we find that grittier students perform noticeably better on standardized tests than those who have less grit. This finding, while not our primary focus, is meaningful in that it validates and extends previous research exploring the relationship between grit and student performance (Duckworth et al. Reference Duckworth2007; Eskreis-Winkler et al. Reference Eskreis-Winkler2014). It suggests that grit is vital for student achievement.
Grit and student achievement (waves 1 and 2). Note: coefficient plot for grit’s estimated relationship with test scores. Bars represent the 90 per cent and 95 per cent confidence intervals. Grit is measured with the Duckworth 8-item Grit Scale (standardized by grade). Achievement standardized by grade to have a mean of 0 and a standard deviation of 1. Models with controls (math, N=33,889; reading, N=32,369) include survey wave, race, gender, academically gifted, limited English proficiency, attendance, and school and census tract fixed effects. Sibling models (math, N=16,455; reading, N=15,867) include gender, age, attendance, data quality controls and survey wave. Twin models (math, N=1,092; reading, N=1,060) include controls for gender, data quality controls and survey wave.

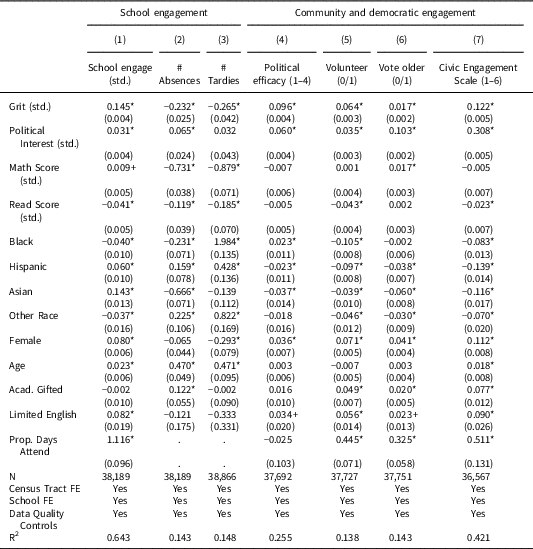
We next go beyond student test scores to explore the relationship between grit and our measures of students’ school, community and democratic engagement. We start with students’ levels of engagement in school. Table 1 documents the relationship between grit and three proxies of students’ engagement in their schools – a survey scale measuring various aspects of school engagement, validated unexcused absences and validated unexcused tardies from school administrative records. Column 1 shows that students who are observationally similar, but grittier than their counterparts score about 0.145 standard deviations (p<0.01) higher on the survey-based school engagement scale.Footnote 34 In addition, Table 1 shows that gritty students appear to have fewer absences. Column 2 shows that a one-standard-deviation increase in grit predicts 0.23 fewer absences (p<0.01) and 0.27 fewer tardies (p<0.01), on average.Footnote 35 These effect sizes are modest; however, given the harm that student tardiness and absenteeism has on student learning (Goodman Reference Goodman2014), this predicted reduction in absences is meaningful.
Grit and student engagement in school, community and democracy

Note: robust standard errors in parentheses. Each of the model controls for data quality items include an indicator for those straight-lining on the grit scale items, a continuous variable measuring the percent of survey questions answered (to help account for non-response bias), a wave fixed effect, a continuous variable measuring the percent of responses to which the respondent answered ‘strongly agree’ (to help account for acquiescence bias), an indicator for taking the survey very quickly, and an indicator marking individuals who responded in an illogical pattern to our two reverse-coded political interest items. + p<0.10 , * p<0.05
Table 1 also shows that grit predicts our measures of students’ engagement with community and democracy. Column 4 provides the estimates for political efficacy. As we have hypothesized, grittier students appear to have a stronger belief that they have the capacity to engage in civic and political processes. Students who score one standard deviation higher on the grit scale score 0.096 units higher on the 4-point political efficacy scale (p<0.01) – a sizeable estimate that benchmarks well with the coefficient size for political interest (0.06 units, p<0.01). If we compare individuals at the 10th percentile to those at the 90th percentile, we have an estimate of 0.25 units higher on the political efficacy scale. If we recode political efficacy to a dichotomous variable by splitting observations at the median, the models suggest that a one-standard-deviation shift in grit predicts a 5.3-percentage-point increase in the likelihood of a student feeling politically efficacious (p<0.01). These results suggest that grit contributes to the early development of one the most foundational political attitudes – political efficacy.
Column 5 likewise shows that grittier students are more likely to volunteer in their community. Students who score one standard deviation higher on the grit scale are 6.4 percentage points more likely to volunteer than observationally similar, but less gritty students (p<0.01). Column 6 shows that grittier students are also more likely to report an intention to vote when they are old enough to do so.Footnote 36 Controlling for observables and census and school fixed effects, a one-standard-deviation change in grit predicts a 1.7-percentage-point increase (p<0.01) in the probability of intending to vote. If we compare individuals at the 10th percentile to those at the 90th percentile, the estimate indicates a 4.4-percentage-point increase in the probability of intending to vote. This estimate is not only statistically significant; it is also substantively large. Considering that 84 per cent of students indicated an intention to vote, it is meaningful that we are still able to see substantive variation along the dimension of student grittiness given the presence of ceiling effects.Footnote 37 (This result with vote intentions as the outcome holds even when we shift our models slightly to also control for political efficacy, suggesting that while grit is related to political efficacy, its relationship with other metrics of engagement is not fully explained by this foundational political attitude.) That grit is predictive of vote intentions suggests that not only does grit help young citizens follow through and overcome obstacles to forms of civic behavior that are currently available (that is, volunteering), it also helps them believe that they will be able to do so with forms of engagement that are possible in the future (that is, when they become eligible to vote). Finally, Column 7 shows the relationship between grit and a scale of our civic engagement outcomes combined together. This multi-item scale reduces measurement error in our civic engagement outcomes. These models show that grittier students are 0.122 units (p<0.01) higher on this 6-point weighted scale. If we compare individuals at the 10th percentile to those at the 90th percentile, we find a predicted increase of 0.32 units.
How large are these estimates? One way to benchmark our results is to compare them to one of the most common predictors of political participation: political motivation. If we compare the coefficients for our grit and political interest variables, rescaled in order to compare the lowest and highest levels of these variables (net of the other), we see that grit is a stronger predictor of childhood and early adolescent political efficacy (grit=0.61 units; political interest=0.24 units) and volunteering (grit=41.2 percentage points; political interest=14.2 percentage points), whereas political interest is a stronger predictor of early vote intentions (grit=10.8 percentage points; political interest=41.5 percentage points) and our combined civic engagement scale (grit=0.78 points; political interest=1.24 points). This suggests that while political–psychological orientations (like political interest) are important, so too are general psychological orientations (like grit) in the socialization of early civic attitudes and behaviors.
Our results suggest that grittier students have a stronger belief that they have the capacity to be involved in the political process (political efficacy), a greater ability to follow through on their desire to actively engage in activities that are available to them (volunteering, attending school), and a greater capacity to see themselves as being able to overcome future obstacles to their engagement (intending to vote). Moreover, as we show in the online appendix in our heterogeneity analyses (see Figure A.2), in some cases grit serves to narrow stubborn participatory gaps.
While these models do not fully account for bias from potential unobservables (which we discuss in the next section), they are meaningful in their own right. Our grit estimates are robust to controlling for political motivation and cognitive ability – two of the most foundational predictors of civic behaviors, and the factors previously thought to be the key drivers behind educational attainment’s relationship with civic participation. Indeed, as we show in the online appendix, some of the supposed contribution of cognitive ability to civic engagement may be more accurately attributed to psychosocial ability (see Figure A.3). Not only does psychosocial ability remain statistically significant when we include these foundational controls, it also remains a substantively meaningful predictor of the formation of early civic attitudes and behaviors. This suggests that previous political socialization studies have missed the non-cognitive or psychosocial attributes that appear to contribute to the development of early civic attitudes and behaviors.
Robustness Checks
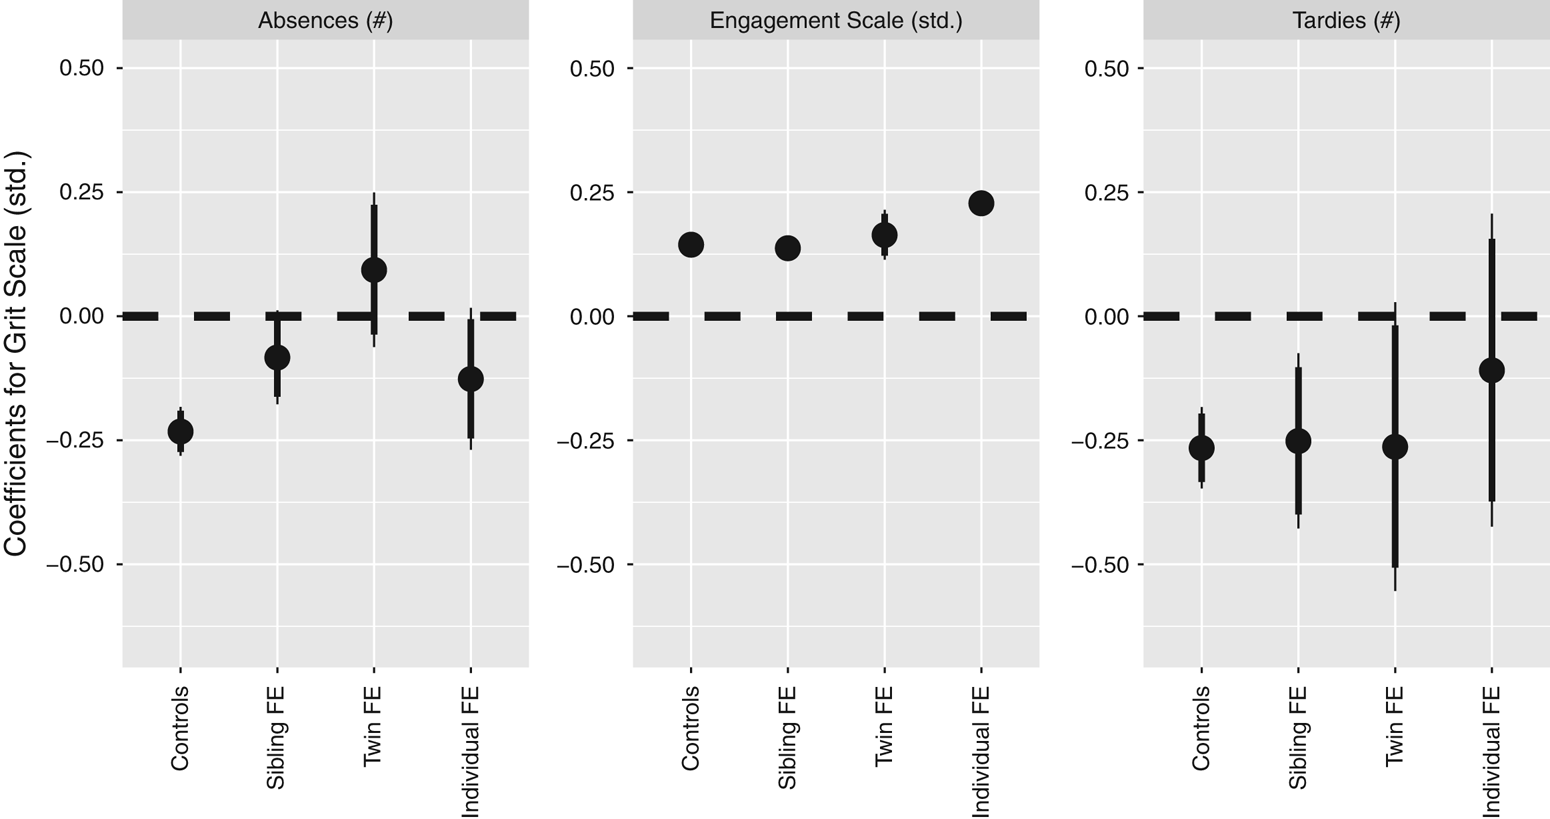
We next check the robustness of our results shown in Table 1 using a number of methods to account for bias from potential unobservables. These leverage family, twin pair and individual fixed effects. The relationship between grit and our survey-based measures of school engagement holds and remains substantively large among siblings (β=0.137σ, p<0.01), twin pairs (β=0.164σ, p<0.01) and individual fixed effects specifications (β=0.228σ, p<0.01). Figure 2 shows this visually by providing coefficient plots of these estimates. The figure confirms that gritty students appear to report being more engaged in their schools.
Grit and school engagement, robustness checks Note: coefficient plots of our grit estimates across four model specifications – those with all controls, sibling fixed effects, twin fixed effects, and individual fixed effects. Grit is measured using the Duckworth 8-item Grit Scale. Our measures of tardies and absences are raw counts from validated administrative school records in the WCPSS. The school engagement scale is created from select WCPSS survey items from the Appleton et al. (Reference Appleton2006) school engagement scale. The school engagement scale and grit are standardized by grade.

The next two panels of Figure 2 show the relationship between grit and student absenteeism and tardies. While our estimate for absences holds with controls, sibling and our strongest model specification – that with individual fixed effects – it does not hold among twins. The estimate itself is small, positive and not statistically distinct from zero, perhaps reflecting the homogeneity in attendance patterns among twins. That said, the absence estimates remain significant at the 90 per cent level in the individual fixed effects specification. Likewise, there is some evidence that our estimate for tardies is not a product of unobservables captured by our sibling and twin pair models. The estimate for tardies is not statistically distinguishable across model specifications, and remains statistically significant in the sibling estimate (p<0.01); it is marginally insignificant in the twin pair sample (p<0.077), but is not close to being significant in the individual fixed effects specification (p<0.50).
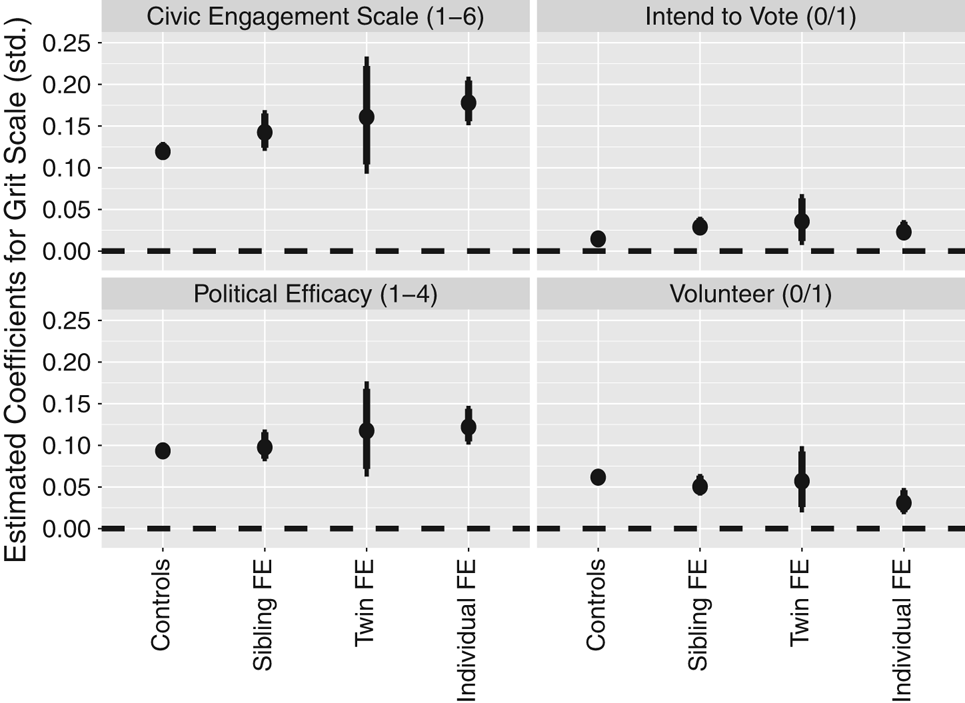
Figure 3 shows that our results for the civic engagement outcomes are quite robust to model specification. With volunteering, we find that grit’s effect clearly holds among siblings (β=5.3 percentage points, p<0.01), twin pairs (β=5.9 percentage points, p<0.01) and individual fixed effects specifications (β=3.3 percentage points, p<0.01). This suggests that grit help encourage young people to follow through to overcome obstacles that get in the way of their civic engagement. A similar pattern holds for political efficacy. We find that grit noticeably increases political efficacy in the sibling (β=0.10 units, p<0.01), twin pair (β=0.120 units, p<0.01) and individual fixed effects specifications (β=0.124 units, p<0.01). This suggests that the relationship outlined in the last section between grit and political efficacy is not the product of observed or unobserved factors that remain constant within families, twins or individuals themselves. Likewise, with vote intentions we can see that grit matters, perhaps even more than suggested in our models with controls alone, among our sibling (β=3.1 percentage points, p<0.01), twin (β=3.8 percentage points, p<0.02) and individual fixed effects specifications (β=2.5 percentage points, p<0.001). Finally, the same pattern holds in the combined civic engagement scale: the sibling (β=0.15 units, p<0.01), twin pair (β=0.16 units, p<0.01) and individual fixed effects specification (β=0.18 units, p<0.01) all remain statistically significant and substantively meaningful.
Grit and civic engagement, robustness checks Note: coefficient plots of our grit estimates across four model specifications – those with all controls, sibling fixed effects, twin fixed effects, and individual fixed effects. Grit is measured using the Duckworth 8-item scale (standardized by grade). Vote intention and volunteer are indicator variables for those who ‘agreed’ or ‘strongly agreed’. Our civic engagement scale is a composite of the other three civic items.

Taken together, these results suggest that grittier students not only perform at a higher level in school, but are more likely to be actively involved in their schools, communities and democracy. This pattern cannot be explained by political motivation, cognitive ability, other character traits, socio-economic status or other factors that remain constant within our fairly restrictive sibling, twin and individual fixed effects specifications.
Conclusion
We have shown that psychosocial abilities, like grit, constitute an important, yet heretofore unexplored, predictor of early civic attitudes and behaviors. Beyond the better-established relationship with student performance on standardized tests, our results show that grittier students are also more engaged in schools, communities and democracy. These results have implications for our broader understanding of the early roots of civic attitudes and behaviors, and for public policy.
Our results suggest that stubbornly low civic engagement may have its roots in the general psychosocial attributes that children develop (or fail to develop) early in life. This finding refocuses attention on development that occurs during late childhood and early adolescence – which appear to be critical periods in the development of the psychosocial skills needed to be active citizens (Holbein Reference Holbein2017). While political scientists have long focused on the material resources, cognitive abilities and political motivations that citizens need to engage in their community and in various political processes, our results suggest that childhood and adolescent psychosocial attributes, like grit, may also play a critical role. Our results shed light on the socialization of civic attitudes and behaviors – a field that has strong roots, but that has seen surprisingly little research in recent years (Niemi and Hepburn Reference Niemi and Hepburn1995; Sapiro Reference Sapiro2004). We also build on existing work in this area by reopening a promising line of research that explores how various psychological attributes influence a number of political attitudes and behaviors. These results suggest that general non-political individual psychosocial attributes predict whether young people become actively engaged in politics or fail to do so.
From a policy perspective, there is disagreement about how much attention schools should give to teaching children psychosocial or non-cognitive skills (Farrington et al. Reference Farrington2012; Shechtman et al. Reference Shechtman2013). Our findings indicate that in addition to predicting academic achievement, psychosocial skills – like grit – might also benefit societal well-being by helping to develop more engaged citizens. This information should be central to policy debates, since a fundamental objective of the education system is to prepare an engaged student body – one that will be active in the civic and political realm in adulthood. Future work should explore whether these findings generalize to other contexts, and investigate their curricular implications. Scholars and policy makers have considerable work ahead to identify specific policies and practices that may help to develop and reinforce psychosocial skills, like grit. As mentioned earlier, some early studies have shown that interactive curricula, such as those that emphasize service learning, have been shown to enhance psychosocial abilities. These offer particular promise given their connection to civic participation (Metz and Youniss Reference Metz and Youniss2005; Marzana et al. Reference Marzana2015). In short, our work implies that experiments studying the downstream effects of non-cognitive skill programs on civic outcomes are worthwhile. Further studies in this domain have the potential to shed light on ways that schools can better achieve their mission to promote a more active and engaged citizenry.
Supplementary Material
The WCPSS data used in this article is proprietary, and confidentiality agreements prohibit disclosure, as the data contains sensitive individual-level school records. However, interested scholars can apply for access through the WCPSS. For eligibility rules, restrictions, data security provisions and how to apply to access the data, please contact the WCPSS Data, Research & Accountability Department. To view supplementary material for this article, please visit https://doi.org/10.1017/S000712341800025X
Acknowledgements
We wish to thank the Wake County Public School System for its support of this collaboration. We thank Christian Covington for his research assistance. We are also very grateful to feedback from Steven Snell, Helen Ladd, Jacob Vigdor and Nicholas Carnes and seminar participants at Duke University, the University of North Carolina, the University of Texas, the University of Arizona, the University of Virginia, Brigham Young University, Indiana University, Harvard University, Princeton University, the Massachusetts Institute of Technology, Boston University, Brigham Young University, Columbia University, Duke University, University of Chicago, University of Tennessee, Tufts University, the Midwest Political Science Association, the Association for Public Policy Analysis and Management, Association for Public Opinion Research, and the Southern Political Science Association for their helpful comments and feedback.
Financial support
We thank the National Science Foundation (SES-1416816 and SES-1657821) for their generous financial support.