Introduction
Magnetic nanofluids are the stable suspension of superparamagnetic nanoparticles in a liquid medium, which responds reversibly with the applied magnetic field.[Reference Li, Xuan and Wang1] Superparamagnetic iron oxide magnetic nanoparticles have been focused as potential materials for many biomedical (diagnostic and therapeutic) applications due to their high chemical stability and biocompatibility as compared to the other nanoparticles. In addition to the biocompatibility, the easy way of synthesis, surface functionalization, easy way to attaching the drug molecules with the nanoparticle surface, and targeting them to the targeted region have lead many groups to investigate the Fe3O4 nanoparticles for the applications such as magnetic fluid hyperthermia, cell separation, magnetic resonance imaging, and drug targeting and delivery.[Reference Laurent, Forge, Port, Roch, Robic, Vander Elst and Muller2–Reference Zverev, Pyatakov, Shtil and Tishin6] Hyperthermia is one of the cancer therapy, in which the cancer cells are killed by raising the temperature above the physiological range in the tumor region.[Reference Saniei7–Reference Tishin, Shtil, Pyatakov and Zverev10] Hyperthermia therapy has been considered as an alternate treatment method for cancer therapy due to the physical and physiological side effects present in the conventional cancer treatment methods such as drug, surgery, chemotherapy, and radiotherapy.[Reference Thiesen and Jordan11] There are many modes of hyperthermia available such as whole body hyperthermia, radiofrequency capacitance hyperthermia, and phased-array microwave hyperthermia. However, these methods have their own limitations like invasive, tissue non-specific, heating above the physiological temperature, heating surrounding cells. The ideal hyperthermia should be non-invasive, tissue-specific, precise localization of thermal energy, and high intensity heating.[Reference Deatsch and Evans12]
In this regard, magnetic fluid hyperthermia in the presence of the AC magnetic field is most focused by researchers in recent years. This is basis of the well-known magneto-caloric effect in which there is variation in the temperature of the material with a change in the magnetic field.[Reference Shull, McMichael, Swartzendruber, Bennett, Dormann and Fiorani13] Hyperthermia by AC magnetic field is currently focused by many researchers for the cancer treatment due to the magnetic field-guided targeting and specific heating of the particular region of the body (tumor-affected region), without affecting the normal cells present in other parts of the body.[Reference Deatsch and Evans12] In this therapy, the magnetic fluid is injected intravenously into the tumor-affected region, and the fluid is heated by the applied AC magnetic field from outside the body. When the magnetic nanoparticles in the fluid are exposed to the applied radiofrequency field, the particles absorb energy from the magnetic field and release the absorbed energy as heat to the surrounding fluid when the magnetic field is switched off, this leads to increase in the temperature of the surrounding fluid. This rise in temperature used to kill the cancer cells.[Reference Lu, Salabas and Schuth5,Reference Rosensweig14,Reference Mamiya and Jeyadevan15]
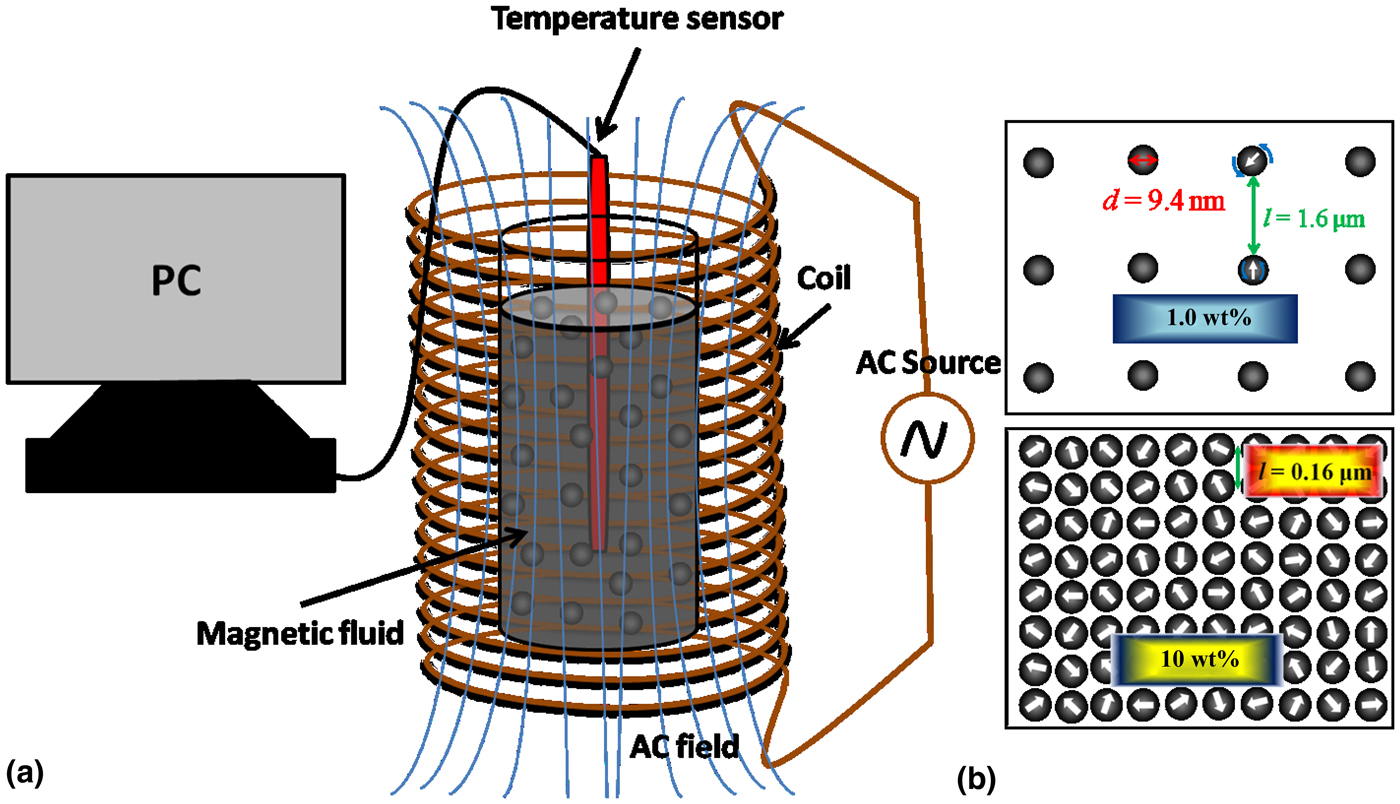
Recently, many studies have shown the slight changes in the magnetic properties of the surfactant-coated superparamagnetic Fe3O4 nanoparticles when they form clusters or chains in the fluid as compared to the well-separated nanoparticles in the fluid.[Reference Landi16,Reference Klik, McHugh, Chantrell and Chang17] Temperature rise pattern of fluid samples is expected to be different in accumulated or cluster of nanoparticles as compared to well-separated magnetic nanoparticles. As shown in Fig. 1, in case of 1 wt% nanoparticle concentration, the particles are well separated. The particle diameter is measured from the TEM measurements. The interparticle separation is calculated by considering the particles to be homogeneously distributed in the fluid, and the calculated interparticle separation for 1 wt% is l = 1.6 µm and for 10 wt% is l = 0.16 µm. This is an ideal situation for understanding the separation between the particles. The power absorption of magnetic nanoparticles in this condition depends on the relaxation time of the magnetic nanoparticles in fluid after removing the applied magnetic field. Neel's relaxation and Brownian relaxation play the dominant role in magnetic energy to thermal energy conversion. In Brownian relaxation, the relaxation happens through the whole particle rotation in fluid, but in the Neel's relaxation the nanoparticle in fluid remains stable, and the relaxation happens through the rotation of the magnetic moment inside the particles.[Reference Suriyanto, Ng and Kumar18] However, at 10 wt% nanoparticle concentration, the particles could form clusters and form a spin glass-type structure[Reference Klik, McHugh, Chantrell and Chang17] (Fig. 1). In this case, interparticle interaction can have a significant role for energy conversion. Two recent theoretical reports[Reference Klik, McHugh, Chantrell and Chang17,Reference Chalopin, Bacri, Gazeau and Devaud19] show that the Debye model failed to explain the effect of interacting dipoles and the Debye model for susceptibility also depends on the applied magnetic field through the ordering of the spin of superparamagnetic nanoparticles. In this present study, we have experimentally investigated temperature rise with the concentration of the nanoparticles in fluid at various applied AC magnetic field strength (60–260 Oe field at 20 Oe interval). We have found a large increase in the temperature rise pattern at higher concentration of the nanoparticles. We have also presented a theoretical model based on the experimental observation of the temperature rise of magnetic nanofluid.
(a) Schematic of the hyperthermia measurement setup with the AC magnetic field and (b) top-view of ordered nanoparticle distribution for 1 and 10 wt%, d is the nanoparticle diameter and l is the interparticle separation.

Materials and methods
For the synthesis of citric acid-coated magnetite nanoparticles, iron(III)chloride hexahydrate (FeCl3·6H2O), iron(II)chloride tetrahydrate (FeCl2·4H2O), and citric acid (C6H8O7) are purchased from Aldrich chemicals, and ammonium hydroxide (NH4OH, i.e., 30% NH3) purchased from Merck chemicals used as received without any further purification. Distilled water was used throughout the synthesis procedure.
The synthesis involves coprecipitation of the iron chloride salts with ammonium hydroxide base, and prepared nanoparticles are coated with the citric acid molecules.[Reference Goodarzi, Sahoo, Swihart and Prasad20] In a typical synthesis, 0.1 M of FeCl3 and 0.05 M of FeCl2 were taken in a 500 mL RB flask and heated to 80 °C with constant stirring, then NH4OH solution was added to the reaction mixture. The black precipitate was formed immediate after the addition of the NH4OH solution. Then, the reaction temperature was increased to 95 °C and maintained at that temperature for 2 h. Then, the reaction mixture was cooled to room temperature and then washed using the dialysis process. The obtained precipitate was dried in air oven at 60 °C for 4 h. The dried powder was used for characterizing the sample. The magnetic fluid samples were prepared by dispersing the dried powder samples in water at six different weight percentages (1.0, 2.5, 5.0, 6.4, 8.0, and 10.0 wt%) using ultra sonication.
Characterization
The phase purity of the prepared samples was analyzed by powder x-ray diffraction (XRD) using a Bruker D8 Advance x--ray diffractometer with a Cu metal target (K-radiation, 1.5406 Ǻ). The size and morphology of the prepared samples were recorded using the Transmission Electron Microscope (TEM; JOEL JEM-2100) at an accelerating voltage of 200 kV. The TEM samples were prepared by dispersing the prepared powder sample in water and drop casted over the carbon-coated copper grid. The hydrodynamic size of the nanoparticles was measured using the dynamic light scattering (DLS) studies using the Zetasizer Nano ZSP particle size analyzer. Fourier Transform Infrared spectra of the prepared samples were carried out using a Bruker Cary 600 series spectrometer from Agilent Technologies. The samples were mixed with KBr and made in the form of pellet. The measurements were done in the range of 4000–400 cm−1. The field-dependent and temperature-dependent magnetization measurements were performed using the Quantum Design Physical Property Measurement System (PPMS). Magnetic fluid samples were packed in our own made liquid sample holder without any air gap and used for magnetization measurements. Hyperthermia measurements for the fluid samples were done using a DM100 nB nanoScale Biomagnetics system at various applied magnetic fields (60–260 Oe at 20 Oe interval) and at constant frequency (101 kHz).
Results and discussion
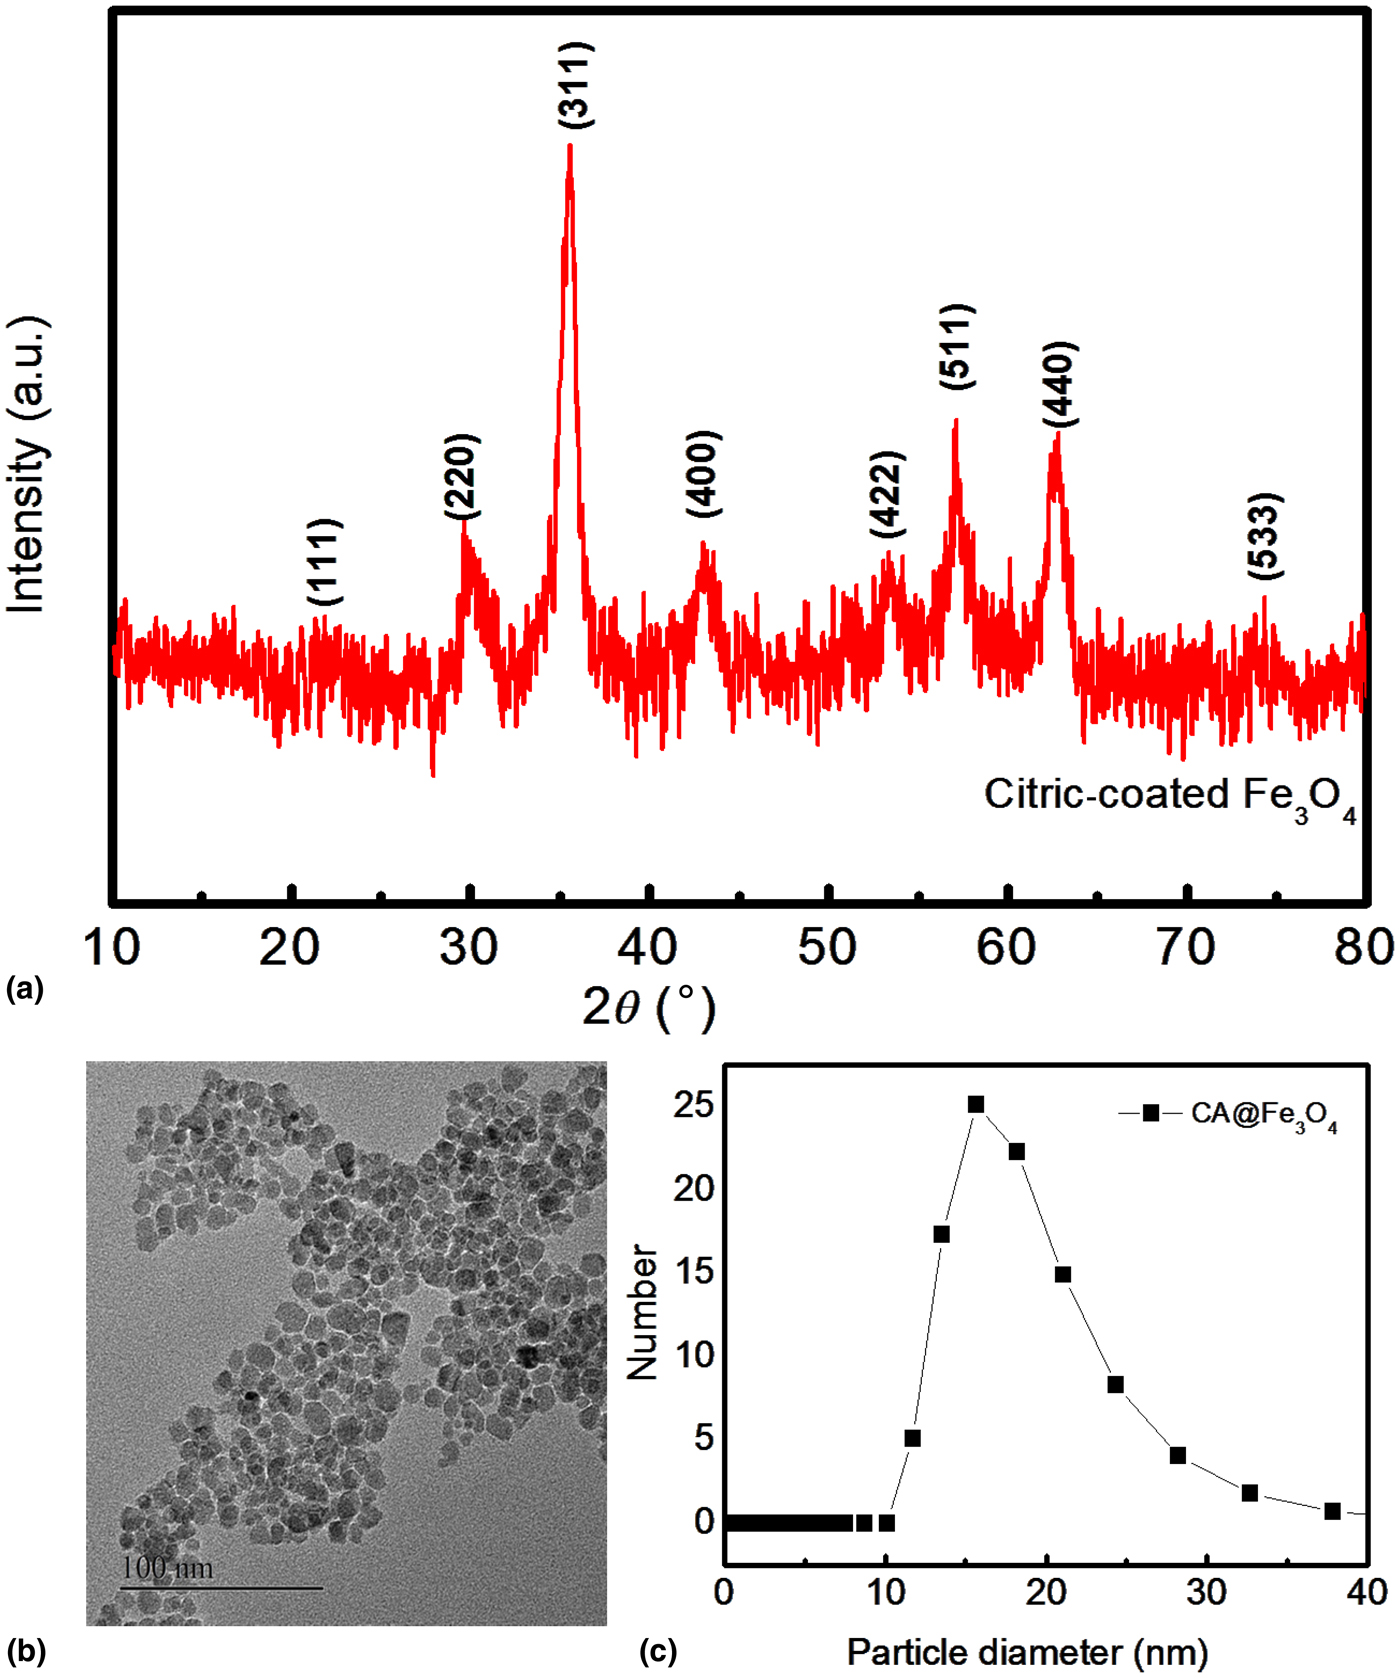
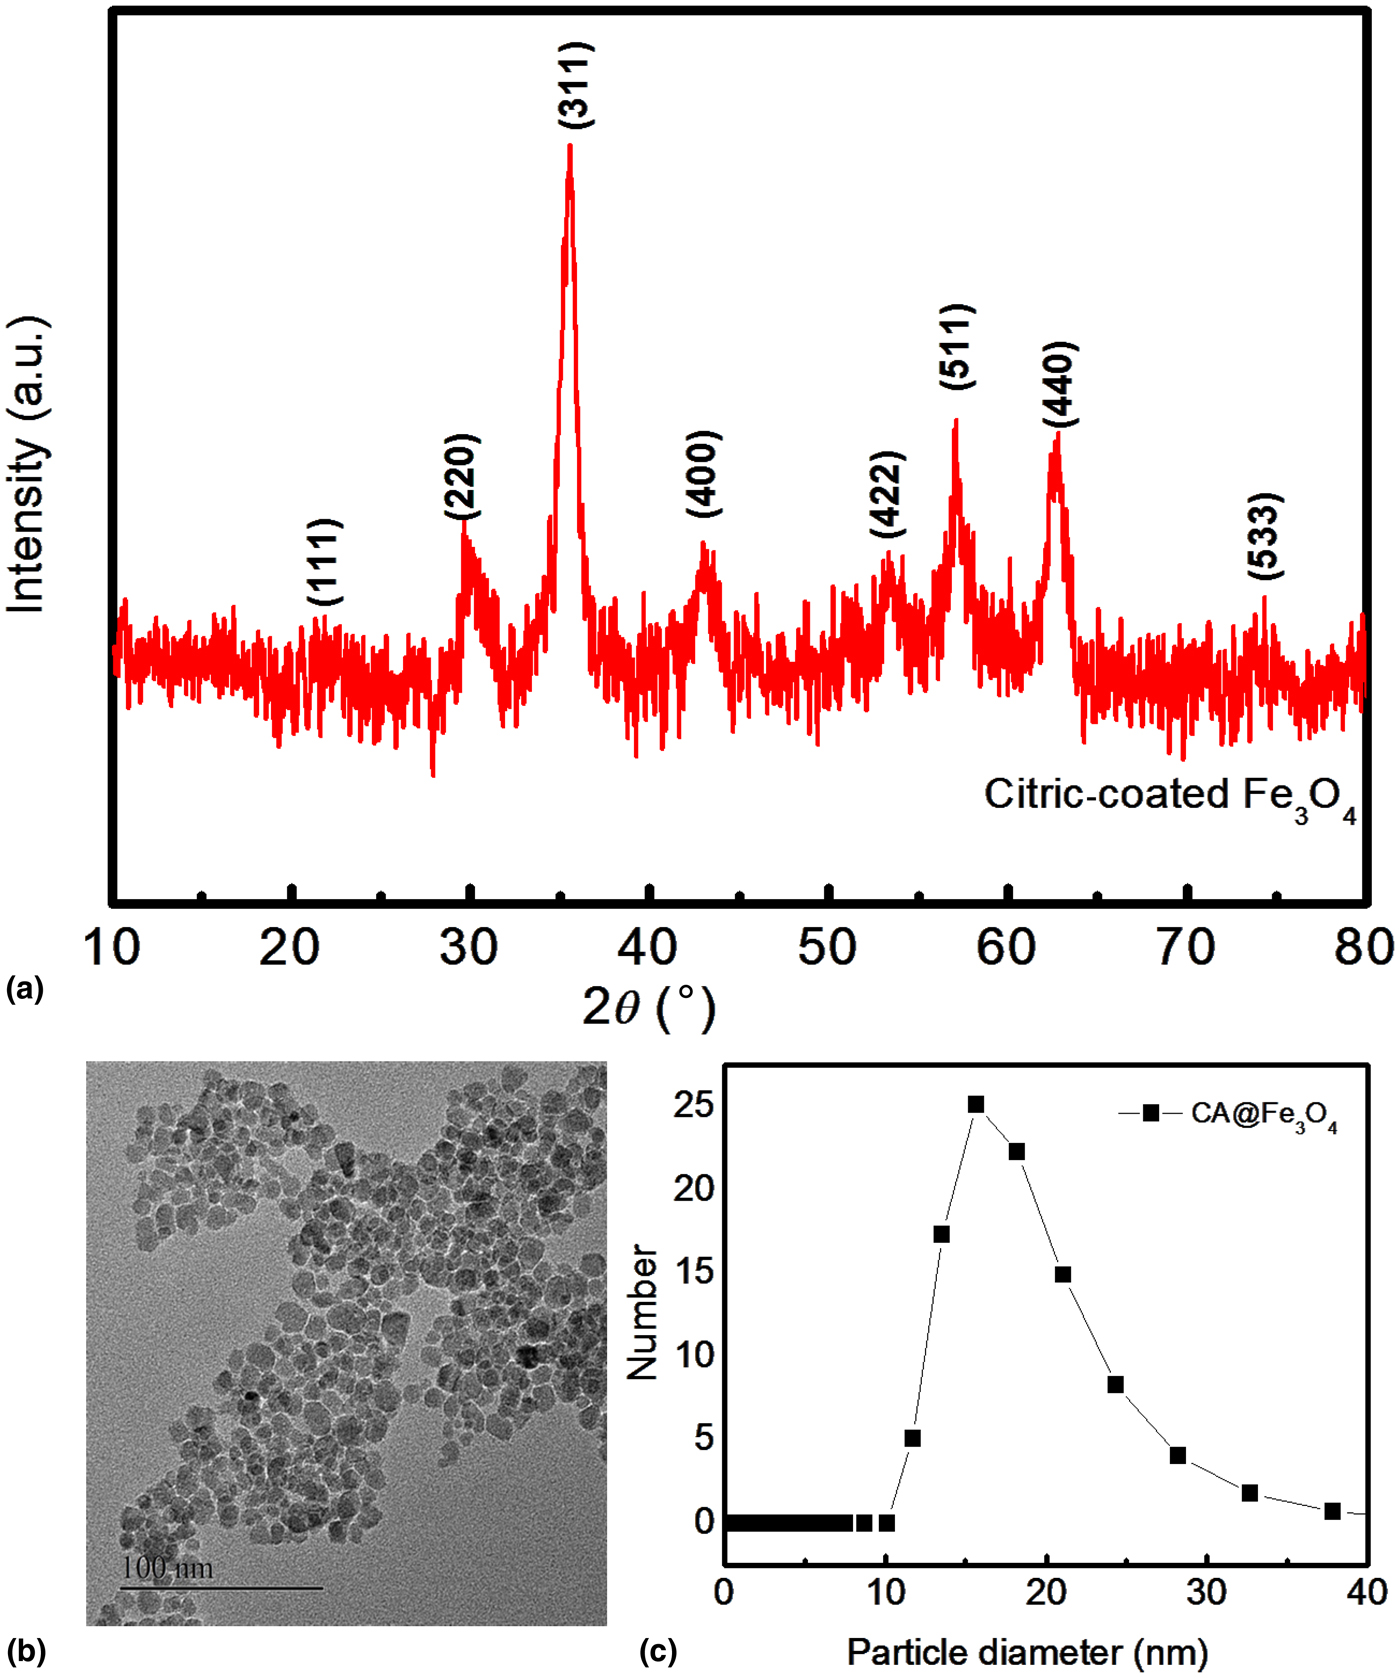
The powder XRD pattern of the synthesized Fe3O4 powder sample is shown in Fig. 2(a). The diffraction pattern of the synthesized sample matches well with the simulated pattern which shows the formation of a spinel phase with the lattice parameter of 8.37 Ǻ, which is closer to the lattice parameter of the magnetite (8.40 Ǻ, JCPDS # 19-0629). The average crystallite size of the synthesized sample is calculated from the full width at half maximum (FWHM) of the major peak by using the Scherrer equation,[Reference Monshi, Foroughi and Monshi21] and the calculated average crystallite size is 8 nm. The TEM images of the prepared sample show the formation of approximately spherical particles (Fig. 2(b)) and are well separated from each other due to the surfactants (citric acid molecules) present on the surface of the nanoparticles. The calculated particle size from the Gaussian-fitted histogram shows 9.4 nm (as shown in Supplementary Fig. S1), which is larger than the crystallite size calculated from the XRD pattern (8 nm). The larger size from the TEM image could be attributed to the amorphous layer and the surfactant layer present on the surface of the nanoparticles. DLS studies show narrow distribution of the particles and the distribution of the particles from 10 to 35 nm with a maximum number of particles at 15.8 nm (as shown in Fig. 2(c)). The average hydrodynamic diameter (d h) of the particles is 17 nm. The observed hydrodynamic diameter is larger than the crystallite size (8 nm) and the particle size (9.4 nm) obtained from the XRD and TEM, respectively. The observed larger hydrodynamic diameter is attributed to the surfactant molecules and the ordered layer of solvent molecules at the interface of the nanoparticles. Fourier Transform Infrared spectra of the prepared samples were carried out using a Bruker Cary 600 series spectrometer from Agilent Technologies. The surface coating on the surface of the magnetite nanoparticles was studied by the Infrared spectroscopy (as shown in Supplementary Fig. S2). The formation of the new band at 1620 cm−1 indicates the attachment of the carboxylate group of citric acid on the surface of magnetite nanoparticles.[Reference Racuciu, Creanga and Airinei22] The strong band at 590 cm−1 corresponds to the Fe–O stretching frequency, which indicates the attachment of the oxygen atom of the carboxylic acid to the iron atom in the nanoparticle.[Reference Waldron23] The field-dependent and temperature-dependent magnetization measurements were performed using the Quantum Design PPMS. Room temperature magnetization measurement of the prepared solid sample shows that no remanence and coercivity indicate the formation of superparamagnetic nanoparticles with the saturation magnetization of 47.7 emu/g (see Supplementary Fig. S3).
(a) XRD pattern of the synthesized powder sample of Fe3O4 nanoparticles, (b) TEM image of Fe3O4 nanoparticles, and (c) DLS measurement of the prepared fluid sample.
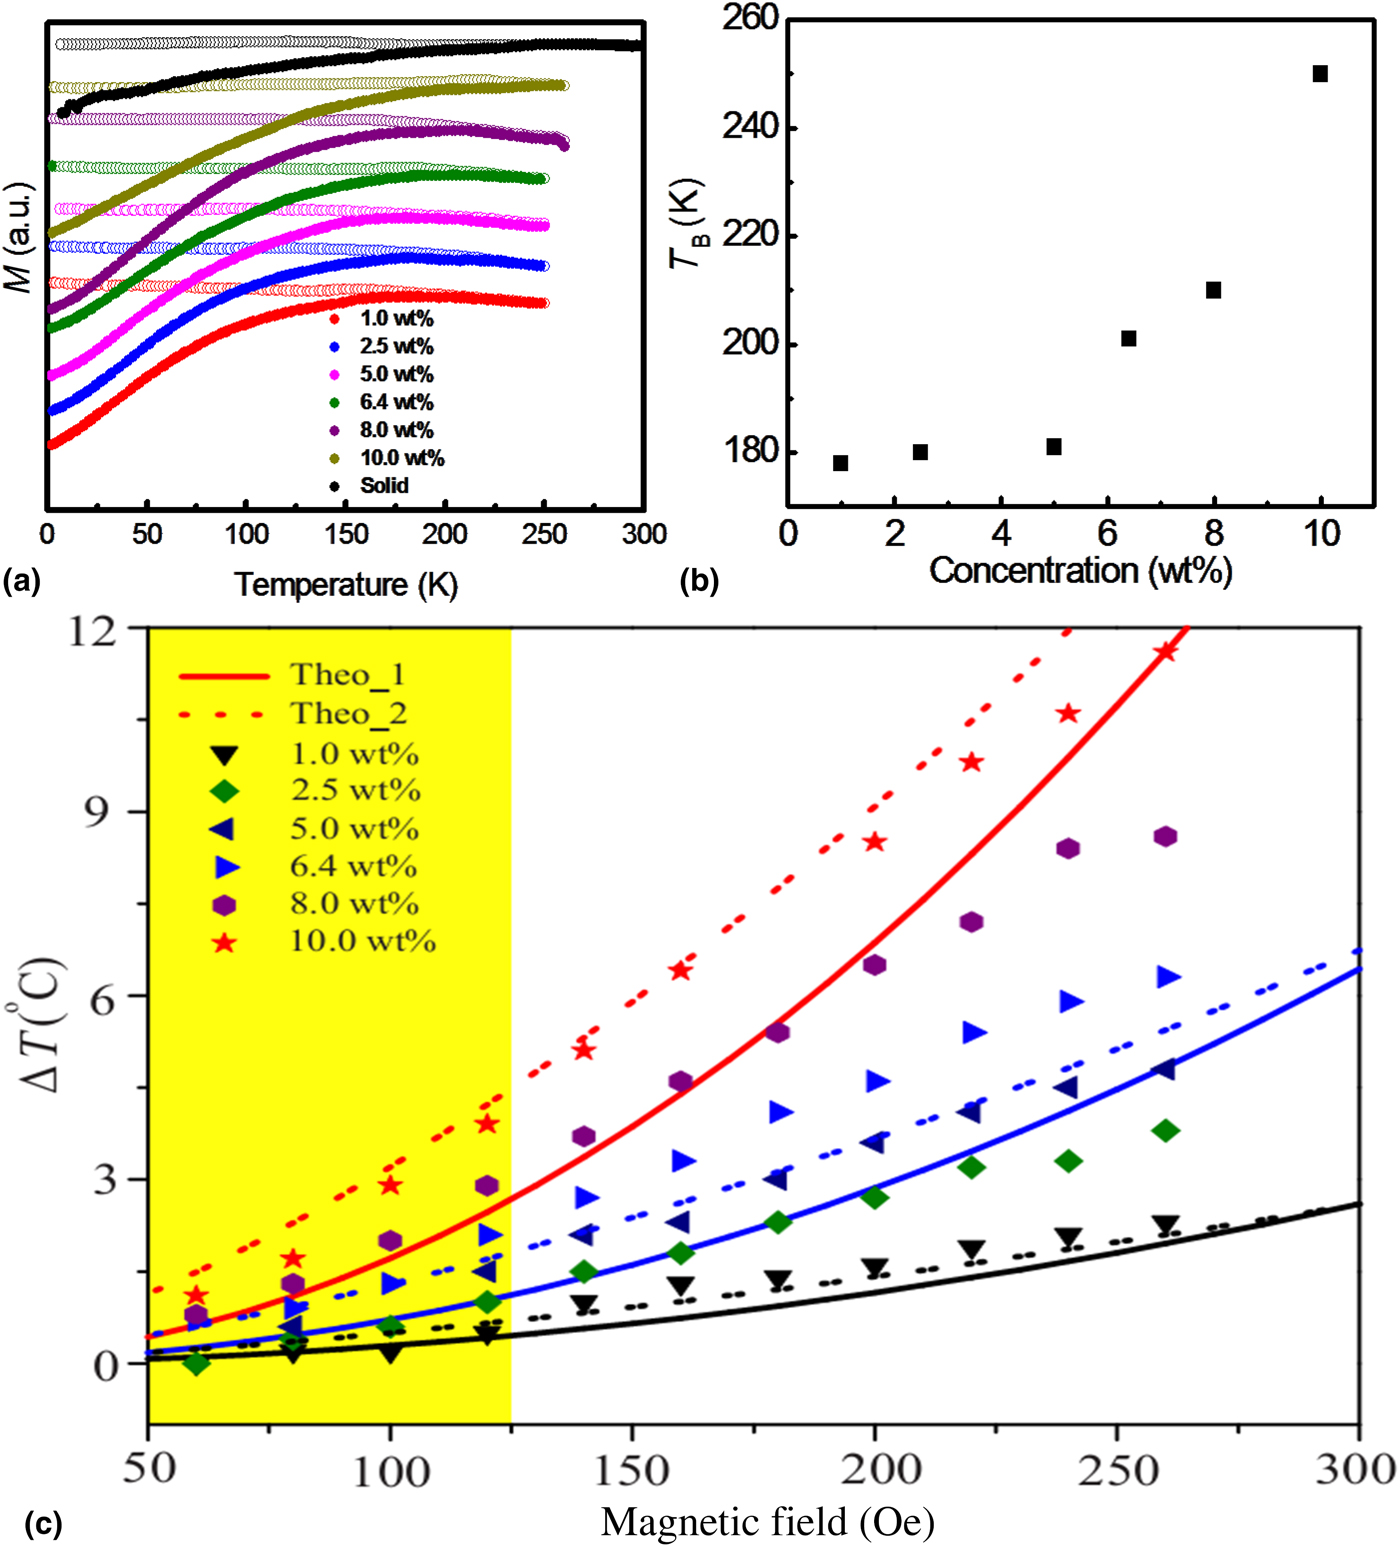
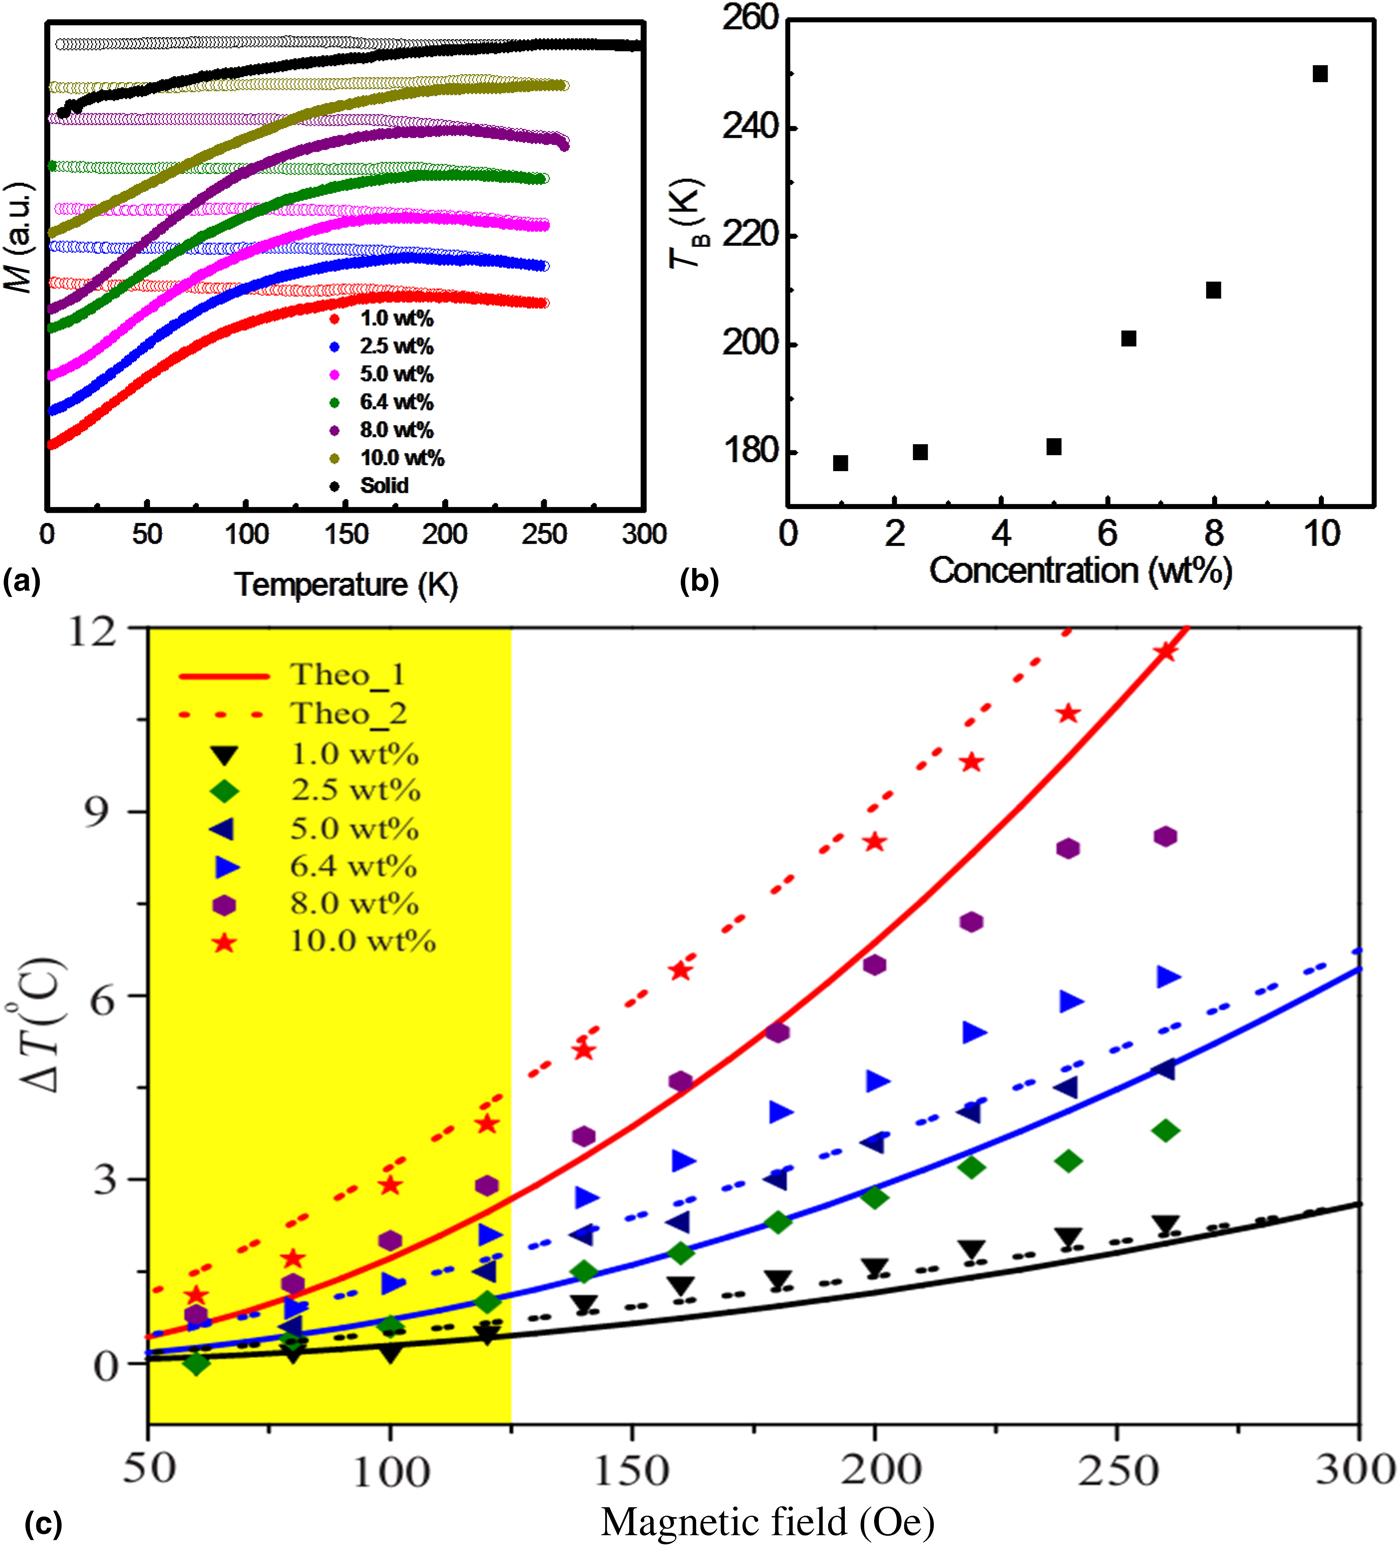
Magnetic fluid samples of six different concentrations (1.0, 2.5, 5.0, 6.4, 8.0, and 10.0 wt%) were prepared by dispersing citric acid-coated magnetite nanoparticles in distilled water. The magnetic measurements of the prepared fluid samples show the decrease in blocking temperature with increasing the dilution of the particles in fluid. Moreover, the observed blocking temperature for the fluid samples is less than the blocking temperature of the solid sample (259 K) as shown in Fig. 3(a). Although the dispersed nanoparticles in the fluid are same for all fluid samples (same particle size, distribution, and surfactant amount) of different concentrations, the observed difference in the blocking temperature could be due to the changes in the anisotropy contribution due to the interparticle interaction. The decrease in the interparticle interaction with the dilution leads to a decrease in the anisotropy energy of the system, which in turn leads to a decrease in the blocking temperature of the system.[Reference Vargas, Nunes, Socolovsky, Knobel and Zanchet24] The variation of the blocking temperature with the concentration of the particles is shown in Fig. 3(b).
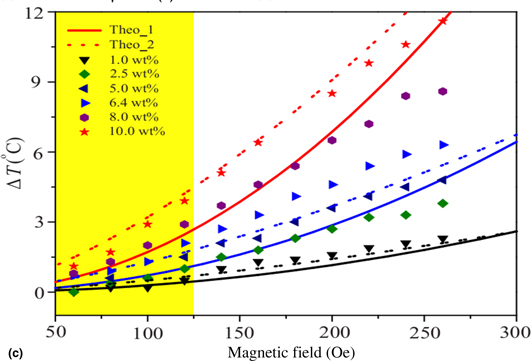
(a) Temperature-dependent magnetization studies of prepared fluid samples are compared with the solid sample. The closed circles are the zero field cooled and the open circles are the field cooled measurements. (b) Variation of blocking temperature with the concentration of the particles in the fluid. (c) Temperature rise with the applied magnetic field at constant time of 100 s. Scatters are experimental data for different concentrations. Solid lines are theoretical calculation based on Eqs. (2) and (2) at the same concentration of the experiment. Dashed lines are theoretical calculations based on Eqs. (2) and (3).
Hyperthermia measurement data and discussion
Hyperthermia measurements for the fluid samples were done using the DM100 nB nanoScale Biomagnetics system at the magnetic field strength of 60–260 Oe at 20 Oe interval and at constant frequency (101 kHz). The temperature rise of the magnetic fluids with time at the AC field of 260 Oe and the frequency of 101 kHz is shown in Supplementary Fig. S4. The temperature rise increases almost linearly with the time for all the studied concentrations. The increase in the temperature of the fluid with time is attributed to the heat dissipation of the magnetic nanoparticles in the fluid. Since the magnetic nanoparticles in fluid are the source of the energy absorption from the field, there is possibility of more and more energy absorption and releases as heat at higher concentration. Moreover, when the concentration of the fluid increases, the particles in the fluid are closer together, and this could lead to increase in interparticle magnetic interaction. Due to the increased interparticle interaction at higher concentration, there is a possibility of the formation of clusters, and this could lead to the increase in the anisotropy energy of the system which is clear from the magnetic measurements, i.e., an increase in blocking temperature with the concentration of the particles. The increase in the anisotropy energy of the system could lead to an increase in the relaxation time of the particles in the fluid.
We also studied temperature rise in the magnetic fluids at the applied magnetic field of strength 40–260 Oe at 20 Oe interval for all the concentrations. The temperature rise of the magnetic fluid sample of 10 wt% at the applied magnetic field of different strength (40–260 Oe at 20 Oe interval) is shown in Supplementary Fig. S5. The temperature rise increases almost linearly with time for all the studied magnetic fields. Moreover, the temperature rise increases with increasing the magnetic field strength due to the increase in the energy absorption by the nanoparticles with the field. Figure 3(c) shows the temperature rise, ΔT, with the applied magnetic field (H) at 100 s duration for all the studied concentrations. ΔT changes with applied field and H is very low for 1–5 wt% of nanoparticles; however, ΔT sharply increases at 8 and 10 wt% of nanoparticles at low applied field. To understand sharp enhancement of ΔT at higher particle concentrations, we have calculated the two dominant relaxation times and calculated the theoretical ΔT with applied field. The total relaxation time (τ) of the nanoparticle in a fluid is the sum of the Neel's and Brownian relaxation of the particles.[Reference Kotitz, Fannin and Trahms25] The Brownian relaxation time (τ B) of the particles in fluid is calculated from the hydrodynamic diameter (d h) of the particles, using τ B = 3ηV hyd/k BT, where η is the dynamic viscosity, V hyd is the hydrodynamic volume, k B is the Boltzmann constant, and T is absolute temperature. The calculated τ B is 1.3 × 10⁻⁶ s. The Neel's relaxation time of the particles in fluid is calculated from the blocking temperature (T B) obtained from the zero field cooled (ZFC) magnetization measurements of the fluid samples of all studied concentrations (as shown in Fig. 3) and the measurement time of the instrument following.[Reference Armijo, Brandt, Mathew, Yadav, Maestas, Rivera, Cook, Withers, Smolyakov, Adolphi, Monson, Huber, Smyth and Osinski26] The calculated Neel's relaxation time (τ N), Brownian relaxation time (τ B), and total relaxation time (τ) for all concentrations are given in Supplementary Material.
After the magnetic energy converted into thermal energy, the temperature rise ΔT can be calculated using the following equation[Reference Van Vleck27,Reference Wadehra, Gupta, Prakash, Sharma and Chakraverty28] :
 $$\Delta T = \displaystyle{{\mu _0VH^2} \over {C_{{\rm nf}}m_{{\rm nf}}}}f\,{\chi} ^{\prime \prime}$$
where μ 0 is constant permeability, V is the total volume of nanoparticles, C nf is the nanofluid heat capacity, m nf is the mass of nanouid, f is applied frequency, and χ″ is the dynamic susceptibility. Now, χ″ can be calculated using the Debye model.[Reference Chalopin, Bacri, Gazeau and Devaud19,Reference Van Vleck27]
 $${\chi} ^{\prime \prime} = \displaystyle{{VM_{\rm s}^2} \over {k_{\rm B}T}}\displaystyle{{\omega \tau} \over {1 + \omega ^2\tau ^2}}$$
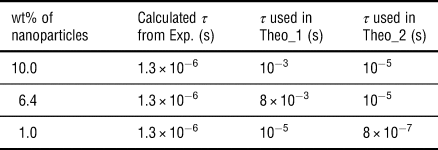
where M s is the saturation magnetization, and the intrinsic relaxation time, τ = τ 0Exp[KV np/k BT], K = 2.965 × 10⁵ J/m3 is the anisotropy constant, and V np is the volume of nanoparticle. The theoretical ΔT calculated with Eqs. (1) and (2) is shown in Fig. 3(c) as a solid line. We have found that although at lower concentration, there is good agreement between experimental data and theoretical values, at higher concentration, theoretically calculated ΔT is very low as compared to experimental values. There is also a large difference in relaxation time values of experimentally calculated and theoretically fitting values as listed in Table I. Although Brownian relaxation dominates for the calculation using Eqs. (1) and (2), very high relaxation time is required to describe the thermalization process (see Table I).
Total relaxation time obtained from experimental calculation and theoretical values used for ΔT calculation.

Recently, few groups[Reference Klik, McHugh, Chantrell and Chang17,Reference Mørup, Hansen and Frandsen29] suggested that Debye's model failed to explain the dipole–dipole interaction in case of highly concentrated magnetic nanoparticles in fluid. When the nanoparticles are close to each other, they may behave like a spin memory glass.[Reference Klik, McHugh, Chantrell and Chang17] Depending on the temperature and applied magnetic field, spin orientation will change and it can have ferro-magnetic or antiferromagnetic ordering.[Reference Klik, McHugh, Chantrell and Chang17,Reference Mørup, Hansen and Frandsen29] For a memory spin glass-type system, we can modify χ″ as,
 $${\chi} ^{\prime \prime} = \displaystyle{{VM_{\rm s}^2} \over {k_{\rm B}T}}\sqrt {\displaystyle{{2k_{\rm B}T} \over {\mu _0HM_{\rm s}V_{{\rm np}}}}} \displaystyle{{\omega \tau} \over {1 + \omega ^2\tau ^2}}$$
ΔT calculated with Eqs. (2) and (3) has shown as a dashed line in Fig. 3(c). For the higher concentration of nanoparticles, our model has much better agreement with experimental measurement. Anti-ferro magnetic ordering of intrinsic spin of nanoparticles influences the magnetization and thermalization process. So, instead of H 2, the T varies as H 3/2 for closely packed superparmagnetic nanoparticles. Theoretically fitted is also close to experimentally calculated values (see Table I). We also observed that temperature rise is dominant by H 3/2 dependence for low applied field (<200 Oe); however, in case of higher field (>200 Oe), it still have the H 2 dependence. As shown in Ref. Reference Atkinson, Brezovich and Chakraborty30, upto 125 Oe is safe clinical limit at 101 kHz frequency (clinical limit of applied magnetic field is shown by the yellow-shaded region in Fig. 3(c)), and temperature rise is rapid in this low applied field range compared to high field range for the high concentration of nanoparticles. Though there is a debate, how temperature rise will be changed for closely packed nanoparticles.[Reference Chalopin, Bacri, Gazeau and Devaud19] We have observed here that interparticle interaction will be favorable for temperature rise and hyperthermia application.
Conclusions
In conclusion, we observed that temperature rise, ΔT, increases with applied field for higher concentration. ΔT has H 3/2 dependence for higher concentration and low applied field. In case of nanoparticle accumulation in hyperthermia, temperature rise will be much rapid for low applied field which is one of the main requirement for the hyperthermia studies, i.e., high temperature rise within the clinically allowed magnetic field limit. From our studies, it is clear that the interparticle interaction strongly influences the heating effect of magnetic nanofluids in clinically allowed field range. In our studies, we changed the concentration in order to alter the interparticle interaction. However, it is also possible to alter the interparticle interaction without increasing the concentration of the particles in fluid. The interparticle interaction can also be tuned by changing the anisotropy energy of the particles or by changing the surfactants on the surface of the nanoparticles. We believe that our studies will give the future directions in the investigation of the interparticle interactions on heating effect in the hyperthermia research.
Acknowledgments
The authors thank TMD/CERI/BEE/2016/082 for financial support. C.B. thanks S. Chakraverty for fruitful discussion on the theoretical modelling and A.S. acknowledges DST inspire fellowship DST/INSPIRE Fellowship/2017/IF170058 for support.
Supplementary material
The supplementary material for this article can be found at https://doi.org/10.1557/mrc.2019.83.