Introduction
There are fewer meteorological measurements in the interior of Antarctica compared to coastal areas, and hence relatively few studies of snow/ice-atmosphere interaction on the continent. Automatic Weather Stations (AWS) provide long-term unmanned observations in remote areas and where the weather is extremely adverse. In the past two decades, about 100 AWS have been deployed in different regions of Antarctica to form local networks. Many of those were operated as part of large United States networks on the Ross Sea Ice Shelf and elsewhere (e.g. Stearns & Savage Reference Stearns and Savage1981), but others were contributed by Australia in East Antarctica, Japan in eastern Dronning Maud Land (Enomoto et al. Reference Enomoto, Warashina, Motoyama, Takahashi and Koike1995), and the Netherlands in western Dronning Maud Land (Reijmer & Oerlemans Reference Reijmer and Oerlemans2002). These AWS provide large volumes of Antarctic climate data which can contribute substantially to the study of Antarctic weather and climate, including the relationships of surface temperature, pressure and wind to ice sheet terrain (e.g. Allison et al. Reference Allison, Wendler and Radok1993, Stearns et al. Reference Stearns, Keller, Weidner and Sievers1993, Allison Reference Allison1998, Renfrew & Anderson Reference Renfrew and Anderson2002). Automatic Weather Stations data have also been used to investigate ice/snow interactions with the atmosphere. Using four years of successive data from Dronning Maud Land, Van den Broeke et al. (Reference Van den Broeke, Reijmer and van de Wal2004, Reference Van den Broeke, Reijmer, van As, van de Wal and Oerlemans2005) described the seasonal variation of the surface energy balance, as well as its components, over different regions including the coastal area, the katabatic wind zone and the interior of the Antarctic plateau. As well as regional climate studies using AWS, the data have been used together with multi-year data from manned stations to estimate secular trends of surface temperature, pressure and wind speed for the whole of Antarctica (Turner et al. Reference Turner, Colwell, Marshall, Lachlan-Cope, Carleton, Jones, Lagun, Reid and Iagovkina2005).
Some problems arise with AWS (e.g. data gaps owing to icing/riming on the sensors and errors inherent in unmaintained radiation sensors or with inadequate ventilation of air temperature sensors), but the applicability of Antarctic AWS data have been confirmed by comparison with the data from manned stations (e.g. Allison & Morrissy Reference Allison and Morrissy1983).
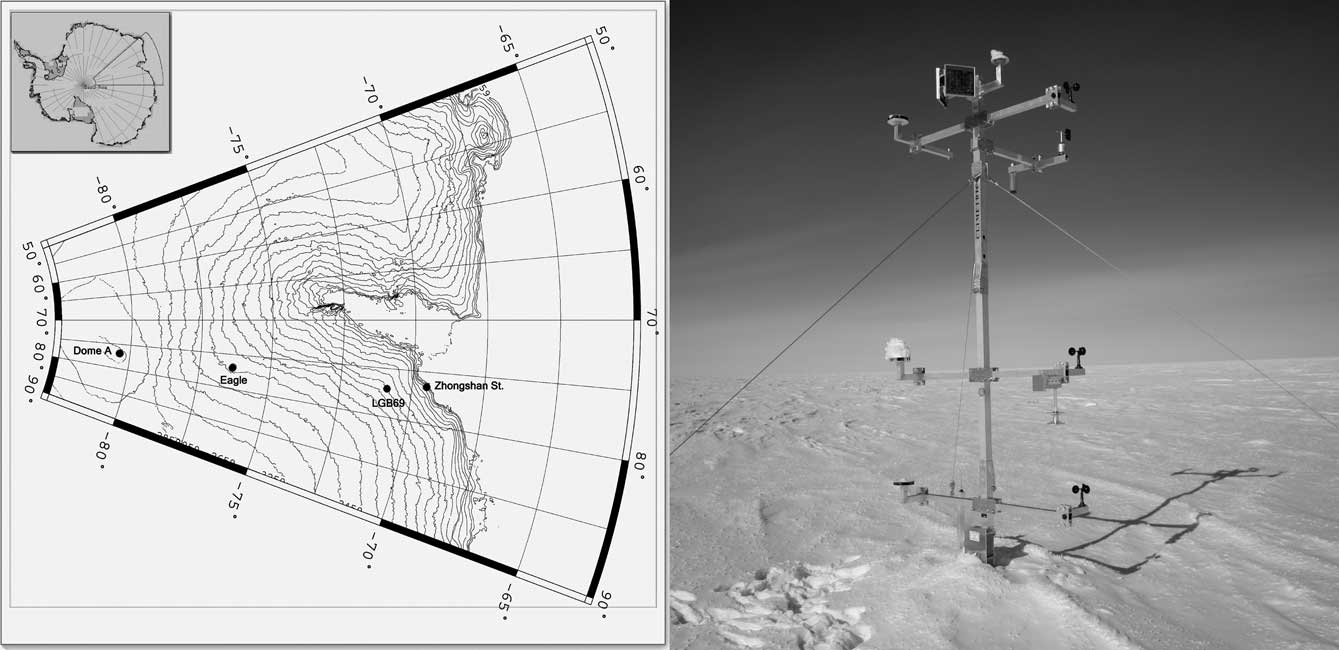
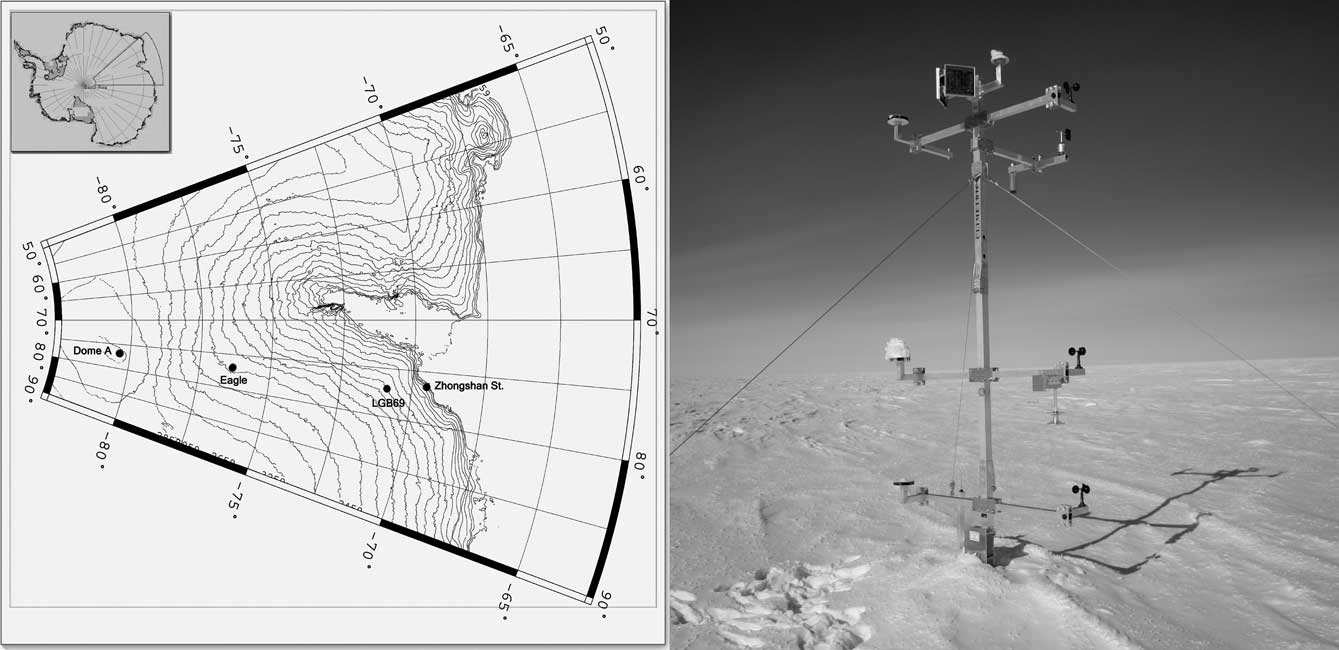
In this paper we use data from three AWS (LGB69, Eagle and Dome A, see Fig. 1) deployed during 2002–05 between Zhongshan Station (ZS) and Dome A (the summit of the East Antarctic ice sheet). The locations and site characteristics for these stations are given in Table I. The AWS are operated collaboratively by China and Australia, and data from them supplement data from another network in the Lambert Glacier basin, north of 76.4°S (Allison, Reference Allison1998).
Topography and AWS locations along the CHINARE traverse route from ZS to Dome A (left) and the AWS at Dome A (right). The other AWS have similar designs.
Location and site characteristics of sites in this study.

Chen et al. (Reference Chen, Bian, Xiao, Lu and Allison2007) have used data from LGB69 AWS to discuss the annual variation of atmospheric parameters in the near-surface layer over Princess Elizabeth Land in the East Antarctic, and compared the results to those from ZS. Xiao et al. (Reference Xiao, Li, Hou, Allison, Bian and Ren2007) and Hou et al. (Reference Hou, Li and Xiao2007) studied the annual mean temperature (represented by the firn temperature at 10 m depth) and the annual mean snow accumulation over Dome A, reporting values of -58.3°C and < 16 mm water equivalent (w.e.), respectively. Xiao et al. (Reference Xiao, Li, Allison, Hou, Dreyfus, Jean-Marc, Ren, Bian, Zhang and Kameda2008) analysed the ice sheet characteristics and surface climate on Dome A using ice core records and AWS measurements, and showed that Dome A is a potential site for providing the oldest undisturbed ice-core palaeoclimate record.
Automatic weather station measurements and data analysis
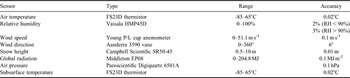
Zhongshan Station is the second Chinese Antarctic station, established in 1989 in the Larsemann Hills, Prydz Bay, less than 2 km from the edge of the Antarctic ice sheet. Conventional surface meteorological observations have been made there since then. LGB69, Eagle and Dome A AWS were installed on the ice sheet in Princess Elizabeth Land, East Antarctica in January 2002 and January 2005 during the 18th and 21st Chinese Antarctic Research Expeditions (CHINARE). The three AWS have made continuous observations since their deployment. Their locations on the traverse route are shown in Fig. 2. These AWS were designed by the Australian Antarctic Division and individually calibrated before deployment. They measure air temperature at nominal heights above surface of 1, 2, and 4 m, wind speed at 1, 2, and 4 m, wind direction at 4 m, atmospheric pressure, global radiation, and firn temperatures at nominal depths of 0.1, 1, 3, and 10 m, as well as snow surface height (SSH). Table II lists the major sensors and their resolutions. Sampling frequency is once per hour and the data are transmitted in real-time through the Data Collection System (DCS) on the ARGOS supporting satellite. The data can be directly downloaded from the ARGOS website through FTP. In this study, we also made use of data from some other Antarctic stations provided by the SCAR READER (REference Antarctic Data for Environmental Research) project (http://www.antarctica.ac.uk/met/READER/) and the Australian Antarctic Automatic Weather Station Dataset (http://aws.acecrc.org.au/).
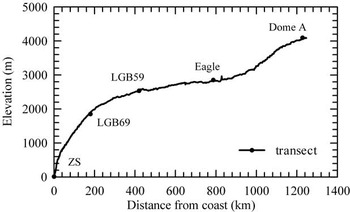
Elevation along the CHINARE traverse route from ZS (at the coast) to Dome A. LGB59 is an Australian AWS (73°27′S, 76°47′E, 2537 m a.s.l.) 420 km from the coast.

Specifications of the AWS used in this study. Dome A is slightly different (see Xiao et al. Reference Xiao, Li, Allison, Hou, Dreyfus, Jean-Marc, Ren, Bian, Zhang and Kameda2008).

The CHINARE traverse route is approximately along 77°E longitude, and stretches from sea level at ZS to the summit of the inland plateau at Dome A by way of the low-lying coastal zone, an escarpment region (where katabatic winds prevail), a low surface-slope area on the plateau (between c. 2000 and 3000 m elevation), and the interior of Antarctic plateau (elevation > 3000 m). The AWS are distributed over these representative surface features (see Fig. 2) and consequently include almost all the climate types in East Antarctica.
This paper presents the near surface climate using data from ZS and the three AWS from January 2005–December 2007. The data were filtered to eliminate anomalous values due to ARGOS transmission errors, and uncertain data during the first few days of AWS operation were also eliminated. The effects of sensor height change due to snow accumulation or ablation were removed by correcting the observed air and snow temperatures to a real height/depth relative to the snow surface. This correction was made using a temperature profiling method for air temperature (Ma et al. Reference Ma, Bian, Xiao and Allison2008) and Delaunay triangulation (Lee & Schachter Reference Lee and Schachter1980) with the linear interpolation method for firn temperature. That is, the 4-level firn temperature time series was converted into the Delaunay triangular mesh, onto which interpolation was undertaken for correction. Since the measured wind speeds are of lower quality, the change of height had little effect on wind speeds and no correction was made. Zero wind speed values that occurred because of icing/riming of the sensors in the winter were deleted. The Vaisala relative humidity sensors exhibit a large negative bias at low temperatures, and we corrected the relative humidity with respect to ice instead of water when temperatures were < 0°C using the method of Anderson (Reference Anderson1994). For LGB69, only data for 2002–04 were utilized because the observations since 2005 were influenced heavily by snow accumulation.
Meteorological conditions
Annual mean and interannual variability
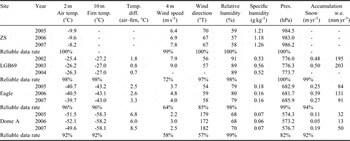
The AWS have provided us with a fairly complete three-year dataset (except for LGB69, see below). The records so far are too short to study atmospheric variability caused by factors such as El Niño and the Southern Oscillation (ENSO) or the Southern Annular Mode (SAM), and only short-term interannual variability of meteorological elements are addressed here. Table III presents annual averages of the meteorological variables for all sites along the CHINARE traverse route. The missing days in January 2005 (Dome A and Eagle), January 2002 (LGB69) and August–December 2004 (LGB69) were replaced with corresponding days of the following year. This results in an addition of 1.5% data to Dome A, 2.5% to Eagle, and 16% to LGB69 in the three year record.
Annual mean meteorological data for the sites along the ZS–Dome A traverse route.

Data gaps in the annual averages are indicated by -.
Air temperature
In general, the annual mean air temperature decreases with elevation: from the near-sea level ZS (14.9 m a.s.l.) to Dome A (4093 m a.s.l.) the annual mean temperature at 2 m above the surface (T a) dropped from -9.2 to -51.6°C. However, this is not representative of all parts of the Antarctic. Van den Broeke et al. (Reference Van den Broeke, Winther and Isaksson1999) and Bintanja (Reference Bintanja2001) showed that air temperature increased with elevation in some regions of Dronning Maud Land. In our analysis, however, no such phenomenon was revealed.
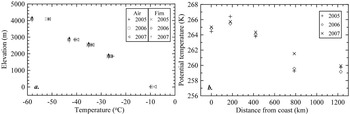
Budd et al. (Reference Budd, Jenssen and Radok1971) found the temperature change with surface elevation (the topographical lapse rate) on the ice sheet and defined three distinct regions. Near the coast, the topographical lapse rate approximates the dry adiabatic value of 1°C 100 m-1, but further inland, on the escarpment region where the ice sheet surface slope is steeper, the annual lapse rate increases to twice the adiabatic value. Still further inland, on the central plateau, it drops again to half the adiabatic value or less (Allison et al. Reference Allison, Wendler and Radok1993). Figure 3a shows the annual mean temperature and 10 m firn temperature as a function of altitude along the traverse route. The regions noted by Budd et al. (Reference Budd, Jenssen and Radok1971), occur in these data with a lapse rate of 0.91°C 100 m-1 from ZS to LGB69 where katabatic winds prevail. The value increases to 1.19°C 100 m-1 between LBG69 and LBG59, and continues to increase with elevation from the zone of steepest terrain to the interior, reaching 1.97°C 100 m-1 between LGB59 and Eagle, almost twice the adiabatic rate. The surface slope reduces and the lapse rate declines from Eagle inwards to Dome A (0.89°C 100 m-1).
a. Annual mean air temperature (2 m above surface) and firn temperature (10 m depth) as a function of surface elevation, b. annual mean potential temperature as a function of distance from the coast. Data from the Australian AWS LGB59 have been included.

Figure 3b shows the change in potential temperature as a function of the distance from the coast, indicating that the annual mean potential temperature increases to a maximum where the slope and the surface wind speeds are highest. This feature also occurs in other regions of East Antarctica (e.g. Van den Broeke et al. Reference Van den Broeke, Winther and Isaksson1999), and can be attributed to the katabatic wind which enhances vertical mixing and reduces the strength of the surface temperature inversion. This results in large sensible heat fluxes warming the surface and relatively high potential temperatures (Van den Broeke et al. Reference Van den Broeke, Winther and Isaksson1999).
The data presented in Table III show that the mean annual temperature variability between 2005 and 2006 is small at all the stations (only about 0.5°C), but in 2007 they were warmer than the previous two years (about 1.6, 0.9 and 0.6°C for ZS, Eagle and Dome A, respectively). This was also the case for other stations in East Antarctica, e.g. Mirny (66°33′S, 90°01′E, 39.9 m a.s.l.), Progress (69°23′S, 76°23′E, 64 m a.s.l.), Scott (77.9°S, 166.7°E, 16 m a.s.l.) and Vostok (78.5°S, 106.9°E, 3490 m a.s.l.). The annual mean temperature in 2007 at these stations (-9.4, -6.5, -17.7 and -53.2°C, respectively), was about 1.8, 2.0, 1.9 and 1.3°C warmer than the previous two years. This large-scale short-term warming phenomenon may be most probably associated with the interannual variation of near-surface temperature in East Antarctica, which we are unable to determine in this study due to the lack of observations.
Firn temperature
The firn temperature at c.10 m depth (T 10 m) is often used on the ice sheet as an approximation for the long term annual mean surface air temperature. At this depth the amplitude of the annual temperature wave is less than 5% of the surface value. As shown in Table III, T 10 m decreases as a function of increasing elevation and distance from the coast similarly to the mean annual air temperature (Ta). The mean value of T 10m over 2005–07 was -27.1, -43.1 and -58.2°C for LGB69, Eagle and Dome A, respectively. However, T 10m is consistently lower than Ta at all sites, with a difference between Ta and T 10m of 1.1, 2.8 and 6.6°C for the three AWS. This occurs because the persistent surface inversions over the Antarctic ice sheet result in the snow surface temperature (which determines T 10m) being considerably colder than the air a few metres above the surface.
The surface inversion is particularly extreme at Dome A compared to the other sites where stronger average wind speed enhances the vertical mixing of air in the near-surface layer, weakening the inversion. At Dome A the air temperature profiles measured by the AWS frequently show temperature differences between the 1 m and 2 m level (and between 2 m and 4 m) which average between 1.5°C and 2.5°C from March–October. The monthly average inversion strength measured by the air temperature sensors has a strong seasonal pattern, increasing from zero in January, and is of similar shape and magnitude in all years. The 3-yearly average difference between T a (-51.6°C) and the 0.1 m firn temperature (T0.1m, -56.6°C), which approximates the snow surface temperature over the period, was 5°C.
Snow accumulation
The AWS measure changes in the height of an acoustic ranger above the surface (snow surface height, or SSH). This provides information on surface net balance processes such as snowfall, snow transportation by drift, sublimation, deposition, and densification of the snow pack (e.g. Reijmer & Van den Broeke Reference Reijmer and van den Broeke2001). Because snow accumulation often occurs during strong winds, it can be difficult to assess whether an individual accumulation event is due to snowfall or snow drift transportation, or whether an increase in SSH is due to densification or ablation. But on an annual or longer time scale we assume that changes in SSH are due primarily to net accumulation of snow. Table III presents annual mean accumulation estimated from the annual mean SSH changes and converted to water equivalent using the measured surface snow density at each site. For LGB69, Eagle and Dome A the annual mean accumulation is 0.49, 0.30, and 0.11 m of snow, respectively, equivalent to 199, 102, and 31 mm w.e. yr-1. Accumulation decreases with altitude and distance from the coast, in agreement with the common pattern of Antarctic accumulation and, for this region of East Antarctica, with Ren et al. (Reference Ren, Xiao and Allison2002). The year-to-year variability of accumulation is small for all the stations, differing by up to 0.14 m of snow, although part of this may be association with snowdrift transport.
Wind speed and direction
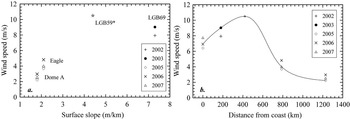
Figure 4 presents the annual mean wind speed as a function of surface slope and distance from the coast (at ZS). The annual mean wind speed is 7.0 m s-1 at the coastal station ZS. It increases rapidly with distance from the coast to 8.5 m s-1 at LGB69, which is the steepest region on the traverse route with a surface slope 7.3 m km-1. This is lower than the 10.5 m s-1 reported for LGB59, which has a 4.4 m km-1 surface slope (Allison Reference Allison1998). Because of icing/riming on the anemometers, some data are missing or recorded as zero, particularly during winter months and the yearly average wind speed may be underestimated. Further inland from LGB59, the surface slope diminishes and the average wind speed begins to weaken significantly. It is only 4.1 m s-1 at Eagle, and continues to decline to 2.2 m s-1 at Dome A where the terrain is very flat. Overall, the wind strengthens southward from the East Antarctic coast into the interior escarpment region, and then weakens gradually inland (Fig. 4b). This situation is similar to that in Adélie Land (King & Turner Reference King and Turner1997) and in accord with the pattern of wind speed for 600 km from the coast along 62°E in Mac. Robertson Land (Weller Reference Weller1969).
Annual mean surface wind speed a. as a function of surface slope, and b. as a function of distance from the coast. The annual mean wind speed at LGB59 is from 1994–96 (Allison Reference Allison1998).

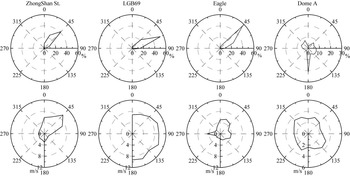
The wind direction roses for sites along the ZS to Dome A line are shown against both frequency and wind speed in Fig. 5. They show strong directional constancy at ZS, LGB69 and Eagle. At ZS, wind directions between north and east–north–east account for 85.7% of all occurrences, with north-east winds having the highest frequency (42.1%) and a mean velocity of 9.4 m s-1. The LGB69 wind direction is even more constant with a prevalence of east–north-east winds (54.1%) with an average speed of 9.7 m s-1. Directions between north-east and east account for 90.3% of the total. The dominant wind direction at Eagle is north-east (56.3%) with a mean velocity of 4.9 m s-1, and the secondary direction is east–north-east with a frequency of 25.2%. For Dome A the wind direction is more variable with southerly winds (21.2%) having the highest frequency with a mean wind speed of 2.4 m s-1, and with a broad spread of winds from other directions. These results are similar to those reported by Yang et al. (Reference Yang, Yin, Zhang and Jiang2007). The direction of prevailing winds at ZS, LGB69 and Eagle are in agreement with that of katabatic flows and these three stations are influenced by katabatic wind. The strongest katabatic wind occurs at LGB69 situated just downstream of the steepest slope region of the ice sheet. ZS is on the edge of the ice sheet and experiences a slightly weaker katabatic effect than at LGB69. Eagle is on the gentle slope in the interior and experiences only weak katabatic wind. For Dome A the irregular directions and weak winds demonstrate that there is no katabatic effect.
Wind direction/speed rose charts for all stations along the ZS–Dome A section.

Even more remarkable than the strength of the wind speed in Antarctica is the constancy of the wind direction (the directional constancy, dc, defined as the ratio of the magnitude of the mean wind vector to the scalar average wind speed). A dc value of 1.0 means that the wind blows from only one direction, whereas a value of 0.0 means that wind blows from opposite directions with equivalent strength and frequency. From the AWS observations, the annual mean dc is 0.86 for LGB69, 0.91 for Eagle, and 0.78 for Dome A. This is close to that reported by Rusin (Reference Rusin1964) with annual mean values of dc of 0.7–0.9 for the coast of East Antarctica, values close to unity for the slope of the plateau, and 0.7 or lower for the inland plateau (Xie et al. Reference Xie, Fan and Tian1991). Dome C (74.5°S, 123.0°E, 3280 m a.s.l.), Vostok, and South Pole (90.0°S, 2835 m a.s.l.) have dc values of 0.60, 0.81, and 0.79 (King & Turner Reference King and Turner1997), respectively, which are closer to that for Dome A (0.78). From the above analysis, the highest dc emerges in the strong katabatic wind zone with the steepest slope, but is lower in the interior of the Antarctic plateau.
Pressure
The interannual variability in the annual mean surface pressure presented in Table III is of the order of 4 hPa. For the period 2005–07, annual mean surface pressure was highest in 2007 and lowest in 2006 at ZS, Eagle and Dome A. This large-scale synoptic effect, perhaps influenced by modes of variability such as ENSO and the SAM, was similar at other stations in East Antarctica. For example, the yearly average surface pressure for 2005, 2006 and 2007 were 985.4, 983.2, and 986.9 hPa at the coastal station Progress, and 624.4, 623.7, and 626.1 hPa at the inland plateau station Vostok.
Humidity
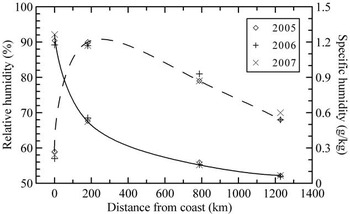
Figure 6 shows that the relative humidity increases rapidly from the coast to the interior of Antarctica, reaching 90% at LGB69 on the escarpment region, followed by a swift decline toward the inland plateau, with 69% at Dome A. The specific humidity initially decreases quickly from the coast and then reduces gradually towards the plateau. The annual mean specific humidity was 1.22, 0.54, 0.16, and 0.06 g kg-1 respectively, for ZS, LGB69, Eagle and Dome A. The value is significantly higher at ZS, which is under the effect of marine air masses throughout the year, and it is extremely low at Dome A where the ultra-low temperature greatly reduces the ability of air to carry moisture. The inter-annual variability in the annual mean relative humidity is about 2% for all the stations. However, the specific humidity variability is largest at ZS (c. 0.05 g kg-1) and is smallest at Dome A (c. 0.01 g kg-1).
Annual mean relative humidity (dotted line) and specific humidity (solid line) as a function of distance from the coast.

Seasonal cycle (annual variation)
Air temperature
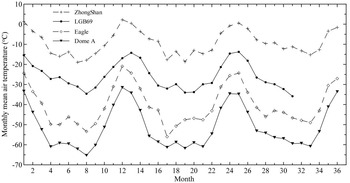
The monthly mean temperature for all the stations along the traverse line during the observation period is displayed in Fig. 7. Air temperature warms rapidly in early summer and cools rapidly at the end of it for all the stations, and is preceded and followed by smaller rates of temperature change. This is typical of the “coreless” winter temperature pattern (i.e. the winter temperatures do not have distinctive minima and the temperature traces are rather flat over winter months) in Antarctica. For ZS, the coldest month of the year had a monthly mean temperature warmer than -20°C during the observation period while the warmest month at the inland stations Eagle and Dome A is colder than -20 and -30°C, respectively. The coldest month at Dome A (August 2005) has a monthly mean air temperature of -65.3°C and was 2.8°C warmer than Vostok (-68.1°C) and similar to Amundsen-Scott (-65.2°C) at the same time. Although Dome A is 600 m higher in altitude and 1.5° higher in latitude than Vostok, the 2005–07 yearly mean temperature was 2.6°C warmer than that at Vostok (-51.6 vs -54.2°C). We believe that this difference is real, a result of large-scale atmospheric circulation over the Antarctic ice sheet, and not an artefact of the measurements. The consistent air temperature differences between the different levels and the regular pattern of seasonal change in inversion strength lends confidence to the accuracy of the temperature measurements. Because of its setting, near a region of surface flow divergence and upper air subsidence, the near surface air temperature is higher at Dome A than in areas where flow converges (such as Vostok).
Monthly mean air temperature for all the stations along ZS–Dome A section during 2005–07.

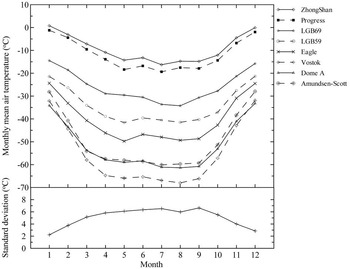
The seasonal cycle in air temperature at different latitudes (Fig. 8) shows that Vostok, Dome A, and Amundsen-Scott, (the inland plateau stations), have a coreless period between April and September, whereas the lower latitude stations have a coreless period that lasts only from about May–September. The corelessness is defined as the amplitude ratio of the second to the first harmonic of the annual temperature wave (Allison et al. Reference Allison, Wendler and Radok1993, Wendler & Kodama Reference Wendler and Kodama1993). For a typical coreless winter, the amplitude of the second harmonic is more than 25% of the first harmonic. The corelessness for ZS, LGB69, Eagle, and Dome A is 0.260, 0.273, 0.388, and 0.433, respectively. The Australian AWS at Law (66.73°S, 1366 m a.s.l.) and GF08 (68.49°S, 2120 m a.s.l.) have a corelessness of 0.276 and 0.295, marginally larger than that of ZS which is at a similar latitude but lower altitude. Dome C has a corelessness of 0.358 (Allison et al. Reference Allison, Wendler and Radok1993), similar to the value at Eagle. The corelessness increases from the coast to the interior of Antarctica as a function of increasing latitude and altitude.
Monthly mean air temperature (top) and the standard deviation of daily means within each month, shown as an average for all sites of the ZS–Dome A section (bottom). Latitudes of these sites are as follows: Zhongshan (69°22′S), Progress (69°23′S), LGB69 (70°50′S), LGB59 (73°27′S), Eagle (76°25′S), Vostok (78°27′S), Dome A (80°22′S), and Amundsen (90°S).

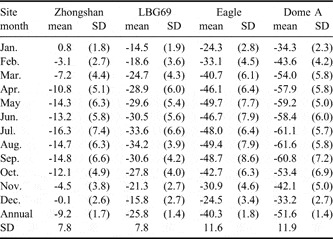
Air temperature in East Antarctica is a very variable element, especially in winter when the meridional and local vertical gradients are largest. The standard deviations (Fig. 8 and Table IV) show that the day-to-day temperature variability is much higher in winter than in summer. Warming or cooling of 10–20°C often occurs within a few days at ZS, LGB69, Eagle, and Dome A. Using the observations from six AWS around the Lambert Glacier basin, Allison (Reference Allison1998) noted exceptional warming events are a widespread feature over the region, with surface temperatures rising by 20°C or more for two or three days during high-pressure/high-wind-speed events in June and July. Likewise, air temperature changes of 20–30°C within a few days are not uncommon and often measured at several stations almost simultaneously over Dronning Maud Land (Reijmer & Oerlemans Reference Reijmer and Oerlemans2002). These large changes in temperature often coincide with changes in wind speed and direction and may be due to passing low pressure systems advecting the relative warm and moist maritime air to the south. The short-term warming events are mainly related with the high pressure or high wind speed. These extreme air temperature warm events are at least partly due to a weakening of the surface inversion, for example from subsidence of warmer upper air (Wendler & Kodama Reference Wendler and Kodama1993) or turbulent mixing, which weakens the surface inversion with increased wind speed.
Monthly mean temperature (°C) and standard deviation (SD) for all sites along ZS–Dome A section.

The mean monthly temperatures and their standard deviations for the record period of each station are given in Table IV. The summer temperature has a pronounced maximum in January for all the stations except Dome A, where it occurs in December. Because of the coreless winter, the lowest temperature was recorded in different months during different years. The temperature variation characteristics during March–May and September–November are similar to those in winter (June, July, August), evidencing the short Antarctic summer (e.g. Schwerdtfeger Reference Schwerdtfeger1970). Dome A at an altitude of 4093 m, has a mean annual temperature of -51.6°C, a mean summer temperature of -43.4°C, a mean temperature of the warmest month (December 2005) of -31.5°C, and eight months (between March and October) with the monthly mean temperature below -50°C. The summer is limited to times of relatively high solar elevations, especially in December and January, and already by February there is a cooling of c. 10°C. The mean temperature of winter half year (April–September) is -59.8°C. The coldest temperature yet recorded at Dome A has been -82.5°C (27 July 2007), which is warmer than the record cold of -89.2°C at Vostok (26 August 1982), and warmer than the lowest of -84.6°C observed at Dome C (Allison et al. Reference Allison, Wendler and Radok1993). This may be associated with the observational period being too short to record a minimum temperature lower than that of Vostok or alternatively Dome A is not the coldest region of the earth.
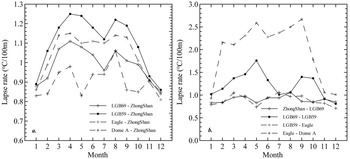
Figure 9 presents the seasonal variation of the topographical lapse rate of temperature between ZS and other AWS sites and between neighbouring sites. The average topographical lapse rate in midsummer (December and January) between ZS and all the AWS sites is c. 0.8–0.9°C 100 m-1, slightly lower than the adiabatic value of 1°C 100 m-1 (Fig. 9a). In other months it is c. 0.1–0.2°C 100 m-1 higher than the dry adiabatic value for all stations except Dome A. The lapse rates have dual maxima in April and August, one month earlier than that at the Lambert Glacier basin sites (Allison Reference Allison1998) and reach 1.25°C 100 m-1 between ZS and LGB59 during April. Figure 9b illustrates the topographical lapse rates over the differing terrains, i.e. coastal area, escarpment region, and inland plateau. The surface lapse rates of the three regions all approximate the dry adiabatic value during midsummer. In other months, the surface lapse rate approaches the dry adiabatic value over the escarpment region between ZS and LGB69. From LGB69 to the inland plateau site, Eagle, the surface slope decreases rapidly and the lapse rate becomes super-adiabatic, with a maximum of 2.67°C 100 m-1, more than twice the adiabatic value, between LGB59 and Eagle in September. The surface lapse rate reduces to the near-dry adiabatic value from Eagle to Dome A. Similar patterns occur in the annual mean temperature (Fig. 3a), and was also found over the ice sheet in Wilkes Land (Allison et al. Reference Allison, Wendler and Radok1993). The strength of the lapse rate decreased once the threshold slope exceeded 5 m km-1 (Allison 1998) because vertical turbulent mixing from stronger katabatic winds decreased the surface inversion strength.
a. Seasonal variation in the surface lapse rate between ZS and other AWS sites, b. surface lapse rate between the two nearest sites.

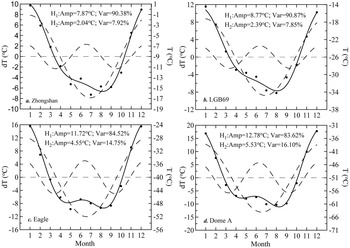
The observed annual cycle of air temperature as well as its first and second harmonic waves for all the stations along the traverse route from ZS to Dome A are displayed in Fig. 10. The total variance of the annual cycle in air temperature at all sites can be almost entirely (> 98%) explained by the first two harmonics, H1(T) and H2(T). Although the annual cycle is dominated by the first harmonic, the second harmonic is significant at the four sites, explaining 8–16% of the total variance. The sites can be grouped into three regions on the basis of their location, elevation, mean temperature, and seasonal temperature cycle: the East Antarctica coastal area (ZS); the East Antarctica strong katabatic wind zone, or escarpment region (LGB69); and the East Antarctica inland plateau region (Eagle and Dome A). The contribution that H1(T) makes to the variance of air temperature annual variation reduces from north to south. H2(T) explains 8% of the variance in the coastal area and escarpment region and increases to 16% on the plateau, with a greatly increased harmonic amplitude of 2.0–2.4°C in the coastal area and escarpment region to 4.5–5.6°C on the plateau. Van den Broeke (Reference Van den Broeke1998) also found that the percentage of variance of the annual temperature cycle explained by H2(T) is largest on the Antarctic Plateau (11–18%), with an amplitude of roughly 3.5–7.2°C, and less for the coastal East Antarctica (6–12%) with an amplitude of 1.9–2.9°C. The phases of H1(T) and H2(T) at ZS and LGB69 are nearly identical, as is the case between Eagle and Dome A, but with the phases about 10 days ahead of those at ZS and LGB69. This is associated with the different phase of biannual pressure oscillation at the different sites.
Monthly average temperature at a. ZS, b. LGB69, c. Eagle, and d. Dome A (dots, right axis) and the first and second harmonics (dashed lines) and their sum (solid line, left axis). The numbers are the amplitude and amount of variance explained by the two harmonics.

Pressure
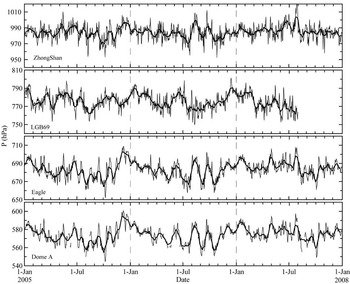
The daily mean surface pressure is variable on time scales from several days to months. This is shown in Fig. 11 for all the stations from January 2005–December 2007. The variations over several days are mainly due to meso-scale pressure systems (Parish Reference Parish1982). Figure 11 shows that the pressure variations at Eagle and Dome A are well correlated (r = 0.94), indicative of both sites being under the influence of the same large-scale synoptic system. Correlation between the high plateau station and LGB69 and ZS, and between the lower elevation stations, is lower (r ranges from 0.1–0.5), implying that these stations are more affected by local circulation than by a single large-scale system. For example, ZS and LGB69 are only 160 km apart, but their inter-diurnal pressures differ significantly perhaps associated with their markedly different topography.
Daily average surface air pressure at ZS, LGB69, Eagle, and Dome A. The thick lines represent smoothed curves (15 days running mean).

Variations at larger time scales are due to phenomena like the semiannual oscillation (SAO) in the pressure signal (Van Loon Reference Van Loon1972). The SAO is the main feature of southern hemisphere extratropical pressure variation (Van Loon Reference Van Loon1967). It consists of a twice-yearly expansion and contraction of the circumpolar pressure trough around Antarctica in response to differences in heat storage between Antarctica and the surrounding oceans. As a result, the surface pressure in middle and high latitudes shows a clear half-yearly wave. As reported by Van Loon (Reference Van Loon1972), and Van Loon & Rogers (Reference Van Loon and Rogers1984), the second harmonic explains 17–36% of the total variance of the annual cycle in surface pressure in the interior of west Antarctica and on the Antarctic Plateau, 36–68% along the East Antarctic coast, and almost 80% on the west coast of the Antarctic Peninsula. Further to the north, at the sub-Antarctic islands, both amplitude and explained variance decrease towards the minimum at 60°S.
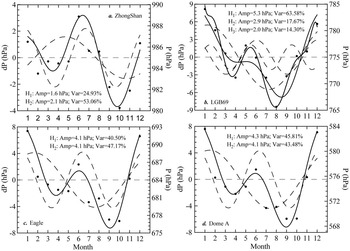
Figure 12 shows the annual pressure cycle together with the first, H1(P), and second, H2(P), harmonic for all the stations along the traverse route. The amplitudes of annual variation in surface pressure are between 9–18 hPa. A distinct SAO feature is seen at all the stations, with a predominant maximum in the summer (December and January), a secondary maximum in the winter (June), and the predominant smallest value in August or October with slight differences between stations. In contrast to air temperature, the dominant period of the pressure is generally not determined by the first harmonic (i.e. the annual oscillation signal). Only at LGB69 is the annual oscillation signal significantly stronger than the SAO, with the first harmonic accounting for 63.6% of the total variance. At the other sites, the contribution of first harmonic is close to, or lower than, the second harmonic for the annual cycle. From Fig. 12 we see that the explained variance of the first harmonic for the pressure annual cycle increases rapidly from 24.9% at ZS of the coastal area to 63.6% at LGB69 in the strong katabatic wind region (escarpment region), and then reduces towards the plateau to 41–46% at Eagle and Dome A. The amplitude also initially experiences an increase and then a decrease moving inland.
Monthly average surface pressure at a. ZS, b. LGB69, c. Eagle, and d. Dome A (dots, right axis) and the first and second harmonics (dashed lines) and their sum (solid line, left axis). The numbers are the amplitude and amount of variance explained by the two harmonics. At LGB69 the third harmonics and the sum of the first, second and third harmonics are also shown.

The contribution of the second harmonic to the annual pressure variation is opposite to that of the first harmonic. The contribution reduces to 17.7% at the escarpment region from 53.1% at the coastal area, followed by rapid increase to 43–47% on the plateau. This result is c. 10% higher than that presented in Van Loon (Reference Van Loon1972) and Van Loon & Rogers (Reference Van Loon and Rogers1984), which may be the result of interdecadal variation in the SAO, with a stronger SAO signal in 2005–07 than in 1957–80. The amplitude of the second harmonic increases gradually from the coastal area and escarpment (c. 2 hPa) to the interior of the plateau (c. 4 hPa).
At all the stations, the first and second harmonics together explain 79–89% of the total variance of the annual cycle in surface pressure. This is significantly smaller than the 96–99% indicated by Van den Broeke (Reference Van den Broeke1998), who used the harmonic method to analyse the surface pressure from 27 stations distributed all over Antarctica. Our result demonstrates that the shorter-term pressure variation also makes specific contributions to the annual variation. At LGB69 in particular, the third harmonic explains as much as 14.3% of the variance of the annual cycle, with the amplitude of 2.0 hPa, and the signal intensity near that of the second harmonic. For the other three stations, the third harmonic accounts for 3–4% of variance of the annual variation, with amplitudes of 0.6–1.1 hPa which, although rather weak, shows the existence of a 3-wave structure (seasonal oscillation). Comparing the phase difference between the second harmonic of temperature (Fig. 10) and pressure (Fig. 12), H2(T) is c. 10 days ahead of H2(P) at ZS, H2(T) is c. 10 days behind H2(P) at LGB69 and Eagle, and H2(T) and H2(P) are approximately coincident at Dome A. These differences can be explained by the different locations of the stations with respect to the average position of the circumpolar pressure trough.
Wind speed and direction
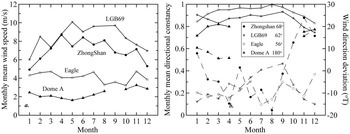
Figure 13 presents the annual variation of wind speed, directional constancy, and wind direction deviation, for all the stations along CHINARE traverse route. As seen in Fig. 13a there is distinct seasonal variation of wind speed for ZS and LGB69, where wind speed is considerably stronger in winter (April–September) than summer (October–March). This is explained by the weaker near-surface inversion that occurs in summer, leading to a weakened katabatic flow compared to the winter. At the inland plateau stations Eagle and Dome A, there is not much variability. The strongest wind occurs at the site with the greatest surface slope (LGB69) where the maximum of monthly mean wind speed exceeds 10 m s-1, followed at the coastal area (ZS) with the maximum monthly mean of 9 m s-1. The minimum wind speed is experienced on the inland plateau (Eagle and Dome A) with a range of 1.6–3.3 m s-1. This is because LGB69 is in a strong katabatic wind zone and ZS is downstream of this zone and so experiences the strong winds caused by katabatic flow compared to Eagle and Dome A where no katabatic flows form. In addition, the large-scale pressure gradient (which acts in the same direction, down the slope) has a significant effect on the forcing of near-surface winds in East Antarctica, especially in the escarpment region (Van den Broeke & Van Lipzig Reference Van den Broeke and van Lipzig2003). Figure 13b shows that at LGB69 and Eagle, the wind direction constancy is high and has relatively small annual variation, with the monthly mean range of 0.9–1.0 and 0.8–0.9, respectively, and is slightly higher in winter than summer. For Dome A, the monthly mean wind direction constancy ranges over 0.7–0.8, considerably lower than those of LGB69 and Eagle.
Annual variation of a. wind speed, and b. wind direction constancy (solid line), and wind direction deviation (dashed line). Inset numbers are annual wind direction at each site.

Humidity
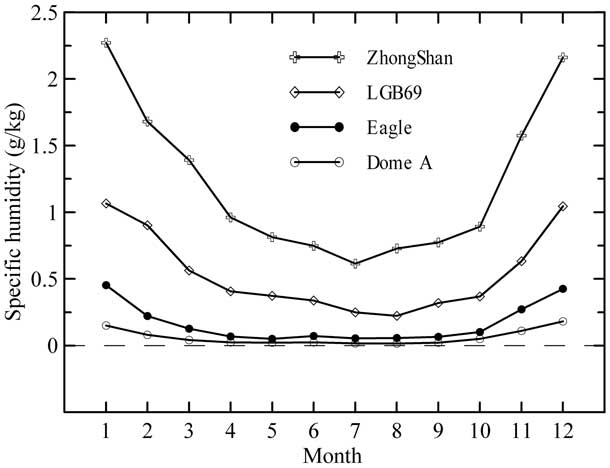
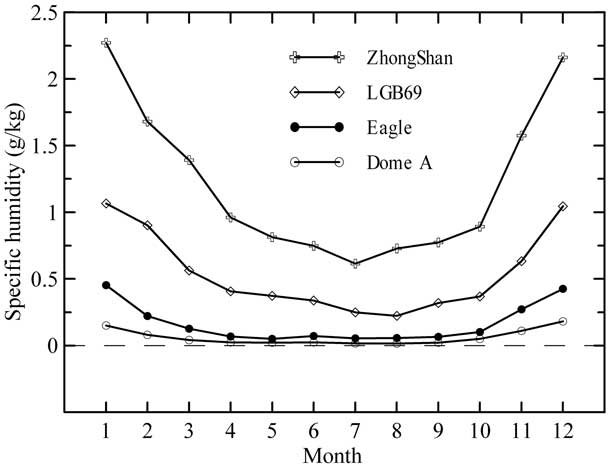
The annual variation in monthly average specific humidity is shown in Fig. 14. At all the stations, the maximum occurs in December or January, and the minimum is in July or August. The difference in mean specific humidity between any two adjoining stations is larger in the summer months (October–March of the next year) than in the winter (April–September) and particularly between ZS and LGB69. The maximum (minimum) difference in monthly mean specific humidity between these two stations reaches 1.21 (0.37) g kg-1 in January (July). LGB69 is 160 km further inland than ZS and at higher altitude, where air temperature is relatively lower, leading to the lower specific humidity. ZS is located on the coast and close to the open ocean and moist marine air in summer, but in winter, much of the sea nearby is frozen, thus greatly reducing vapour in the air, so that the difference in specific humidity between the two sites becomes very small (also see Chen et al. Reference Chen, Bian, Xiao, Lu and Allison2007). Eagle and Dome A situated in the inland plateau are barely affected by marine air mass, with the warmest monthly mean temperature < -20 and -30°C, respectively. Because of high elevation, away from the coast and cold temperatures, the annual specific humidity is extremely low throughout the year, with maximum (minimum) monthly mean specific humidity of 0.45 and 0.18 g kg-1 (0.05 and 0.02 g kg-1) for Eagle and Dome A, respectively.
Monthly mean specific humidity for all sites.
Accumulation
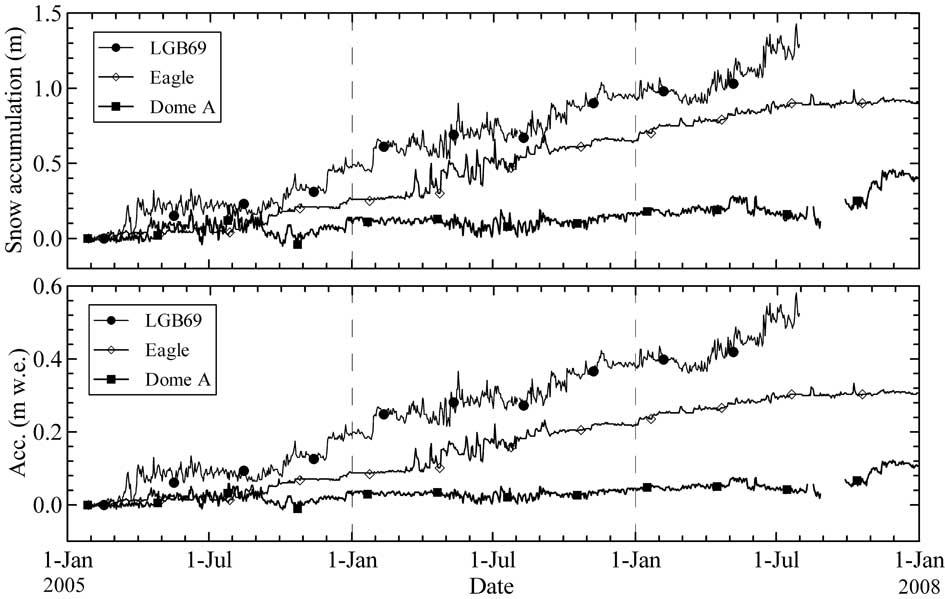
Global Climate Model (GCM) results suggest that, due to the nature of the accumulation events, at least five to ten years accumulation data are necessary to obtain a significant annual cycle for accumulation (Schlosser Reference Schlosser1999). Therefore our two or three years of accumulation measurements are not sufficient to determine seasonal patterns. The fact that most of the accumulation occurs in a few major events per year, not confined to a particular season, has serious implications for the analysis of, for example, the δ18O in ice cores (Schlosser Reference Schlosser1999). Figure 15a presents the time series of daily mean snow accumulation for LGB69, Eagle, and Dome A. The accumulation pattern for the few years of record we do have is similar for Eagle and Dome A. Between January and April in most years there appears to be a hiatus in accumulation with little change in snow surface height, and most of the accumulation occurs at other times of year. At both these sites there are large fluctuations in the snow surface height between about May and mid October during the coldest period. We suspect that these are due to problems with the sensors at very low temperature, and do not reflect real height changes. At LGB69, accumulation can occur at all times of year and there are no obvious periods of hiatus. Figure 15 shows that the snow accumulation at LGB69 typically occurs in four or five heavy snowfall events each year. There are fluctuations in snow surface height at all times of year at LGB69, many of which may be related to wind transport and the movement of surface sastrugi past the sensor, as well as to compaction after large, new snow falls.
Daily average changes in snow surface height (top) in metres of snow and (bottom) in metres of water equivalent. The surface height is arbitrarily set at 0 m on the first day.
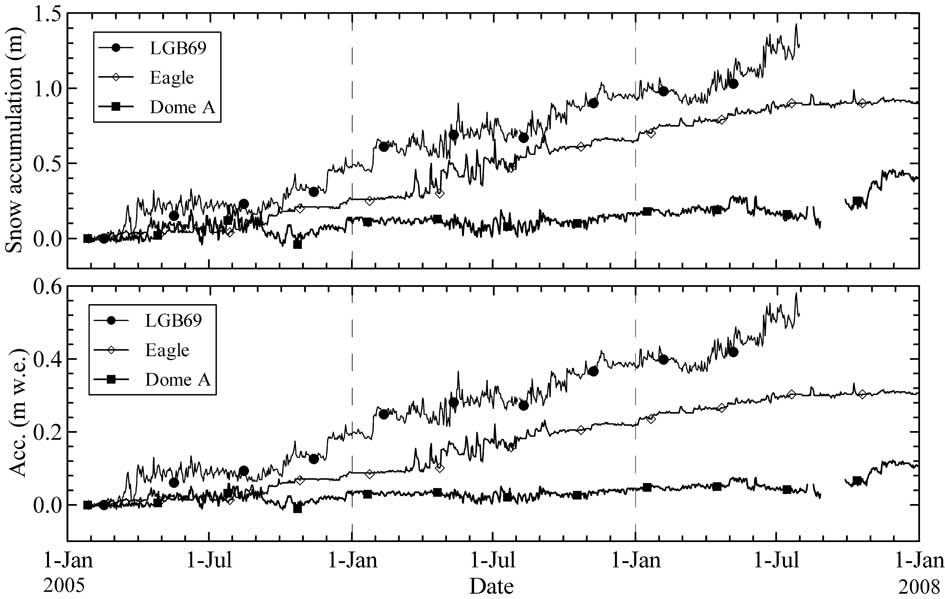
The measured in situ surface snow density at LGB69, Eagle and Dome A is 406.67, 336.67, and 265.56 kg m-3, respectively. The water equivalent accumulation record at the three sites calculated from these average densities is shown in Fig. 15b. The overall accumulation was 525 mm w.e. over two and a half years at LGB69, and 306 and 93 mm w.e. over the three years at Eagle and Dome A, respectively.
Snow temperature
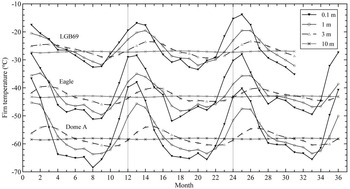
The time series of 2005–07 monthly mean snow temperatures for LGB69, Eagle, and Dome A are given in Fig. 16. This figure indicates that the snow temperature cools (warms) from the surface layer to the deep layer in the summer (winter), indicates rapid warming at the beginning of summer (September–October), and rapid cooling at the end of the summer (except 10 m depth), and is preceded and followed by smaller rates of snow temperature change, similar to air temperature features. Among the three AWS sites, Dome A (LGB69) experiences the greatest (smallest) variability in the annual variation of snow temperature, with amplitudes of 28, 17, and 7°C (18, 12, and 5°C) at 0.1, 1, and 3 m depths, respectively, and Eagle temperature varying in between, but at 10 m depth the yearly amplitude is only c. 0.4°C for all the three sites. For LGB69, Eagle and Dome A the amplitudes of the annual cycle at 10 m depth is only 1.4–2.2% of the amplitude at 0.1 m depth, so the 10 m depth can be assumed to be a layer with constant temperature. Longwave radiative fluxes and turbulent fluxes influence only the top few millimetres of the snow/ice, while a significant part of the absorption (> 50%) shortwave radiation also occurs in the top few millimetres of the snow/ice and the residue exponentially decreases towards the deep layer (Brandt & Warren Reference Brandt and Warren1993). Therefore, the exponential attenuation in the temperature cycle with depth is a result of thermal conduction. The amplitude at 10 m depth is typically about 2.3% of that at the snow surface (Xie et al. Reference Xie, Fan and Tian1991). The phase of the temperature cycle is also lagged with depth, and the maximum monthly mean firn temperature which occurs in January at 0.1 m depth, does not occur until February at 3 m.
Monthly mean firn temperature at different depths over the observation period at LGB69, Eagle and Dome A.

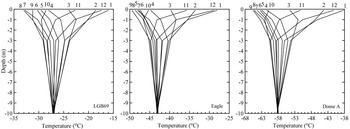
Figure 17 illustrates the monthly mean firn temperature as a function of depth for the three AWS during the observation period. The near surface temperatures warm rapidly between October and December (by 11.1, 16.4 and 19.6°C at LGB69, Eagle and Dome A), and cool rapidly from February–April at rates similar to spring warming. In both cases the rate of change increases with the elevation and distance from the coast. The changes are slower at other times of year. This is similar to observations at Plateau station (Weller & Schwerdtfeger Reference Weller and Schwerdtfeger1970). At all sites the surface layer is warmest in January and coldest in August or September. At Eagle and Dome A the 0.1 m firn temperature rises sharply in October, with an increase of 4.1 and 4.7°C respectively over September. The variation of firn temperature below 3 m depth is similar at all sites. Cooling occurs from January–May and warming from June–December, with the nearly constant temperature at 10 m depth. The depth-dependent curves of firn temperature in Fig. 17 are asymmetric as a result of the attenuation of temperature amplitude and the shift in phase during the process of heat conduction with depth.
Monthly mean firn temperature as a function of depth at LGB69, Eagle, and Dome A.

Conclusions
Using data from ZS and three AWS to investigate the near surface climate of the East Antarctic ice sheet along the traverse route from ZS to Dome A, we find that:
1) Air and firn temperature, accumulation and specific humidity decrease with increasing elevation and distance from the coast. Annual mean air temperature decreases from -9.2°C at ZS to -51.6°C at Dome A, and the specific humidity decreases from 1.22 g kg-1 to 0.06 g kg-1. The snow accumulation declines from 199 mm w.e. yr-1 at LGB69 to 31 mm w.e. yr-1 at Dome A.
2) Annual mean surface wind speed is strongest at LGB69 and weakest at Dome A (2.1 m s-1). It increases rapidly from the coastal area to the escarpment region, and then drops quickly towards the interior of the plateau. The strongest wind occurs at the site with the greatest surface slope.
3) A strong coreless winter temperature regime exists at all the stations. The corelessness factor increases with elevation and distance from the coast, from 0.260 at ZS to 0.433 at Dome A.
4) The surface temperature lapse rate is close to the dry adiabatic value between the coast and the escarpment region (ZS to LGB69). Between LGB69 and the inland plateau site, Eagle, the surface slope decreases rapidly and the lapse rate increases to super adiabatic, reaching a value twice the adiabatic value (1.97°C 100 m-1). The surface lapse rate then reduces to 0.87°C 100 m-1 between Eagle and Dome A and is slightly smaller than the dry adiabatic value.
5) Both temperature and pressure all show a distinct semi-annual oscillation signal with a primary minimum in spring (September or October) and a secondary minimum in autumn (March or April). The second harmonic of temperature annual cycle explains 8% of the variance in the coastal and the escarpment region, and 16% on the plateau. The amplitude of the second temperature harmonic increases from 2.0–2.4°C in the coastal and escarpment region to 4.5–5.6°C on the plateau. The contribution of the second harmonic to the annual pressure variation decreases from 53% at the coast to 18% at the escarpment region, then increases again to 43–47% on the inland plateau. The seasonal cycle of pressure (the third harmonic wave) contributes to some extent to the annual pressure variation. In other words, the pressure annual oscillation signal exists as a 3-wave structure (seasonal oscillation).
6) The depth-dependent temporal curve of snow temperature exhibits an asymmetric structure due entirely to the attenuation of temperature amplitude and is lagged in phase with increased depth during the process of heat conduction through the snow/ice.
Acknowledgements
We thank M. Sparrow and J. Burgess for carefully reviewing the original manuscript. Special recognition is given to all personnel involved in the CHINAREN traverse program. This work was supported by the National Key Technologies R&D Program of China (2006BAB18B05), National Natural Science Foundation of China (40575033, 40776002, 40620120112), and Chinese Arctic and Antarctic Administration (CAA) IPY (2008–09) Program. The involvement of IA was supported by the Australian Government’s Cooperative Research Centre program through the Antarctic Climate and Ecosystems Cooperative Research Centre (ACE CRC). The constructive comments of the reviewers and editor are also gratefully acknowledged.